Báo cáo hóa học: " Research Article Wavelets in Recognition of Bird Sounds" pdf
Bạn đang xem bản rút gọn của tài liệu. Xem và tải ngay bản đầy đủ của tài liệu tại đây (1.36 MB, 9 trang )
Hindawi Publishing Corporation
EURASIP Journal on Advances in Signal Processing
Volume 2007, Article ID 51806, 9 pages
doi:10.1155/2007/51806
Research Article
Wavelets in Recognition of Bird Sounds
Arja Selin, Jari Turunen, and Juha T. Tanttu
Department of Information Technology, Tampere University of Technology, Pori, P.O. Box 300, 28101 Pori, Finland
Received 9 September 2005; Revised 30 May 2006; Accepted 22 June 2006
Recommended by Gerald Schuller
This paper presents a novel method to recognize inharmonic and transient bird sounds efficiently. The recognition algorithm
consists of feature extraction using wavelet decomposition and recognition using either supervised or unsupervised classifier. The
proposed method was tested on sounds of eight bird species of which five species have inharmonic sounds and three reference
species have har monic sounds. Inharmonic sounds are not well matched to the conventional spectral analysis methods, because
the spectral domain does not include any visible trajectories that computer can track and identify. Thus, the wavelet analysis was
selected due to its ability to preserve both frequency and temporal information, and its ability to analyze signals which contain
discontinuities and sharp spikes. The shift invariant feature vectors calculated from the wavelet coefficients were used as inputs of
two neural networks: the unsupervised self-organizing map (SOM) and the supervised multilayer perceptron (MLP). The results
were encouraging: the SOM network recognized 78% and the MLP network 96% of the test sounds correctly.
Copyright © 2007 Arja Selin et al. This is an open access article distributed under the Creative Commons Attribution License,
which permits unrestricted use, distribution, and reproduction in any medium, provided the or iginal work is properly cited.
1. INTRODUCTION
Nearly all birds make different kinds of sounds which are
used in communication with other conspecifics and also
between different species. Sounds are only produced when
needed, and so all the sounds have some meaning [1, 2].
Most sounds are produced by the syrinx, which is the avian
vocal organ [3]. In most sp ecies the syrinx is bipartite, so
the bird can produce two notes simultaneously [4, 5]. Bird
sounds can be tonal or inharmonic, which is one way to di-
vide the bird species into groups. Inharmonic sounds are
often transient and their frequency contents are very near
each other. Bird vocalization contains both songs and calls.
Calls are shorter and simpler than songs, and both sexes pro-
duce them throughout the year. It seems that most birds have
from 5 to 15 distinct calls, and the functions of them can
be, for example, flight, alarm, excitement, and so on. Some
birds can have several different calls for the same function,
whereas some birds use very similar calls in different circum-
stances to mean different things. In addition, in many species
there is hig h individual and regional variability in phrases
and song patterns [6–9]. Thus, two kinds of bird sound var i-
ability have to be taken into account in the classification.
One is the variation of different sound types and another is
the variation across geogr aphic regions and among individ-
uals.
Human ear and br ain constitute an effective voice recog-
nition system. For the human ear it is relatively easy to notice
even subtle differences in sounds, whereas for the computer
the recognition task is much m ore difficult. In bird sound
research, the typical methods of classification have been lis-
tening and visual assessment of spectrograms. However, hu-
man decision is always subjective. So, the automatization of
this classification process would be an impor tant new tool
for bioacoustic research [10]. Automatic classification of-
fers new possibilities for the identification of vocal groups of
birds, and may also give new tools for the classification of the
sounds of other animals.
Classification of bird sounds has been studied a lot and its
application range includes, for example, bird census and tax-
onomy [11–13]. Nevertheless, only a few studies exist w h ere
the identification of bird species by their sound is made
automatically [14–19]. Most of these studies, for example,
[14, 17], have focused on tonal and harmonic sounds, and
are based on conventional spectral analysis methods. These
methods are not well matched to inharmonic and transient
sounds. In [ 19 ] inharmonic bird sounds have been classified
using 19 low-level parameters of syllables. It seems, however,
that the number of parameters is probably too high for an
efficient recognition algorithm.
The aim of our study was to develop a computationally
effective recognition method for inharmonic bird sounds,
2 EURASIP Journal on Advances in Signal Processing
and to investigate the applicability of the wavelet analysis for
this task. The wavelet analysis has gained a great deal of atten-
tion in the field of digital signal processing [20]. It has many
advantages, for example, its ability to find out both frequency
and temporal information, and to analyze signals which con-
tain discontinuities and sharp spikes. These properties are
appropriate for inharmonic and transient bird sounds. In the
wavelet packet transform the original signal is converted into
wavelet coefficients. The orthogonal wavelet packets can be
designed by hierarchical association of PR (perfect recon-
struction) paraunitary filter banks [21]. Because the number
of the coefficients is usually large after the decomposition and
because using all wavelet coefficients as features will often
lead to inaccurate results, the extraction of the most impor-
tant features is essential. The feature extraction from wavelet
coefficients has been studied, for example, in [22, 23]. In spite
of the many advantages of the wavelet transform, it also has
a disadvantage: it is time dependent. To avoid this problem,
four shift invariant parameters were used as features in this
study.
Artificial neural networks (ANNs) are being applied to
pattern recognition and have successfully been used in the
automated classification of acoustic signals including animal
sounds [24–27]. The ANNs have also been used in the clas-
sification and recognition of bird sounds [28–30]. In this
study, two commonly known neural networks, the unsuper-
vised self-organizing map (SOM) and the supervised multi-
layer perceptron (MLP), were selected as the classifiers due
to their ability to compensate discrepancies among the data.
The distinguishability of bird species was first examined with
the SOM, which is essentially a clustering algorithm, and af-
ter that the sound data was classified using the MLP.
2. METHODS
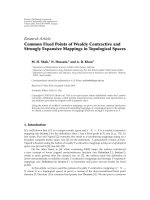
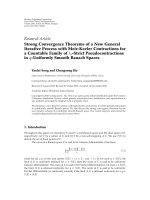
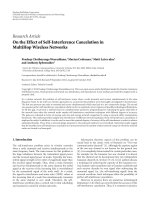
The model of the whole recognition process is presented in
Figure 1. During the preprocessing the noise was reduced
from the soundtracks. Then the soundtracks were segmented
into smaller pieces which are called sounds in the sequel.
During the postprocessing the sounds were checked manu-
ally. All the sounds were decomposed into the wavelet co-
efficients using the wavelet packet decomposition ( WPD).
The features were calculated from these wavelet coefficients
and the feature vectors were composed. The feature vectors
of the training data were introduced to the MLP and the
SOM networks during the training phase. Final ly, both net-
works were tested on separate testing data and the recog-
nition results were examined. Altogether, the phases of the
recognition process were automatic, except the checking of
the sounds, which was made manually.
2.1. Preprocessing, segmentation, and postprocessing
During the preprocessing the zero mean data was normal-
ized in the range [
−1, 1], and the low-frequency wind noise
was reduced using a long moving average filter. Because the
noise level varied a lot between the sound tracks, the noise
threshold level was calculated adaptively from long-term
Preprocessing Segmentation Postprocessing
Wave let
decomposition
Feature
calculation
Network
training
Network
testing
Recognition
results
Figure 1: The recognition process.
Calculation
of the
threshold
Thres-
holding
Thres-
holding
s
8
S
8
S
1
s
1
s
S
1
s
1
S
8
s
8
s
8
s
T
h0
.
.
.
.
.
.
Figure 2: The noise reduction using the filter bank.
mean energy value during the segmentation. The sound-
tracks were extracted automatically into smaller pieces iden-
tifying the beginning and ending of each call. The soundtrack
was clipped if the onset of the sound exceeded the adaptive
threshold level and the end of the sound dropped under that
threshold value.
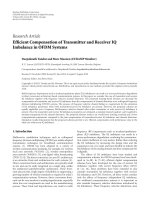
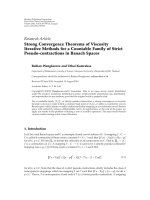
During the postprocessing the interfering broadband
noise was reduced from the sound signal, s, using the eight-
band filter bank (cf. Figure 2).
The outputs
s
i
(n) from the thresholding blocks were cal-
culated as
s
i
(n) =
⎧
⎨
⎩
0ifs
i
(n) <T
h0
,
sgn
s
i
(n)
s
i
(n)
−
T
h0
else
for i
= 1, ,8,
(1)
where the threshold value T
h0
wasdefinedas2timesthe
standard deviation of the output s
8
after preliminary tests.
Reduction of the noise emphasized the essential informa-
tion of the bird sound. At the end of the postprocessing all
sounds were checked manually and verified consistently. A
few sounds were recorded in a very noisy environment or
they were in inseparable groups, and were therefore rejected
during the manual checking.
2.2. Wavelet packet decomposition
The wavelet packet analysis was used for the signal decompo-
sition [31, 32]. In the WPD the signal s is split into approxi-
mation (A) and detail (D) parts. Due to the downsampling,
aliasing occurs in the WPD tree. This aliasing changes the
Arja Selin et al. 3
S
AD
ADAD
ADADADAD
ADADADADADADADAD
ADADADADADADADADADADADADADADADAD
ADADADADADADADADADADADADADADADADADADADADADADADADADADADADADADADAD
6
5
4
3
2
1
N
1 2 3 4 5 6 7 8 32 64
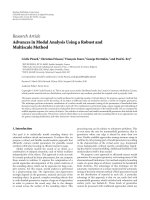
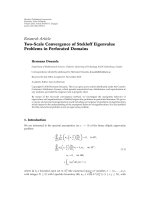
Figure 3: The symmetric wavelet decomposition tree. The grey bins are used in the proposed method.
frequency order of some branches of the tree [33]. The sym-
metric wavelet decomposition tree is illustrated in Figure 3,
where the WPD tree is put in an increasing frequency order
from the left to the right.
The preliminary tests showed that the best decomposi-
tion level (N) was six. Thus, the signal s was split into 2
6
= 64
parts, which are called bins in the sequel. The bin number 1
contained so low frequencies that proved to be irrelevant for
the recognition. Because the bins 33–64 also proved to be ir-
relevant, the wavelet coefficients were calculated from bins
2–32 marked grey in Figure 3.
There are several wavelet families that have proved to
be particularly usable [34]. The Daubechies wavelet family
(dbN) was selected, because in it both scaling and wavelet
functions are compactly supported and they are orthogo-
nal. The 10 dB was selected for the wavelet function, because
the preliminary tests showed that it compromised the best
decomposition results of the tested alternatives with the se-
lected bird sounds.
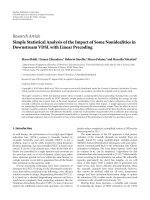
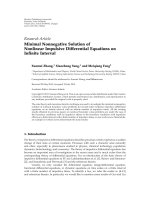
2.3. Features
As mentioned before, the main disadvantage of the wavelet
transform is its time dependence. That is why the four shift
invariant parameters were selected as features. These four
features, maximum energy, position, spread,andwidth are il-
lustrated in Figure 4.
The number of the WPD coefficients of each bin is de-
noted as n
c
. The bin energy E
B
(r) of the wavelet coefficients
c of bin r was defined as
E
B
(r) =
n
c
n=1
c
2
(n, r), r = 2, 3, , 32, (2)
and the average energy
E
B
(r)ofeachbinr was defined as
E
B
(r) =
E
B
(r)
n
c
. (3)
The largest average energy value
E
m
= max
r
E
B
(r)
(4)
was then searched, and it is called the maximum energy E
m
of
the sound. The position P represents the number of the bin r,
in which the maximum energy was located.
The spread S was calculated as
S
=
1
#J
(q,r)∈J
c
2
(q, r), (5)
500 1000 1500 2000 2500 3000 3500 4000
2
4
7
10
12
14
16
18
20
22
24
26
28
30
32
Bins
Samples
Width
Position
Maximum
energy
Spread
Figure 4: The four shift invariant features: maximum energy, po-
sition, spread, and width. The larger absolute values of the wavelet
coefficients are presented with the darker color.
where q is the number of the sample and r is the number of
the bin. J is a set of index pairs (q, r)forwhichc
2
(q, r) >
T
h1
(r). In (5) #J is the number of elements (cardinality) of
the set J. So, the spread S is a sum of the average energies of
those coefficients whose energy exceeded the threshold value
T
h1
. After the preliminary test with the data the threshold
value T
h1
(r) was calculated as
T
h1
(r) =
E
B
(r)
6
(6)
from the average energy
E
B
(r)ofbinr.
The fourth feature, the width W represents the number
of bins which satisfy the inequality
E
B
(r) >T
h2
,(7)
where the threshold value T
h2
was selected as 1.3afterpre-
liminary tests w ith the data.
Finally all four features were normalized, in order to be
comparable with one another. The normalization levels were
defined after preliminary tests with the data. The maximum
energy E
m
was normalized as
E
m
=
E
m
n
B
,(8)
4 EURASIP Journal on Advances in Signal Processing
Table 1: Selected set of bird sounds used in this study.
Scientific abbr. Scientific name English name Sound type MLP training SOM training Testing
ANAPLA Anas platyrhynchos Mallard Inharmonic 138 113 60
ANSANS
Anser anser Greylag goose Inharmonic 135 113 59
COTCOT
Coturnix coturnix Quail Tonal 190 113 83
CRECRE
Crex crex Corncrake Inharmonic 443 113 110
GLAPAS
Glaucidium passerinum Pygmy owl Pure harmonic 113 113 48
LOCFLU
Locustella fluviatilis River warbler Inharmonic 890 113 328
PICPIC
Pica pica Magpie Inharmonic 203 113 97
PORPOR
Porzana porzana Spotted crake Tonal 166 113 69
— — — — 2278 904 854
where n
B
is the number of the coefficients of the bin which
exceeded the T
h1
. The position P was normalized as
P =
P
2
N
/4
=
P
16
. (9)
The spread S was normalized as
S =
S
100
(10)
and the width W as
W =
W
20
. (11)
Thus, 31
× n
c
WPD coefficients were reduced to four nor-
malized features: maximum energy
E
m
, position
P,spread
S,
and width
W. These four features formed the final feature
vector for recognition. The main reason for the normaliza-
tion was the SOM, which yields better recognition results if
the inputs are in the same scale. In addition, the training time
of the SOM network is shorter with normalized inputs.
2.4. Classifiers
Two commonly known neural networks, unsupervised self-
organizing map (SOM) [35] and supervised multilayer per-
ceptron (MLP) [36], were used as classifiers. The neural net-
works were selected due to their ability to compensate dis-
crepancies in the data. This is one way to deal with the in-
dividual and regional variability of bird vocalizations. The
motivation for using unsupervised and supervised networks
was to verify the predefined decisions of the supervised MLP
against the unsupervised SOM, and to compare their rela-
tive performance. In the SOM the four-dimensional data was
mapped into two-dimensional space. The SOM clusters the
data so that neighbouring clusters are quite similar, while
more distant clusters become increasingly diverse [35]. The
low and high variability between the sounds of the species
can be seen from the compactness of the clusters. Thus, in
this study the distinguishability of the species was first exam-
ined with the SOM, and after that the classification was made
with the MLP.
In the SOM training the calculated feature vectors were
introduced to a 10
× 10-size SOM network. The other sizes,
for example, 6
× 6, 8 × 8, and 12 × 12, of the network were
also tested. However, the chosen size yielded best recognition
results. The SOM network was trained for up to 3000 epochs
using the training data (cf. Table 1). The results did not im-
prove although the number of the epochs was changed.
After preliminary tests, the selected MLP architecture was
4-15-40-3. Each output was finally rounded to 0 or 1, and
then three output bits of each sound were converted into
numbers 1–8, which was enough for classes of eight bird
sounds. The MLP network was trained for up to 65 epochs
and the mean square error goal was 0.0001. After the train-
ing, it became obvious that all the nodes, and the weighting
and bias parameters of the MLP network were needed, which
means that none of the outputs of the nodes was too close to
zero. Both networks were tested on separate testing data after
the training.
3. THE BIRD SOUND DATA
Our main purpose was to study the efficient recognition of
inharmonic or transient bird sounds. The sampling rate of
the sound data, F
s
,was44.1 kHz and 16-bit accuracy was
used. The data was analyzed in the Matlab environment [37],
and the Wavelet Toolbox [34] was utilized. The idea was to
choose such bird species whose sounds are inharmonic and
sounds which resemble one another. This is the reason why
the inharmonic sounds of the mallard, the greylag goose, the
corncrake, the river warbler and the magpie were selected.
The sounds of the quail and the spotted crake are tonal, but
contain some transient features, for example, irregular pitch
period. The pure tonal territorial song of the male pygmy owl
was chosen as a reference sound.
In the classification, the variation of different sound types
in every species has to be taken into account by examin-
ing each sound type separately. That is why only one type
of call of each species was used in this study. However, sev-
eral types of calls of the greylag goose were included, be-
cause these calls are very similar to one another. Hence, it was
Arja Selin et al. 5
tested how the greylag goose can be recognized using many
types of calls. In addition, a sufficient number of recordings
of those eight species was available quite easily and the qual-
ity of the recordings was sufficient. The data of the selected
eight species is summar ized in Table 1. The table contains sci-
entific abbreviations and names, English names, and sound
types. Also the number of sounds in the training and testing
is indicated.
The sounds were recorded in Finland by Pertti Kali-
nainen, Ilkka Heiskanen, and Jan-Erik Bruun. There were
totally 3132 sounds which were divided into tr a ining data
(2278 sounds) and testing data (854 sounds). The training
and testing data were from different tracks. It turned out that
if there were the same number of training data of each group,
the SOM network yielded better results. Thus, in the case of
the SOM network the training data was reduced to 113 sam-
ples per species.
The typical spectrograms and corresponding wavelet co-
efficient figures of eight species that were used in this study
are presented in Figure 5. As can be seen, the wavelet trans-
form compresses the energy of the coefficients more than tra-
ditional Fourier transform in spectrograms. Only the very es-
sential information is preserved after the WPD.
4. RESULTS
4.1. Results using the SOM
The clustering result of the SOM network after training is
illustrated in Figure 6.
The areas marked with letters present how sounds of
each bird species were situated in the 10
× 10 SOM net-
work (cf. Section 2.4) after the overlapping nodes had been
analyzed. The SOM network was examined node by node
and the outliers were labelled. The species which had most
sounds in a particular node won and the possible other
sounds were classified as outliers. If two or more differ-
ent species had the same number of sounds in a particu-
lar node, all were classified as outliers. If no species won,
the node was classified as unspecified. If no sound is situ-
ated in the node, it was classified as empty node. Unspecified
nodes are marked with black color and empty nodes w ith
grey color in Figure 6. In the SOM, compact clusters rep-
resent the species with little var iation between sounds, and,
respectively, the scattered clusters represent the species with
large variation. As it can be seen, for example, the test sounds
of the river warbler (R) form a compact and uniform area,
whereas the sounds of the greylag goose (G) spread out in a
broad area. The SOM clustered 87% of training sounds cor-
rectly.
The confusion matrix of Table 2 illustrates the recogni-
tion result of the SOM network after the trained network had
been tested on the test sounds. The rows of the confusion ma-
trix show how each species is recognized. Al l the test sounds
of the river warbler (LOCFLU) were recognized correctly, as
can be seen from the diagonal of the matrix. Altogether, 7%
of the test sounds were unspecified and 15% were recognized
wrongly. It should be noticed that only 51% of the sounds of
the greylag goose were recognized correctly, and 23% of the
sounds were recognized unspecified. That might result from
the fact that several types of calls of the greylag goose were
included in the study. Altogether, 92 sounds of all 854 test
sounds were recognized wrongly. A total of 78% of the test
sounds were recognized correctly with the SOM network.
4.2. Results using the MLP
Table 3 contains the recognition result of the MLP network.
All the test sounds of the quail (COTCOT) and the spot-
ted crake (PORPOR) were recognized correctly. Again, the
recognition result of the sounds of the greylag goose was
poor, and the reason might be the same as with the SOM
network. Twenty-four sounds of all the test sounds were rec-
ognized wrongly. Altogether, 96% of the test sounds of the
eight bird sp e cies were recognized correctly with the MLP
network.
5. DISCUSSION AND CONCLUSIONS
Our purpose was to study how inharmonic and transient
bird sounds can be recognized efficiently. The results of this
study are very encouraging. The results indicate that it is pos-
sible to recognize bird sounds of the test species using neural
networks with only four features calculated from the wavelet
packet decomposition coefficients.
Segmentation plays an important role in sound recogni-
tion, b ecause incorrectly segmented sounds will probably be
classified wrongly. In most cases, segmentation is the most
complicated and challenging part of the whole recognition
process. However, it is quite difficult to make it totally au-
tomatic. Noise reduction goes hand in hand with successful
segmentation. The segmentation is even more difficult if the
sound tracks are very noisy. In this study the segmentation
and noise reduction were implemented so that the original
sound information of the target species remained as intact
as possible. After the automatic segmentation, all the sounds
were checked manually. The noise reduction was done using
an eight-band filter bank, which reduced the irrelevant noise
information and emphasized the essential information of the
bird sound. The main purpose of the preprocessing was to
control the signal quality so that all sounds were comparable
with each other.
The selection of the wavelet function and the decomposi-
tion level are the most import ant phases of the WPD. In this
study the 10 dB was selected for the wavelet function and the
level of the decomposition was selected to be six after pre-
liminary testing. The preliminary tests were used because the
authors do not know any reliable algorithm for selecting the
wavelet function and the decomposition level properly. The
preliminary tests indicated that the 10 dB wavelet function
and the 6th decomposition level compromised the best de-
composition results with selected bird sounds.
The four features were calculated from the wavelet packet
decomposition coefficients. Many kinds of other features
were calculated from the coefficients and they were also
tested. However, the chosen four features: maximum energy,
6 EURASIP Journal on Advances in Signal Processing
2000 4000 6000 8000
2
4
6
8
10
Frequency (kHz)
Samples
ANAPLA
(a)
2000 4000 6000 8000
4
8
12
16
20
24
28
32
Bins
Samples
ANAPLA
(b)
2000 6000 10000
2
4
6
8
10
Frequency (kHz)
Samples
ANSANS
(c)
2000 6000 10000
4
8
12
16
20
24
28
32
Bins
Samples
ANSANS
(d)
500 1500 2500 3500
2
4
6
8
10
Frequency (kHz)
Samples
COTCOT
(e)
500 1500 2500 3500
4
8
12
16
20
24
28
32
Bins
Samples
COTCOT
(f)
1000 3000 5000 7000
2
4
6
8
10
Frequency (kHz)
Samples
CRECRE
(g)
1000 3000 5000 7000
4
8
12
16
20
24
28
32
Bins
Samples
CRECRE
(h)
0.511.522.5
10
4
2
4
6
8
10
Frequency (kHz)
Samples
GLAPAS
(i)
0.511.522.5
10
4
4
8
12
16
20
24
28
32
Bins
Samples
GLAPAS
(j)
500 1500 2500 3500
2
4
6
8
10
Frequency (kHz)
Samples
LOCFLU
(k)
500 1500 2500 3500
4
8
12
16
20
24
28
32
Bins
Samples
LOCFLU
(l)
500 1500 2500 3500
2
4
6
8
10
Frequency (kHz)
Samples
PICPIC
(m)
500 1500 2500 3500
4
8
12
16
20
24
28
32
Bins
Samples
PICPIC
(n)
1000 3000 5000
2
4
6
8
10
Frequency (kHz)
Samples
PORPOR
(o)
1000 3000 5000
4
8
12
16
20
24
28
32
Bins
Samples
PORPOR
(p)
Figure 5: (a), (c), (e), (g), (i), (k), (m), and (o) typical spectrograms and (b), (d), (f), (h), (j), (l), (n), and (p) corresponding wavelet
coefficients of the eig ht species used in this study are presented. The frequency and bins are bounded to 11.025 kHz (Fs/4), because at the
higher frequencies there was no essential information. In the spectrograms the darker colors represent the higher energies of the sound.
Correspondingly, the larger absolute values of the coefficient are presented with the darker color in the adjacent wavelet coefficient fi gures.
The range of the coefficients is [
−5, 5].
position, spread, and width, described and separated the
sounds of the eight bird species best.
The data of the eight bird species that was used in this
study was divided so that there were about 70% training data
and 30% testing data. Both networks, the SOM and the MLP,
were first trained and then tested on separate data. The train-
ing data contained very probably sounds of seven mallard,
nine graylag goose, three quail, eight corncrake, five pygmy
owl, two river warbler, six magpie, and three spotted crake
individuals. The testing data was selected from t racks dif-
ferent from the training data and it was also very probably
from different individuals. So, the testing data consisted of
Arja Selin et al. 7
Table 2: The confusion matrix in percentage terms when using the SOM network.
% ANAPLA ANSANS COTCOT CRECRE GLAPAS LOCFLU PICPIC PORPOR Unspecified
ANAPLA 78 20 0 0 0 0 0 0 2
ANSANS 24 51 00000223
COTCOT 0 0 87 00 084 1
CRECRE 0 0 0 83 001016
GLAPAS 0 15 0 0 75 00 0 10
LOCFLU 0 0 0 0 0 100 00 0
PICPIC 1 0 2 1 0 0 58 38 0
PORPOR 0 0 0 0 0 0 9 91 0
Table 3: The confusion matrix in percentage terms when using the MLP network.
% ANAPLA ANSANS COTCOT CRECRE GLAPAS LOCFLU PICPIC PORPOR
ANAPLA 98 2000000
ANSANS 2 83 1.7 5.1 1.7 5.1 1.7 0
COTCOT 0 0 100 00000
CRECRE 1 2 0 96 0010
GLAPAS 0 2 0 0 96 200
LOCFLU 0 0.3 0 0 0 99.7 00
PICPIC 0 0 5 1 0 0 94 0
PORPOR 0 0 0 0 0 0 0 100
PPPP AGGGG
PP GAAGAGG
PPPPGAAGAG
PPPG GAAGG
GQ GA AAAG
QS SSC GGA
QS SS SM RR
Q MS SMRRRC
Q MMMSSRRC
Q Q QQ QM R R C C
PGLAPAS,pygmyowl
CCRECRE,corncrake
QCOTCOT,quail
G ANSANS, g reylag goose
A ANAPLA, mallard
S PORPOR, spotted crake
M PICPIC, magpie
R LOCFLU, river warbler
Unspecified node
Empty node
Figure 6:Theclusteringresultofthe10× 10 SOM network after
training.
sounds of two mallard individuals, four graylag goose, two
quail, two corncrake, and two pygmy owl individuals, and
one river warbler, one magpie, and one spotted crake indi-
viduals.
In conclusion, the SOM classified 78% and the MLP 96%
of the test sounds correctly. After the testing of both net-
works, all wrongly recognized sounds were manually exam-
ined and label led. The test result showed that 24 sounds were
recognized wrongly using the MLP network. In the SOM
network 39 of test sounds were unspecified and 92 sounds
were recognized wrongly. After plotting and examining all
the wavelet packet coefficient figures of the misrecognitions,
the reason for the most wrong recognitions became obvi-
ous. Firstly, the coefficient pattern of the misrecognitions was
shifted so that two features, the position and the width, were
strayed. Secondly, the wrong recognition resulted presum-
ably from false segmentation or low signal-to-noise ratio.
The proposed method provides quite a robust approach
to sound recognition, particularly to the inharmonic and
transient bird sounds. The variability among the bird sounds
within and between the species was taken into account us-
ing neural networks in the classification. The sounds of the
selected eight species vary only slightly. Also, the variation
across geographic regions was insignificant, because all the
sounds were recorded in Finland.
In conclusion, the results presented in this paper are very
encouraging. They indicated that it is possible to recognize
bird sounds using neural networks w i th only four features
calculated from the wavelet packet coefficients. Although the
neural networks have many benefits, such as their ability
to learn and therefore generalize the variability of the data,
there is a long way to go before the recognition system beats
the human e ar. When using neural networks in the pattern
8 EURASIP Journal on Advances in Signal Processing
classification, there has to be a fixed number of classes into
which activations are classified. Hence, the disadvantage of
the neural networks is the fixed number of output classes,
that is, closed set of species. When more species need to be
classified, the network has to be retrained all over again be-
fore it can be tested on a new set of birds.
Although the tested algorithms proved to be quite ro-
bust recognition methods for a limited set of birds, the pro-
posed method cannot beat a human expert listener. A human
expert listener can identify birds with almost 100% accu-
racy by using a priori knowledge and environmental or other
context-dependent information for classification, whereas
our proposed method uses only a short recording without
any other information. In [19] the inharmonic bird sounds
were recognized with nearest neighbor classifier using Maha-
lanobis distance measure with 74% accuracy, whereas in this
study the SOM classified 78% and the MLP 96% of the in-
harmonic bird sounds correctly. On the other hand, the re-
sults are quite incomparable to other methods, because the
test set of birds was limited and the features were calculated
differently.
The method tested in this study is intended for automatic
monitoring of birds that are living in a predefined area or
night time active birds or migratory birds whose probability
of existence is known beforehand. The continuous monitor-
ing of the same birds is costly and time-consuming. Thus, the
aid of automatic recognition in field work might be desirable.
The algorithm must be fine-tuned in a way that it recognizes
the predefined and limited set of birds correctly either leaving
out or storing the uncertain or unknown sounds for manual
checking.
Automatic recognition presents a new method for iden-
tifying and differentiating bird species by their sounds, and
may offer new tools also for bird researchers. However, the
automatic recognition of bird species is by no means an easy
task. The fact that sounds and calls vary among species and
the same species might have many call types make automatic
recognition even more difficult. In this demanding task the
wavelet transform has proven to be an efficient method to be
taken into consideration.
6. ACKNOWLEDGMENTS
The authors would like to thank Pertti Kalinainen, Ilkka
Heiskanen, and Jan-Erik Bruun for their recordings and Do-
cent Mikko Ojanen for his helpful comments on biologi-
cal issues. The authors also wish to thank the reviewers for
their encouraging comments and suggestions. This Research
was funded by the Academy of Finland under research Grant
206652 and by the Ulla Tuominen’s Foundation.
REFERENCES
[1] C.K.CatchpoleandP.J.B.Slater,Bird Song: Biological Themes
and Variations, Cambridge University Press, Cambridge, UK,
1995.
[2] D. E. Kroodsma, The Singing Life of Birds: The Art and Science
of Listening Birdsong, Houghton Miflin, Boston, Mass, USA,
2005.
[3] C. H. Greenewalt, Bird Song: Acoustics and Physiology,Smith-
sonian Institution Press, Washington, DC, USA, 1968.
[4] S. A . Zollinger, T. Riede, and R. A. Suthers, “Production of
nonlinear phenomena in the Northern Mockingbirds (Minus
polyglottos),” in Proceedings of the 1st International Conference
on Acoustic Communication by Animals, pp. 283–284, College
Park, Md, USA, July 2003.
[5]R.A.Suthers,G.Beckers,S.A.Zollinger,E.Vallet,andM.
Kreuzer, “Mechanisms of vocal complexity in birds,” in Pro-
ceedings of the 1st International Conference on Acoustic Com-
munication by Animals, pp. 237–238, College Park, Md, USA,
July 2003.
[6] J. W. Bradbury, “Parrots and technology,” in Proceedings of the
1st Internati onal Conference on Acoustic Communication by An-
imals, pp. 29–30, College Park, Md, USA, July 2003.
[7] M. C. Baker and D. M. Logue, “Population differentiation in a
complex bird sound: a comparison of three bioacoustical anal-
ysis procedures,” Ethology, vol. 109, no. 3, pp. 223–242, 2003.
[8] J. G. Groth, “Call matching and positive assortative mating in
red crossbills,” The Auk, vol. 110, no. 2, pp. 398–401, 1993.
[9] M. S. Robb, “Introduction to vocalizations of crossbills in
Northwestern Europe,” Dutch Birding, vol. 22, no. 2, pp. 61–
107, 2000.
[10] V. B. Deecke and V. M. Janik, “Automated categorization of
bioacoustic signals: avoiding perceptual pitfalls,” Journal of the
Acoustical Society of America, vol. 119, no. 1, pp. 645–653,
2006.
[11] A. M. Elowson and J. P. Hailman, “Analysis of complex vari-
ation: dichotomous sorting of predator-elicited calls of the
Florida scrub jay,” Bioacoustics, vol. 3, no. 4, pp. 295–320, 1991.
[12] J. G. Groth, “Resolution of cryptic species in appalachian red
crossbills,” The Condor, vol. 90, no. 4, pp. 745–760, 1988.
[13] S. F. Lovell and M. R. Lein, “Song variation in a population of
Alder Flycatchers,” Journal of Field Ornithology, vol. 75, no. 2,
pp. 146–151, 2004.
[14] A. H
¨
arm
¨
a, “Automatic identification of bird species based on
sinusoidal modelling of syllables,” in Proceedings of the IEEE
International Conference on Acoustics, Speech, and Signal Pro-
cessing (ICASSP ’03), vol. 5, pp. 545–548, Hong Kong, April
2003.
[15] A. H
¨
arm
¨
a and P. Somervuo, “Classification of the harmonic
structure in bird vocalization,” in Proceedings IEEE Interna-
tional Conference on Acoustics, Speech, and Signal Processing
(ICASSP ’04), vol. 5, pp. 701–704, Montreal, Quebec, Canada,
May 2004.
[16] N. Mesgarani and S. Shamma, “Bird call classification using
multiresolution spectrotemporal auditory model,” in Proceed-
ings of the 1st International Conference on Acoustic Communi-
cation by Animals, pp. 155–156, College Park, Md, USA, July
2003.
[17] J. T. Tanttu, J. Turunen, A. Selin, and M. Ojanen, “Automatic
feature extraction and classification of crossbill (Loxia spp.)
flight calls,” Bioacoust ics
, vol. 15, no. 3, pp. 251–269, 2006.
[18] P. Somervuo and A. H
¨
arm
¨
a, “Bird song recognition based on
syllable pair histograms,” in Proceedings of IEEE International
Conference on Acoustics, Speech, and Sig nal Processing (ICASSP
’04), vol. 5, pp. 825–828, Montreal, Quebec, Canada, May
2004.
[19] S. Fagerlund and A. H
¨
arm
¨
a, “Parametrization of inharmonic
bird sounds for automatic recognition,” in proceedings of the
13th European Signal Processing Conference (EUSIPCO ’05),
Antalya, Turkey, September 2005, Proceedings on CD-ROM.
Arja Selin et al. 9
[20] O. Rioul and M. Vetterli, “Wavelets and signal processing,”
IEEE Signal Processing Magazine, vol. 8, no. 4, pp. 14–38, 1991.
[21] A. K. Soman and P. P. Vaidyanathan, “Paraunitary filter banks
and wavelet packets,” in Proceedings of the IEEE International
Conference on Acoustics, Speech, and Signal Processing (ICASSP
’92), pp. 397–400, San Francisco, Calif, USA, March 1992.
[22] S. Pittner and S. V. Kamarthi, “Feature extra ction from wavelet
coefficients for pattern recognition tasks,” IEEE Transactions
on Pattern Analysis and Machine Intelligence,vol.21,no.1,pp.
83–88, 1999.
[23] R. Learned, “Wavelet packet based transient sig nal classifi-
cation,” M.S. thesis, Massachusetts Institute of Technology,
Cambridge, Mass, USA, 1992.
[24] S. M. Phelps and M. J. Ryan, “Neural networks predict re-
sponse biases of female tungara frogs,” Proceedings of the Royal
Society—Biological Sciences (Series B), vol. 265, no. 1393, pp.
279–285, 1998.
[25] V.B.Deecke,J.K.B.Ford,andP.Spong,“Quantifyingcom-
plex patterns of bioacoustic var iation: use of a neural network
to compare killer whale (Orcinus orca) dialects,” The Journal
of the Acoustical Society of America, vol. 105, no. 4, pp. 2499–
2507, 1999.
[26] J. Placer and C. N. Slobodchikoff, “A fuzzy-neural system
for identification of species-specific alarm calls of Gunnison’s
prairie dogs,” Behavioural Processes, vol. 52, no. 1, pp. 1–9,
2000.
[27] A. Thorn, “Artificial neural networks for vocal repertoire anal-
ysis,” in Proceedings of the 1st International Conference on
Acoustic Communication by Animals, pp. 245–246, College
Park, Md, USA, July 2003.
[28] A. L. McIlraith and H. C. Card, “Birdsong recognition us-
ing backpropagation and multivariate statistics,” IEEE Trans-
actions on Signal Processing, vol. 45, no. 11, pp. 2740–2748,
1997.
[29] A. M. R. Terry and P. K. McGregor, “Census and monitor-
ing based on individually identifiable vocalizations: the role of
neural networks,” Animal Conservation, vol. 5, no. 2, pp. 103–
111, 2002.
[30] P. Somervuo and A. H
¨
arm
¨
a, “Analyzing bird song syllables on
the self-organizing map,” in Proceedings of the Workshop on
Self-Organizing Maps (WSOM ’03), Hibikino, Japan, Septem-
ber 2003, Proceedings on CD-ROM.
[31] A. Boggess and F. J. Narcowich, A First Course in Wavelets with
Fourier Analysis, Prentice-Hall, Upper Saddle River, NJ, USA,
2001.
[32] I. Daubechies, Te n Lec tures on Wavele ts, SIAM, Philadelphia,
Pa, USA, 1992.
[33] A. N. Akansu and R. A. Haddad, Multiresolution Signal De-
composition: Transforms, Subbands, and Wavelets,Academic
Press, Boston, Mass, USA, 1992.
[34] M. Misiti, Y. Misiti, G. Oppenheim, and J M. Poggi, Wavelet
Toolbox for Use with Matlab,MathWorks,Natick,Mass,USA,
2000.
[35] T. Kohonen, Self-Organizing Maps, Springer, Berlin, Germany,
2001.
[36] S. Haykin, Neural Networks: A Comprehensive Foundation,
Macmillan College, New York, NY, USA, 1994.
[37] MathWorks, “Matlab Software Homepage,” June 2005, http://
www.mathworks.com.
Arja Selin was born in Janakkala, Finland,
on May 2, 1970. She received her M.S. de-
gree in 2005. Currently she is preparing her
doctoral thesis in signal processing and pat-
tern recognition.
Jari Turunen received his M.S. and Ph.D.
degrees in 1998 and 2003, respectively, from
Tampere University of Technology. He cur-
rently works as a Senior Researcher at Tam-
pere University of Technology, Pori. His
current research interests cover topics such
as speech and signal processing.
Juha T. Tanttu was born in Tampere, Fin-
land, on November 25, 1957. He received
his M.S. and Ph.D. degrees in electrical en-
gineering from Tampere University of Tech-
nology in 1980 and 1987, respectively. From
1984 to 1992, he held various teaching and
research positions at the Control Engineer-
ing Laboratory of Tampere University of
Technology. He currently holds Professor-
ship of Information Technology at Tampere
University of Technology, Pori.