Báo cáo hóa học: " Research Article Virtual Reality System with Integrated Sound Field Simulation and Reproduction" pptx
Bạn đang xem bản rút gọn của tài liệu. Xem và tải ngay bản đầy đủ của tài liệu tại đây (2.36 MB, 19 trang )
Hindawi Publishing Corporation
EURASIP Journal on Advances in Signal Processing
Volume 2007, Article ID 70540, 19 pages
doi:10.1155/2007/70540
Research Article
Virtual Reality System with Integrated Sound Field
Simulation and Reproduction
Tobias Lentz,
1
Dirk Schr
¨
oder,
1
Michael Vorl
¨
ander,
1
and Ingo Assenmacher
2
1
Institute of Technical Acoustics, RWTH Aachen University, Neustrasse 50, 52066 Aachen, Germany
2
Virtual Reality Group, RWTH Aachen University, Seffenter Weg 23, 52074 Aachen, Germany
Received 1 May 2006; Revised 2 January 2007; Accepted 3 January 2007
Recommended by Tapio Lokki
A real-time audio rendering system is introduced which combines a full room-specific simulation, dynamic crosstalk cancellation,
and multitrack binaural synthesis for virtual acoustical imaging. The system is applicable for any room shape (normal, long, flat,
coupled), independent of the a priori assumption of a diffuse sound field. This provides the possibility of simulating indoor or
outdoor spatially distributed, freely movable sources and a moving listener in virtual environments. In addition to that, near-to-
head sources can be simulated by using measured near-field HRTFs. The reproduction component consists of a headphone-free
reproduction by dynamic crosstalk cancellation. The focus of the project is mainly on the integration and interaction of all involved
subsystems. It is demonstrated that the system is capable of real-time room simulation and reproduction and, thus, can be used as
a reliable platform for further research on VR applications.
Copyright © 2007 Tobias Lentz et al. This is an open access article distributed under the Creative Commons Attribution License,
which permits unrestricted use, distribution, and reproduction in any medium, provided the original work is properly cited.
1. INTRODUCTION
Virtual reality (VR) is an environment generated in the com-
puter with which the user can operate and interact in real
time. One characteristic of VR is a three-dimensional and
multimodal interface between a computer and a human be-
ing. In the fields of science, engineering, and entertainment,
these tools are well established in several applications. Visu-
alization in VR is usually the technology of primary interest.
Acoustics in VR ( auralization, sonification) is not present to
same extent and is often just added as an effect and with-
out any plausible reference to the virtual scene. The method
of auralization with real-time performance can be integrated
into the technology of “virtual reality.”
The process of generating the cues for the respective
senses (3D image, 3D audio, etc.) is called “rendering.” Ap-
parently, simple s cenes of interaction, for instance, when a
person is leaving a room and closes a door, require com-
plex models of room acoustics and sound insulation. Oth-
erwise, it is likely that coloration, loudness, and timbre of
sound within and between the rooms are not sufficiently rep-
resented. Another example is the interactive movement of a
sounding object behind a barrier or inside an opening of a
structure, so that the object is no longer visible but can be
heard by diffraction.
1.1. Sound field modeling
The task of producing a realistic acoustic perception, local-
ization, and identification is a big challenge. In contrast to the
visual representation, acoustics deal with a frequency range
involving three orders of magnitude (20 Hz to 20 kHz and
wavelengths from about 20 m to 2 cm). Neither approxima-
tions of small wavelengths nor large wavelengths can be as-
sumed with general validity. Different physical laws, that is,
diffraction at low frequencies, scattering at high frequencies,
and specular reflections have to be applied to generate a phys-
ically based sound field modeling. Hence, from the physical
point of view (this means, not to mention the challenge of
implementation), the question of modeling and simulation
of an exac t virtual sound is by orders of magnitude more dif-
ficult than the task to create visual images. This might be the
reason for the delayed implementation of acoustic compo-
nents in virtual environments.
At present, personal computers are just capable of sim-
ulating plausible acoustical effects in real time. To reach
this goal, numerous approximations will still have to be
made. The ultimate aim for the resulting sound is not to
be physically absolutely correct, but perceptually plausible.
Knowledge about human sound perception is, therefore, a
very impor t ant prerequisite for evaluating auralized sounds.
2 EURASIP Journal on Advances in Sig nal Processing
Cognition of the environment itself, external events, and—
very important—a feedback of one’s own actions are sup-
ported by the hearing event. Especially in VR environments,
the user’s immersion into the computer-generated scenery is
a very important aspect. In that sense, immersion c an be de-
fined as addressing all human sensory subsystems in a natur a l
way. As recipients, humans evaluate the diverse characteris-
tics of the total sound segregated into the individual objects.
Furthermore, they e valuate the environment itself, its size,
and the mean absorption (state of furniture or fitting). In
the case of an acoustic scene in a room, which is probably
typical for the majority of VR applications, a physically ade-
quate representation of all these subjective impressions must,
therefore, be simulated, auralized, and reproduced. Plausibil-
ity can, however, only be defined for specific environments.
Therefore, a general approach of sound field modeling re-
quires a physical basis and applicability in a wide range of
rooms, buildings, or outdoor environments.
1.2. Reproduction
The aural component additionally enforces the user’s im-
mersive experience due to the comprehension of the envi-
ronment through a spatial representation [1, 2]. Besides the
sound field modeling itself, an adequate reproduction of the
signals is very important. The goal is to transport all spatial
cues contained in the signal in an aurally correct way to the
ears of a listener. As mentioned above, coloration, loudness,
and timbre are essential, but also the direction of a sound and
its reflections are required for an at least plausible scene rep-
resentation. The directional information in a spatial signal is
very impor t ant to represent a room in its full complexity. In
addition, this is supported by a dynamically adapted binaural
rendering which enables the listener to move and turn within
the generated virtual world.
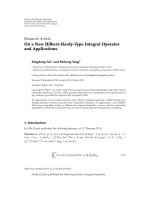
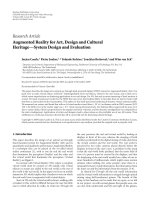
1.3. System
In this contribution, we describe the physical algorithmic ap-
proach of sound field modeling and 3D sound reproduc-
tion of the VR systems installed at RWTH Aachen Univer-
sity (see Figure 1). The system is implemented in a first ver-
sion. It is open to any extended physical sound field mod-
eling in real time, and is independent of any particular vi-
sual VR display technology, for example, CAVE-like displays
[3] or desktop-based solutions. Our 3D audio system named
VirKopf has been implemented at the Institute of Technical
Acoustics (ITA), RWTH Aachen University, as a distributed
architecture. For any room acoustical simulation, VirKopf
uses the software RAVEN (room acoustics for virtual envi-
ronments) as a networked service (see Section 2.1). It is ob-
vious that video and audio processing take a lot of comput-
ing resources for each subsystem, and by today’s standards, it
is unrealistic to do all processing on a single machine. For
that reason, the audio system realizes the computation of
video and audio data on dedicated machines that are inter-
connected by a network. T his idea is obvious and has already
been successfully implemented by [4]or[5]. There are even
VR application
Position
management
Visualization
Room acoustics
Image sources
Early specular
reflections
Auralization server
Filter processing,
low latency
convolution
Ray tracing
Diffuse/
late specular
reflections
Reproduction
Crosstalk
cancellation
Figure 1: System components.
commercially available solutions, which have been realized
by dedicated hardware that can be used via a network inter-
face, for example, the Lake HURON machine [6]. Other ex-
amples of acoustic rendering components that are bound by
a networked interface can be found in connection with the
DIVA project [ 7, 8] or Funkhouser’s beam tracing approach
[9]. Other approaches such as [2]or[10]havenotbeenim-
plemented as a networked client-server architecture but rely
on a special hardware setup.
The VirKopf system differs from these approaches in
some respects. A major difference is the focus of the VirKopf
system, offering the possibility of a binaural sound experi-
ence for a moving listener without any need for headphones
in immersive VR environments. Secondly, it is not imple-
mented on top of any constrained hardware requirements
such as the presence of specific DSP technology for audio
processing. T he VirKopf system realizes a software-only ap-
proach and can be used on off-the-shelf custom PC hard-
ware. In addition to that, the system does not depend on
specially positioned loudspeakers or a large number of loud-
speakers. Four loudspeakers are sufficient to create a sur-
rounding acoustic virtual environment for a single user using
the binaural approach.
2. ROOM ACOUSTICAL SIMULATION
Due to several reasons, which cannot be explained in all de-
tails here, geometr ical acoustics is the most important model
used for auralization in room acoustics [11]. Wave models
would be more exact, but only the approximations of geo-
metrical acoustics and the corresponding algorithms provide
a chance to simulate room impulse responses in real-time ap-
plication. In this interpretation, delay line models, radiosity,
or others are considered as basically geometric as well since
wave propagation is reduced to the time-domain approach of
energy transition from wall to wall. In geometrical acoustics,
deterministic and stochastic methods are available. All deter-
ministic simulation models used today are based on the phys-
ical model of image sources [12, 13]. They differ in the way
how sound paths are identified by using forward (ray) tracing
or reverse construction. Variants of this type of algorithms
are hybrid ray tracing, beam tracing, pyramid tracing, and
so forth [14–20]. Impulse responses from image-like models
Tobi as L en tz e t a l. 3
11109876543210
Order
Energy
Diffuse
Specular
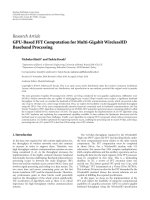
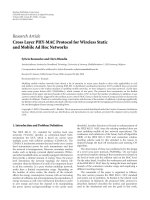
Figure 2: Conversion of specularly into diffusely reflected sound
energy, illustrated by an example (after Kuttruff [23]).
consist of filtered Dirac pulses arranged accordingly to their
delay and amplitude and are sampled with a certain tempo-
ral resolution. In intercomparisons of simulation programs
[21, 22], it soon became clear that pure image source mod-
eling would create too rough an approximation of physical
sound fields in rooms since a very important aspect of room
acoustics—surface and obstacle scattering—is neglected.
It can be shown that, from reflections of order two or
three, scattering becomes a dominant effec t in the tempo-
ral development of the room impulse response [23]even
in rooms with rather smooth surfaces (see Figure 2). For-
tunately, the particular directional distribution of s cattered
sound is irrelevant after the second or third reflection or-
der and can well be assumed as Lambert scattering. How-
ever, in special cases of rooms with high absorption such as
recording studios, where directional diffusion coefficients are
relevant, different scattering models have to be used. Solu-
tions for the problem of surface scattering are given by either
stochastic ray tracing or radiosity [14, 18, 24–27]. Further-
more, the fact that image sources are a good approximation
for perfectly reflecting or low absorption surfaces is often for-
gotten. The approximation of images, however, is valid in
large rooms at least for large distances between the source,
wall, and receiver [28]. Another effect of wave physics—
diffraction—can be introduced into geometrical acoustics
[29, 30], but so far the online simulation has been restricted
to stationary sound sources. Major problems arise, however,
when extending diffraction models to higher orders. Apart
from outdoor applications, diffraction has not yet been im-
plemented in the case of applications such as room acous-
tics. It should, however, be mentioned that numerous al-
gorithmic details have already been published in the field
of sound field rendering so far. New algorithmic schemes
such as those presented by [31] have not yet been imple-
mented. It should be kept in mind here that the two basic
physical methods—deterministic sound images and stochas-
tic scattering—should be taken into account in a sound field
model with a certain performance of realistic physical behav-
ior. Sound transmission as well as diffraction must b e imple-
mented in the cases of coupled rooms, in corridors, or cases
where sound is transmitted through apertures.
2.1. Real-time capable implementation
Any room acoustical simulation should take into account the
above-mentioned physical aspects of sounds in rooms. Typ-
ically, software is available for calculating room impulse re-
sponses of a static source and a listener’s position within a
few seconds or minutes. However, an unrestricted movement
of the receiver and the sound sources within the geometrical
and physical boundaries are basic demands for any interac-
tive on-line auralization. Furthermore, any interaction with
the scenery, for instance, opening a door to a neighboring
room, and the on-line-update of the change of the rooms’
modal structures should be provided by the simulation to
produce a high believability of the virtual world [32].
At present, a room acoustical simulation software called
RAVEN is being developed at our institute. The software
aims at satisfying all above-mentioned criteria for a realis-
tic simulation of the aural component, however, in respec t
of real-time capability. Special implementations offering the
possibility of room acoustical simulation in real time wil l
be described in the following sections. RAVEN is basically
an upgrade and enhancement of the hybrid room acousti-
cal simulation method by Vorl
¨
ander [20], which was fur-
ther extended by Heinz [25]. A very flexible and fast-to-
access framework for processing an arbitrary number of
rooms (see Section 2.2) has been incorporated to gain a high
level of interactivity for the simulation and to achieve real-
time capability for algorithms under certain constraints (see
Section 5.2). Image sources are used for determining early
reflections (see Section 2.3) in order to provide a most ac-
curate localization of primary sound sources (precedence ef-
fect [33]) during the simulation. Scattering and reverbera-
tion are estimated on-line by means of an improved stochas-
tic ray tracing method, which will be further described in
Section 2.4.
2.2. Scene partitioning
The determination of the rooms’ sound reflections requires
an enormous number of intersection tests between rays and
the rooms’ geometry since geometrical acoustics methods
treat sound waves as “light” rays. To apply these methods in
real time, data structures are required for an efficient repre-
sentation and determination of spatial relationships between
sound rays and the room geometry.
These data structures organize geometry hierarchically in
some n-dimensional space and are usually of recursive nature
to accelerate remarkably queries of operations such as culling
algorithms, intersection tests, or collision detections [34, 35].
Our auralization framework contains a preprocessing
phase which transforms every single room geometry into
a flexible data structure by using binary space partitioning
(BSP) trees [36] for fast intersection tests during the simula-
tion. Furthermore, the concept of scene graphs [ 37], which is
basically a logical layer on top of the single room data struc-
tures, is used to make this framework applicable for an arbi-
trary number of rooms and to acquire a high l evel of interac-
tivity for the room acoustical simulation.
4 EURASIP Journal on Advances in Sig nal Processing
Room0
Room1
Room2
012
Figure 3: The scenery is split into three rooms, which are repre-
sented by the nodes of the scene graph (denoted through hexagons).
The rooms are connected to their neighboring rooms by 2 por-
tals (room0/room1 and room1/room2, denoted through the dotted
lines).
2.2.1. Scene graph architecture
To ach ie ve a n efficient data handling for an arbitrary number
of rooms, the concept of scene graphs has been used. A scene
graph is a collection of nodes which are linked according to
room adjacencies.
A node contains the logical and spatial representation
of the corresponding subscene. Every node is linked to its
neighbors by so-call ed portals, which represent entities con-
necting the respective rooms, for example, a door or a win-
dow (see Figure 3). It should be noted that the number of
portals for a single node is not restricted, hence the scenery
can be partitioned quite flexibly into subscenes. The great ad-
vantage of using portals is their binary nature as two states
can occur. The state “active” connects two nodes defined
by the portal, whereas the state “passive” cuts off the spe-
cific link. This provides a high level of interactivity for the
room acoustical simulations as room neighborhoods can
be changed on-line, for instance, doors may be opened or
closed. In addition, information about portal states can be
exploited to speed up any required tests during the on-line
room acoustical simulation by neg lecting rooms which are
acoustically not of interest, for example, rooms that are out
of bounds for the current receiver’s position.
2.3. Image source method
The concept of the traditional image source (IS) method pro-
vides a quite fl exible data structure, as, for instance, the on-
line movement of primary sound sources and their corre-
sponding image sources is supported and can be updated
within milliseconds. Unfortunately, the method fails to sim-
ulatelargesceneriesasthecomputationalcostsaredomi-
nated by the exponential growth of image sources with an
increasing number of rooms, that is, polygons and reflec-
tion order. Applying the IS method to an arbitr ary number
of rooms would result in an explosion of IS to be processed,
which would make a simulation of a large virtual environ-
ment impossible within real-time constraints due to the ex-
treme number of IS to be tested online on audibility.
However, the scene graph data structure (see Section
2.2.1) provides the possibility of precomputing subsets
of potentially audible IS according to the current portal
configuration by sorting the entire set of IS dependent on
the room(s) they originate from. This can easily be done by
preprocessing the power set of the scene S,whereS is a set
of n rooms. The power set of S contains 2
n
elements, and
every subset, that is, family set of S refers to an n-bit number,
where the mth bit refers to activity or inactivity of the mth
room of S. Then, all ISs are sorted into the respective family
sets of S by gathering information about the room IDs of
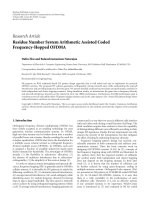
the planes they have been mirrored on. Figure 5 shows ex-
emplarily the power set P of a scenery S containing the three
rooms R2, R1, R0, and the linked subsets of IS, that is, P(S)
=
{{
Primary Source},{IS(R0)},{IS(R1)},{IS(R1, R2)},{IS(R2)},
{IS(R2, R0)}, {IS(R2, R1)}, {IS(R2, R1, R0)}}.
During on-line auralization, a depth-first search [37]of
the scene graph determines reachable room IDs for the cur-
rent receiver’s position. This excludes both rooms that are
out of bounds and rooms that are blocked by portals. This
set of room IDs is encoded by the power set P to set unreach-
able rooms invalid as they are acoustically not of interest. If
in the case of this example room R2 gets unreachable for the
current receiver’s position, for example, someone closed the
door, only IS family sets of P have to be processed for aural-
ization that do not contain the room ID R2. As a consequence
thereof, the number of IS family sets to be tested on audibil-
ity drops from eight to four, that is, P(0), P(1), P(2), P(3),
which obviously leads to a significant reduction of computa-
tion time.
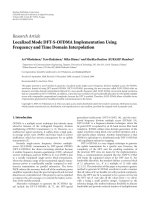
During simulation it will have to be checked whether ev-
ery possible audible image source, which is determined as de-
scribed above, is audible for the current receiver’s position
(see Figure 4(a)). Taking great a dvantage of the scene graph’s
underlying BSP-tree structures and an efficient tree travers-
ing strategy [38], the required IS audibility test can be done
very fast (performance issues are discussed in more detail in
Section 5.2.1). If an image s ource is tested on audibility for
the current receiver’s position, all data being required for fil-
ter calculation (position, intersection points, and hit mate-
rial) will be stored in the super-ordinated container “audible
sources” (see Figure 4(a)).
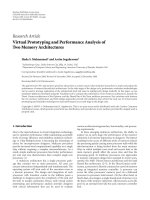
2.4. Ray tracing
The computation of the diffuse sound field is based on the
stochastic ray tracing algorithm proposed by Heinz [39]. For
building the binaural impulse response from the ray tracing
data, Heinz assumed that the reverberation is ideally diffuse.
This assumption is, however, too rough, if the room geom-
etry is extremely long or flat and if it contains objects like
columns or privacy screens. Room acoustical defects such as
(flutter) echos would remain undetected [40, 41]. For a more
realistic room acoustical simulation, the algorithm has been
changed in a way so that these effects are taken into account
(see Figure 4(b)). This aspect is an innovation in real-time
Tobi as L en tz e t a l. 5
RAVEN
Scene graph Listener position
Image sources
IS audibility test
Collision
data
Tra ce r ay
All possible
image sources
Check image
source
If audible
Audible sources
Room-acoustic
server
(a) Image sources
RAVEN
Center frequency Material map
Absorption coefficients
Scatter coefficients
Scene graph
Ray tracer
Absorb energy
Scatter ray
Find intersection
Fire ray Trace ray
If detection sphere hit
Energy
Time
Angles of impact
Histogram
Impulse response
Sort into
impulse response
IFFT
Multiply impulses with
directivity-groups’ HRTFs
Distribute Dirac-impulses
to directivity-groups
(Poisson)
Determine directivity-
groups of time slot
Room-acoustic
server
(b) Ray tracing
Figure 4: (a) Image source audibility test, (b) estimation of scattering and reverberation.
ID
R2 R1 R0
7111
6110
5101
4100
3011
2010
1001
0000
IS subset
Primary source
R2 R1 R0
R2 R1
R2 R0
R2
R1 R0
R1
R0
Figure 5: IS/room-combination-power set P(S) for a three-room
situation. All IS are sorted into encapsulated containers depending
on the room combination they have been generated from.
virtual acoustics, which is to be considered as an important
extension of the p erceptive dimension.
The BSP-based ray tracing simulation starts by emitting a
finite number of particles from each sound source at random
angles where each particle carries a source directivity de-
pendent amount of energy. Every particle loses energy while
propagating due to air absorption and occurring reflections
on walls, either specular or diffuse, and other geometric ob-
jects inside the rooms, that is, a material dependent absorp-
tion of sound. The particle gets terminated as soon as the
particle’s energy is reduced under a predefined threshold. Be-
fore a time t
0
, which represents the image source cut-off time,
only particles are detected which have been reflected specu-
lar with a diffuse history in order to preserve a correct energy
balance. After t
0
, all possible permutations of reflection types
are processed (e.g., diffuse, specular, diffuse, diffuse, etc.).
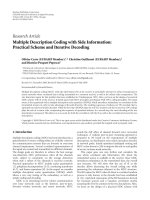
The ray tracing is performed for each frequency band
due to frequency dependent absorption and scattering coef-
ficients, which results in a three-dimensional data container
called histogr am. This histogram is considered as the tempo-
ral envelope of the energetic spatial impulse response. One
single field of the histogram contains information about rays
(their energy on arrival, time, and angles of impact) which
hit the detection sphere during a time interval Δt for a dis-
crete frequency interval f
b
. At first, the mean energy for fields
with different frequencies but the same time interval is cal-
culated to obtain the short-time energy spectral density. This
step is also used to create a ray directivity distribution over
time for the respective rays: for each time slot, the detection
sphere is divided into evenly distributed partitions, so-called
directivity groups. If a ray hits the sphere, the ray’s remain-
ing energy on impact is added to the corresponding sphere’s
directivity group depending on its time and direction of ar-
rival (see Figure 6).
This energy distribution is u sed to determine a r ay prob-
ability for each directivity group and each time interval Δt.
Then a Poisson process with a rate equal to the rate of reflec-
tions for the given room and the given time interval is cre-
ated. Each impulse of the process is allotted to the respective
directivity group depending on the determined ray probabil-
ity distribution. In a final step, each directivity group which
was hit by a Poisson impulse cluster is multiplied by its re-
spective HRTF, superposed to a binaural signal, and weighted
by the square root of the energy spectral density. After that,
the signal is transformed into time domain. This is done for
every time step of the histogram and put together to the com-
plete binaural impulse response. The ray tracing algorithm is
managed by the room acoustics server to provide the possi-
bility of a dynamic update depth for determining the diffuse
sound field component (see Section 3). Since this contribu-
tion focuses on the implementation and performance of the
complete system, no further details are presented here. A de-
tailed description of the fast implementation and test results
can be found in [42].
3. FILTER PROCESSING
For a dynamic auralization where the listener is allowed to
move, turn, and interact with the presented scenery and
6 EURASIP Journal on Advances in Sig nal Processing
1
2
3
4
5
6
7
8
9
10
Frequency bands
20
18
16
14
12
10
8
6
4
2
0
Time slots
0
0.5
1
1.5
2
2.5
Energy
Figure 6: Histogram example of a single directivity group.
where the sources can also be moved, the room impulse
response has to be updated very fast. This becomes also
more important in combination with congruent video im-
ages. Thus, the filter processing is a crucial part of the real-
time process [8]. The whole filter construction is separated
into two parts. The most important section of a binaural
room impulse response is the first part containing the direct
sound and the early reflections of the room. These early re-
flections are represented by the calculated image sources and
have to be updated at a rate which has to be sufficient for
the binaural processing. For this reason, the operation inter-
face between the room acoustics server and the auralization
server is the list of the currently audible sources. The s econd
part of the room impulse response is calculated on the room
acoustics server (or cluster) to minimize the time required
by the network transfer because the amount of data required
to calculate the room impulse response is significantly higher
than the resulting filter itself.
3.1. Image sources
Every single fraction of the complete impulse response, either
the direct sound or the sound reflected by one or more walls,
runs through several filter elements as shown in Figure 7.El-
ements such as directivity, wall, and air absorption are filters
in a logarithmic frequency representation with a third octave
band scale with 31 values from 20 Hz to 20 kHz. These filters
contain no phase information so that only a single multipli-
cation is needed. The drawback of using a logarithmic rep-
resentation is the necessity of interpolation to multiply the
resulting filter with the HRTF. But this is s till not as com-
putationally expensive as using a linear representation for all
elements, particularly if more wall filters have to be consid-
ered for the specific reflection.
So far, the wall absorption filters are independent of the
angle of sound incidence, w hich is a common assumption
for room acoustical models. It can be extended to consider
angle-dependent data if necessary. Reflections calculated by
using the image source model will be attenuated by the factor
of the energy which is distributed by the diffuse reflections.
The diffuse reflections will be handled by the ray tracing al-
gorithm, (see Section 3.2 ).
Another important influence on the sound in a room, es-
pecially a large hall, is the directivity of the source. This is
even more important for a dynamic auralization where not
only the listener is allowed to move and interact with the
scenery but w here the sources can also move or turn. The
naturalness of the whole generated sound scene is improved
by every dynamic aspect being taken into account. The pro-
gram accepts external directivity databases of any spatial res-
olution, and the internal database has a spatial resolution of 5
degrees for azimuth and elevation angles. This database con-
tains the directivity of a singer and several natural instru-
ments. Furthermore, it is possible to generate a directivity
manually. The air absorption filter is only distance dependent
and is applied also to the direct sound, which is essential for
far distances between the listener and source.
At the end of every filter pass, which represents, up to
now, a mono signal, an HRTF has to be used to generate a
binaural head-related signal which contains all directional
information. All HRTFs used by the VirKopf system were
measured with the artificial head of the ITA for the full sphere
due to the asymmet rical pinnae and head geometry. Non-
symmetrical pinnae lead to positive effects on the perceived
externalization of the generated virtual sources [43]. A strong
impulse component such as the direct sound carries the most
important spatial information of a source in a room. In or-
dertoprovideabetterresolution,evenatlowfrequencies,an
HRTF of a higher resolution is used for the direct sound. The
FIR filter length is chosen to be 512 taps. Due to the fact that
the filter processing is done in the frequency domain, the fil-
ter is represented by 257 complex frequency domain values
corresponding to a linear resolution of 86 Hz.
Furthermore, the database does not only contain HRTFs
measured at one specific distance but, also near-field HRTFs.
This provides the possibility of simulating near-to-head
sources in a natural way. Tests showed that the increasing in-
teraural level difference (ILD) becomes audible at a distance
of 1.5 m or closer to the head. This test was perfor med in
the semianechoic chamber of the ITA, examining the ranges
Tobi as L en tz e t a l. 7
Direct sound
Directivity
Air
absorption
Inter-
polation
HRTF
1/3 octave band scale 512 taps
Single reflection
Directivity
Wal l
absorption
Wal l
absorption
Air
absorption
Inter-
polation
HRTF
1/3 octave band scale
128 taps
···
Figure 7: Filter elements for direct sound and reflections.
where different near-field HRTFs have to be applied. The lis-
teners were asked to compare signals from simulated HRTFs
with those from correspondingly measured HRTFs on two
criteria, namely, the perceived location of the source and any
coloration of the signals. The simulated HRTFs were pre-
pared from far-field HRTFs (measured at a distance of two
meters) with a simple-level correction applied likewise to
both channels. All of the nine listeners reported differences
with regard to lateral sound incidences in the case of dis-
tances being closer than 1 .5 m. No difference with regard to
frontal sound incidences was reported in the case of distances
being closer than 0.6 m. These results are very similar to the
results obtained by research carried out in other labs, for ex-
ample, [44]. Hence, HRTFs were measured at distances of
0.2 m, 0.3 m, 0.4 m, 0.5 m, 0.75 m, 1.0 m, 1.5 m, and 2.0 m.
The spatial resolution of the databases is 1 degree for azimuth
and 5 degrees for elev ation angles for both the direct sound
and the reflections.
The FIR filter length of 128 taps used for the contribu-
tion of image sources is lower than for the direct sound, but
is still higher than the limits to be found in literature. Inves-
tigations regarding the effects of a reduced filter length on
localization can be found in [45]. As for the direct sound,
the filter processing is done in the frequency domain with
the corresponding filter representation of 65 complex values.
Using 128 FIR coefficients leads to the same localization re-
sults, but brings about a considerable reduction of the pro-
cessing time (see Ta ble 3). This was tested as well in internal
listening experiences but is also congru ent to the findings of
other labs, that is, [46]. The spatial representation of image
sources is realized by using HRTFs measured in 2.0 m. In this
case, this does not mean any simplification because the room
acoustical simulation using image sources is not valid any-
way at distances close (a few wavelengths) to a wall. A more
detailed investigation relating to that topic can be found in
[28, 47].
3.2. Ray tracing
As mentioned above, the calculation of the binaural impulse
response of the ray tracing process is done on the ray tracing
server in order to reduce the amount of data which has to be
transferred via the network. To keep the filters up-to-date ac-
cording to the importance of the filter segment, which is re-
lated to the time alignment, the auralization process can send
interrupt commands to the simulation server. If a source or
the listener is moving too fast to finish the calculation of the
filter within an adequate time slot, the running ray tracing
process will be stopped. This means that the update depth
of the filter depends on the movements of the listener or
the sources. In order to achieve an interruptible ray tracing
process, it is necessary to divide the whole filter length into
several parts. When a ray reaches the specified time stamp,
the data necessar y to restart the ray at this position will be
saved and the next ray is calculated. After finishing the calcu-
lation of all rays, the filter will be processed up to the time the
ray tracing updated the information in the histogram (this
can also be a parallel process, if provided by the hardware).
At this time, it is also possible to send the first updated filter
section to the auralization server, which means that it is pos-
sible to take the earlier part of the changed impulse response
into account before the complete ray tracing is finished. At
this point, the ray tracing process will decide on the inter-
rupt flag whether the calculation is restarted at the beginning
of the filter or at the last time stamp. For slight or slow move-
ments of the head or of the sources, the ray tracing process
has enough time to run through a complete calculation cycle
containing all filter time segments. This also leads to the fact
that the level of the simulation’s accuracy rises with the du-
ration the listener stands at approximately the same position
and the sources do not move.
4. REPRODUCTION SYSTEM
The primary reproduction system of the room acoustical
modeling described in this paper is a setup mounted in the
CAVE-like environment, which is a five-sided projection sys-
tem of a rectangular shape, installed at RWTH Aachen Uni-
versity. The special shape enables the use of the full resolution
of 1600 by 1200 pixels of the LCD projectors on the walls and
the floor as well as a 360 degree horizontal view. The dimen-
sions of the projection volume are 3.60
×2.70×2.70 m
3
yield-
ing a total projection screen area of 26.24 m
2
. Additionally,
the use of passive stereo via circular polarization allows light-
weight glasses. Head and interaction device tracking is real-
ized by an optical tracking system. The setup of this display
8 EURASIP Journal on Advances in Sig nal Processing
Crosstalk
H
1L
H
2L
H
1R
H
2R
Figure 8: The CAVE-like environment at RWTH Aachen Univer-
sity. Four loudspeakers are mounted on the top rack of the system.
The door, shown on the left, and a moveable wall, shown on the
right, can be closed to allow a 360-degree view with no roof projec-
tion.
system is an improved implementation of the system [48]
that w as developed with the clear aim to minimize attach-
ments and encumbrances in order to improve user accep-
tance. In that sense, much of the credibility that CAVE-like
environments earned in recent years has to be attributed to
the fact that they try to be absolutely nonintrusive VR sys-
tems. As a consequence, a loudspeaker-based acoustical re-
production system seems to be the most desired solution for
acoustical imaging in CAVE-like environments. Users should
be able to step into the virtual scenery without too much
preparation or calibration but still be immersed in a believ-
able environment. For that reason, our CAVE-like environ-
ment depicted above was extended with a binaural reproduc-
tion system using loudspeakers.
4.1. Virtual headphone
To reproduce the binaural signal at the ears with a sufficient
channel separation without using headphones, a crosstalk
cancellation (CTC) system is needed [49–51]. Doing the CTC
work in an environment where the user should be able to
walk around and turn his head requires a dynamic CTC sys-
tem which is able to adapt during the listener’s movements
[52, 53]. The dynamic solution overrides the sweet spot
limitation of a normal static crosstalk cancellation. Figure 8
shows the four transfer paths from the loudspeakers to the
ears of the listener (H
1L
= transfer function loudspeaker 1
to left ear). A correct binaural reproduction means that the
complete transfer function from the left input to the left ear
(reference point is the entrance of the ear canal) including
the transfer function H
1L
is meant to become a flat spectrum.
The s ame is intended for the right transfer path, accordingly.
The crosstalk indicated by H
1R
and H
2L
has to be canceled by
the system.
Since the user of a virtual environment is already tracked
to generate the correct stereoscopic video images, it is possi-
105210.50.2
kHz
−80
−70
−60
−50
−40
−30
−20
−10
0
dB
(a)
(b)
(c)
Figure 9: Measurement of the accessible channel separation using
a filter length of 1024 taps. (a)
= calculated, (b) = static solution, (c)
= dynamic system.
ble to calculate the CTC filter online for the current position
and orientation of the user. The calculation at runtime en-
hances the flexibility of the VirKopf system regarding the va-
lidity area and the flexibility of the loudspeaker setup which
can hardly be achieved with preprocessed filters. Thus, a
database containing “all” possible HRTFs is required. The
VirKopf system uses a database with a spatial resolution of
onedegreeforbothazimuth(ϕ) and elevation (ϑ). The
HRTFs were measured at a frequency range of 100 Hz–
20 kHz, allowing a cancellation in the same frequency range.
It should be mentioned that a cancellation at higher frequen-
cies is more error prone to misalignments of the loudspeak-
ers and also to individual differences of the pinna. This is
also shown by curve (c) in Figure 9. The distance between
the loudspeaker and the head affects the time delay and the
level of the signal. Using a database with HRTFs measured
at a certain distance, these two parameters must be adjusted
by modifying the filter group delay and the level according to
the spherical wave attenuation for the actual distance.
To provide a full head rotation of the user, a two loud-
speaker setup will not be sufficient as the dynamic can-
cellation will only work in between the angle spanned by
the loudspeakers. Thus, a dual CTC algorithm with a four-
speaker setup has been developed, which is further described
in [54]. With four loudspeakers, eight combinations of a nor-
mal two-channel CTC system are possible and a proper can-
cellation can be achieved for every orientation of the listener.
An angle dependent fading is used to change the active speak-
ers in between the overlapping validity areas of two configu-
rations.
Each time the head-tracker information is updated in the
system, the deviation of the head to the position and ori-
entation compared to the information given which caused
the preceding filter change is calculated. Every degree of free-
dom is weighted with its own factor and then summed up.
Thus, the threshold can be parameterized in six degrees of
Tobi as L en tz e t a l. 9
freedom, positional values (Δx, Δy, Δz), and rotational val-
ues (Δϕ, Δϑ, Δρ). A filter update will be performed when
the weig hted sum is above 1. The lateral movement and the
head rotation in the horizontal plane are most critical so
Δx
= Δy = 1cmandΔϕ = 1.0 degree are chosen to domi-
nate the filter update. The threshold always refers to the value
where the limit was exceeded the last time. The resulting hys-
teresis prevents a permanent switching between two filters as
it may occur when a fixed spacing determines the boundar ies
between two filters and the tracking data jitter slightly.
One of the fundamental requirements of the sound
output de vice is that the channels work absolutely syn-
chronously. Otherwise, the calculated crosstalk paths do not
fit with the given condition. On this account, the sp ecial au-
dio protocol ASIO designed by Steinberg for professional au-
dio recording was chosen to address the output device [55].
To classify the performance that could be reached theo-
retically by the dynamic system, measurements of a static sys-
tem were made to have a realistic reference for the achieved
channel separation. Under absolute ideal circumstances, the
HRTFs used to calculate the crosstalk cancellation filters are
the same as during reproduction (indiv idual HRTFs of the
listener). In a first test, the crosstalk cancellation filters were
processed with HRTFs of an artificial head in a fixed position.
The windowing to a certain filter length and the smoothing
give rise to a limitation of the channel separation. The inter-
nal filter calculation length is chosen to 2048 taps in order
to take into account the time offsets caused by the distance
to the speakers. The HRTFs were smoothed with a band-
width of 1/6 octave to reduce the small dips which may cause
problems by inverting the filters. After the calculation, the fil-
ter set is truncated to the final filter length of 1024 taps, the
same length that the dynamic system works with. However,
the time alignment among the single filters is not affected
by the truncation. The calculated channel separation using
this (truncated) filter set and the smoothed HRTFs as refer-
ence is plotted in Figure 9 curve (a). Thereafter, the achieved
channel separation was measured at the ears of the artificial
head, which had not been moved since the HRTF measure-
ment (Figure 9 curve (b)).
In comparison to the ideal reference cases, Figure 9 curve
(c) shows the achieved channel separation of the dynamic
CTC system. The main difference between the static and the
dynamic system is the set of HRTFs used for filter calcu-
lation. The dynamic system has to choose the appropriate
HRTF from a database and has to adjust the delay and the
level depending on the position data. All these adjust ments
cause minor deviations from the ideal HRTF measured di-
rectly at this point. For this reason, the channel s eparation
of the dynamic system is not as high as the one that can be
achieved by a system with direct HRTF measurement.
The theory of crosstalk cancellation is based on the as-
sumption of a reproduction in an anechoic environment.
However, the projection walls of CAVE-like environments
consist of solid material causing reflections that decrease
the performance of the CTC system. Listening tests with
our system show [56] that the subjective localization per-
formance is still remarkably good. Also tests of other labs
[57, 58] and different CTC systems indicate a better sub-
jective performance than it would be expected from mea-
surements. One aspect validating this phenomenon is the
precedence effect by which sound localization is primarily
determined by the first arriv ing wavefront; the other as-
pect is the head movement which gives the user the abil-
ity to approve the perceived direction of incidence. A more
detailed investigation on the performance of our binau-
ral rendering and reproduction system can be found in
[59].
The latency of the audio reproduction system is the time
elapsed between the update of a new position and orienta-
tion of the listener, and the point in time at which the out-
put signal is generated with the recalculated filters. The out-
put block length of the convolution (overlap save) is 256
taps as well as the chosen buffer length of the sound out-
put device, resulting in a time between two buffer switches of
5.8 milliseconds at 44.1 kHz sampling r a te for the rendering
of a single block. The calculation of a new CTC filter set (1024
taps) takes 3.5 milliseconds on our test system. In a worst case
scenario, the filter calculation just finishes after the sound
output device fetched the next block, so it takes the time play-
ing this block until the updated filter becomes active at the
output. That would cause a latency of one block. In such a
case, the overall latency accumulates to 9.3 milliseconds.
4.2. Low-latency convolution
A part of the complete dynamic auralization system requir-
ing a high amount of processing power is the convolution
of the audio signal. A pure FIR filtering would cause no ad-
ditional latency except for the delay of the first impulse of
the filter, but it also causes the highest a mount of process-
ing power. Impulse responses of more than 100 000 taps or
more cannot be processed in real time on a PC system us-
ing FIR filters in the time domain. The block convolution is a
method that reduces the computational cost to a minimum,
but the latency increases in proportion to the filter length.
The only way to minimize the latency of the convolution is
a special conditioning of the complete impulse response in
filter blocks. Basically, we use an algorithm which works in
the frequency domain with small block sizes at the begin-
ning of the filter and increasing sizes to the end of the fil-
ter. More general details about these convolution techniques
can be found in [60]. However, our algorithm does not op-
erate on the commonly used segmentation which doubles
the block length every other block. Our system provides a
special block size conditioning with regard to the specific
PC hardware properties as, for instance, cache size or spe-
cial processing structures such as SIMD (single instruction
multiple data). Hence, the optimal convolution adds a time
delay of only the first block to the latency of the system, so
that it is recommended to use a block length as small as pos-
sible. The amount of processing power is not linear to the
overall filter length and also constrained by the chosen start
block length. Due to this, measurements were done to deter-
mine the processor lo ad of different modes of operation (see
Table 1).
10 EURASIP Journal on Advances in Sig nal Processing
Table 1: CPU load of the low-latency convolution algorithm.
Impulse response length
Number of sources
3 101520 3101520
(Latency 256 taps) (Latency 512 taps)
0.5 s 9% 30% 50% 76% 8% 22% 30% 50%
1.0 s
14% 40% 66% — 11% 33% 53% 80%
2.0 s
15% 50% 74% — 14% 42% 71% —
3.0 s
18% 62% — — 16% 53% — —
5.0 s
20% 68% — — 18% 59% — —
10.0 s
24% — — — 20% 68% — —
5. SYSTEM INTEGRATION
The VirKopf system constitutes the binaural synthesis and
reproduction system, the visual-acoustic coupling, and it is
connected to the RAVEN system for room acoustical simu-
lations. The complete system’s layout with all components
is shown in Figure 10. As such it describes the distributed
system which is used for auralization in the CAVE-like en-
vironment at RWTH Aachen University, where user inter-
action is tracked by six cameras. As a visual VR machine, a
dual Pentium 4 machine with 3 GHz CPU speed and 2 GB
of RAM is used (cluster master). The host for the audio VR
subsystem is a dual Opteron machine with 2 GHz CPU speed
and 1 GB of RAM. The room acoustical simulations run on
Athlon 3000+ machines with 2 GB of RAM. This hardware
configuration is also used as a test system for all perfor-
mance measurements. As audio hardware, an RME Ham-
merfall system is used which allows sound output stream-
ing with a scalable buffer size and a minimum latency of
1.5 milliseconds. In our case, an output buffer size is chosen
to 256 taps (5.8 milliseconds). The network interconnection
between all PCs was a standard Gigabit Ethernet.
5.1. Real-time requirements
Central aspects of coupled real-time systems are latency and
the update rate for the communication. In order to get an ob-
jective criterion for the required update rates, it is mandatory
to inspect typical behavior inside CAVE-like environments
with special respect to head movement types and magnitude
of position or velocity changes.
In general, user movements in CAVE-like environments
can be classified in three categories [61]. One category is
identified by the movement behavior of the user inspecting a
fixed object by moving up and down and from one side to the
other in order to accumulate information about its structural
properties. A second category can be seen in the movements
when the user is standing at one spot and uses head or body
rotations to view different display surfaces of the CAVE. The
third category for head movements can be observed when the
user is doing both, walking and looking around in the CAVE-
like environment. Mainly, the typical applications we employ
can be classified as instances of the last two categories, al-
though the exact user movement profiles can be individually
different. Theoretical and empirical discussions about typi-
cal head movement in virtual environments are still a subject
of research, for example, see [61–63]or[64].
As a field study, we recorded tracking data of users’ head
movements while interacting in our virtual environment.
From these data, we calculated the magnitude of the veloc-
ity of head rotation and translation in order to determine the
requirements for the room acoustics simulation. Figure 11(a)
shows a histogram of the evaluated data for the translational
velocity. Following from the deviation of the data, the mean
translational velocity is at 15.4 cm/s, with a standard devi-
ation of 15.8 cm/s and the data median at 10.2 cm/s, com-
pare Figure 11(c). This indicates that the update rate of the
room acoustical simulation can be rather low for transla-
tional movement as the overall sound impression does not
change much in the immediate vicinity (see [65]forfur-
ther information). As an example, imagine a room acoustical
simulation of a concert hall where the threshold for trigger-
ing a recalculation of a raw room impulse response is 25 cm
(which is typically half a seat row’s distance). With respect to
the translational movement profile of a user, a recalculation
has to be done approximately every 750 milliseconds to catch
about 70% of the movements. If the system aims at calculat-
ing correct image sources for about 90% of the movements,
thiswillhavetobedoneevery550milliseconds.Arawim-
pulse response contains the raw data of the images, their am-
plitude and delay, but not their direction in listener’s coordi-
nates. The slowly updated dataset represents, thus, the room-
related cloud of image sources. The transformation into 3D
listener’s coordinates and the convolution will be updated
much faster, certainly, in order to allow a direct and smooth
responsiveness.
CAVE-like environments allow the user to directly move
in the scene, for example, by walking inside of the boundaries
of the display surfaces and tracking area. Additionally, indi-
rect navigation enables the user to move in the scenery vir-
tually without moving his body but by pointing metaphors
when using hand sensors or joysticks. Indirect navigation is
mandatory, for example, for architectural walkthroughs as
the virtual scenery is usually much larger than the space cov-
ered by the CAVE-like device itself. The maximum velocity
for indirect navigations has to be limited in order to avoid
artifacts or distortions in the acoustical rendering and per-
ception. However, during the indirect movement, users do
Tobi as L en tz e t a l. 11
Room acoustics server
Geometric
room model
Image sources Ray tracing
All possible
image sources
Threshold
Δs
= 0.25 m
Translation/IS
audibility test
Histogram
calculation
Start/
interrupt
Threshold
Δs
= 1m
Δα
= 10
◦
Binaural filter
generation
HRTF
database
Auralization server
Audible sources
Position/direction
update
Filter calculation
Filter combination
Audio files/
input stream
Threshold
Δs
= 0.05 m
Δα
= 2
◦
HRTF
database
Segmented conv olution
Filter
Audio stream
Crosstalk cancellation
Filter calculation
Block convolution
Filter
Audio stream
Threshold
Δs
= 0.01 m
Δα
= 1
◦
HRTF database
ASIO output
Buf A Buf B
Buffer switch
VR application
Position data
(listener, sources)
Room model
(high detailed)
Interaction
manager
Graphic
manager
∗∗
··· ··· ··· ···
Figure 10: The complete binaural auralization system.
806040200
Velocity (cm/s)
0
200
400
600
800
1000
1200
Quantity
(a)
100806040200
Velocity (degrees/s)
0
500
1000
1500
2000
2500
Quantity
(b)
v
t
(cm/s) v
r
(deg/s)
x 15.486 8.686
σ 15.843 11.174
x 10.236 5.239
x
max
84.271 141.458
(c)
Figure 11:Histogramoftranslational(v
t
) and rotational (v
r
) velocities of movements of a user acting in a CAVE-like environment. The
blue line depicts the cumulative percentage of the measurements. In (b), we limited the upper bound to 100 degrees/s for better readability,
(c) shows the descriptive statistics about the measurements.
12 EURASIP Journal on Advances in Sig nal Processing
Figure 12: Sliced polygon model of the concert hall of Aachen’s Eu-
rogress convention center.
not tend to move their head and the overall sensation re-
duces the capability to evaluate the correctness of the sim-
ulation. Once the users stop, it takes about 750 milliseconds
as depicted above to calculate the righ t filters for the current
user position. We made the experience that a limitation of the
maximum velocity for indirect navig ation to 100 cm/s shows
good results and user acceptance.
In addition to the translational behavior, Figure 11(b)
shows the rotational profile for head movements of a user.
Peak angular velocities can be up to 140 degrees per sec-
ond although these are very seldom. The mean for rotational
movement is at 8.6 degrees/s with a standard deviation of
11.1 degrees/s and a data median at 5.2 degrees/s, compare
Figure 11(c).Datasetsprovidedasstandardmaterialforre-
search on system latency, for example, by [66]or[61], show
comparable results.
The orientation of the user’s head in the sound field is
very critical as reflections have to be calculated for the head-
related impulse response in listener’s coordinates. The chang-
ing ITD of the HRTFs during head rotation may cause a sig-
nificant phase mismatch of two filters. In cross-fading from
one room impulse response to the next, these differenc es
should not be too big as this might result in audible comb-
filter effects. To reduce these differences, a filter change ev-
ery 1-2 degrees is necessary here. In order to be precise for
almost all possible rotational velocities, we consider a tim-
ing interval for a recalculation every 10–20 milliseconds as
mandatory. As a consequence, the block size configured in
the audio processing hardware should not be bigger than 512
samples as this limits the minimal possible update time to
11.6 milliseconds at a 44.1 kHz sampling rate.
5.2. Performance of the room acoustical simulation
To evaluate the implementation and to determine its real-
time capabilities, several experiments were carried out on the
test system. For a realistic evaluation, a model of the concert
hall of Aachen’s Eurogress (volume about 15 000 m
3
)con-
vention center was constructed, which is shown in Figure 12.
All results presented in this contribution are based on this
model.
The model is constructed of 105 polygons and 74 planes,
respectively. Although it is kept quite simple, the model con-
200180160140120100806040200
Number of polygons
0
50
100
150
200
250
300
Computation time (millisecond)
BSP
Brute
Figure 13: Comparison of required computation time for the ISs
audibility test up to second-order ISs for different Eurogress mod-
els which differ in their level of detail (see [38] for details). With
the growing number of polygons for the model’s different lev-
els of detail, the number of ISs grows exponentially, which leads
to an exponential growth of the computation time for the brute-
force approach. The computation time demands of the BSP-based
method grows only linear due to the drop of search complexity up
to O(log N), N number of polygons.
tains all indoor elements of the room which are acoustically
of interest [67], for example, the stage, the skew wall ele-
ments, and the balustrade. Details of small elements are ne-
glected and represented by equivalent scattering [68]. Surface
properties, that is, absorption and scattering coefficients are
defined through standardized material data [69, 70].
5.2.1. Image source method performance
The computation time for the translational movement of
primary sound sources and their respective image sources
depends solely on the number of image sources. An aver-
age computation time of about 1 millisecond per 1000 im-
age sources was measured. The main part of the computation
time is needed for the audibility test.
To give a better idea of the achieved speed up by the use
of BSP trees, a brute-force IS audibility test has been im-
plemented for comparison purpose. This algorithm tests ev-
ery scene’s polygon on intersection instead of testing only
a few room’s subpartitions by means of a BSP-tree struc-
ture. Figure 13 shows a comparison of measured computa-
tion times for the IS-audibility test up to second IS order
of both approaches. As expected, the computation time of
the brute-force method rises exponentially with the expo-
nentially growing number of ISs, whereas the BSP-based ap-
proach has only a quite linearly growing computation time
demand due to the drop of search complexity up to O(log N),
N number of polygons.
Tobi as L en tz e t a l. 13
Table 2: Comparison of the measurement results of the IS audibil-
ity test.
IS order
Number of IS IS audibility test
All Audible BSP [ms] Brute [ms]
1 75 9 0.153 0.959
2
4,827 32 10.46 61.27
3
309 445 111 710.07 3924
Table 3: Calculation time of several parts of the filter.
Processing step Time
Direct sound (512 taps) 300 μs
Single reflection (aver.)
50 μs
Preparation for segmented
convolution (6000 samples)
1.1 ms
With the assig ned time slot (see Section 5.1) of 750 mil-
liseconds for the simulation process, real-time capability for
a room acoustical simulation with all degrees of freedom
such as movable sound sources, movable receiver, chang-
ing sources’ directivities, and interaction with the scenery is
reached for about 320 000 ISs to be tested during runtime.
Applying these constraints to the measurement results of the
IS audibility test (see Tab le 2 ) makes the simulation of the
Eurogress model real-time capable up to order 3.
Besides the performance of the room acoustical simula-
tion, the processing time of the filter is very important. All
time measurements of the calculation routines presented in
this section are performed on our test system.
Calculating the image sources of the Eurogress model up
to the third order, 111 audible image sources can be found in
the first part of the impulse response of 6000 samples length
corresponding to 136 milliseconds. In this case, one source is
placed on the stage, and the listener is located in the middle
of the room. The complete filter processing (excluding the
audibility test) is done in 6.95 milliseconds. Note, that the
filter processing has different entry points. The rotation of
the listener or a source does not cause a recalculation of the
audible sources, only the filter has to be processed.
5.2.2. Ray-tracing performance
For measuring the performance of the ray-tracing algorithm,
all materials of the Eurogress model were replaced by a single
one in order to avoid influences of different scattering and
absorption coefficients on the results.
As in the previous section, a brute-force ray tracing al-
gorithm has been implemented to compare the results to
the BSP-based method we use in our framework. While the
brute-force approach has a linearly growing computation
time, that is, a complexity of O(N), N number of poly-
gons, the BSP-based algorithm grows only logarithmically
with increasing time due to the drop of search complexity
to O(log N) (see Figure 14, t<0.8second).Araygetstermi-
nated if a minimum energy threshold is reached. Thus, both
approaches get faster with increasing time due to the grow-
2.521.510.50
Filter length (s)
0
1
2
3
4
5
6
Computation time (s)
BSP
Brute
Figure 14: Comparison of required computation times for the
determination of impulse responses with increasing length using
80 000 rays for the simulation.
ing number of reflections, that is, the growing rays’ loss of
energy and ray termination, respectively. As an example, the
algorithm needs an average of about 2.6 second per 80 000
rays (10 000 rays per frequency band, the first two octave
bands are skipped) for determination of an impulse response
with the length of 1 secone. As the processing time of the ray-
tracing algorithm increases linearly with the number of rays
used, a comparison of these results is redundant. It is obvious
that the algorithm is able to cope with the real-time require-
ments, especially when using small numbers of r ays at first
to get a low-resolution histogram. If the listener stays at one
place for a longer period of time, the ray tracer can update
the histogram with more rays to get a higher resolution and
determine a longer impulse response, respectively.
5.3. Network
With respect to the timing, the optical tracking system is ca-
pable of delivering spatial updates of the position and orien-
tation of the user’s head and an additional interaction device
to the VR application in 18.91 milliseconds. This figure is a
direct result from the sum of the time needed for the visual
recognition of two tracking targets as well as the transmis-
sion time for the measured data over a network link. For ap-
plications that must have a minimum latency time and do
not need wireless tracking, the usage of an electromagnetic
tracking system can reduce the latency to
≈ 5 milliseconds.
However, the VirKopf system distinguishes between two
types of update messages. One type deals with low-frequency
state changes such as commands to play or stop a specific
sound. The second type updates the spatial attributes of the
sound source and the listener at a high frequency. For the first
type, a reliable transport protocol is used (TCP), while the
14 EURASIP Journal on Advances in Sig nal Processing
latter is transmitted at a high frequency over a low overhead
but possibly unreliable protocol (UDP).
In order to get an estimate of the costs of network tr ans-
port, the largest possible TCP and UDP messages produced
by the VirKopf system were transmitted from the VR ap-
plication to the VirKopf server many times and then sent
back. The transmission time for this round trip was taken
and halved for a single-trip measurement. The worst case
times of the single trips are taken as a basis for the estimation
of the overall cost introduced by the network communica-
tion. The mean time for transmitting a TCP command was
0.15 millisecond
±0.02 millisecond. The worst case transmis-
sion time on the TCP channel was close to 1.2 millisecond.
UDP communication was measured for 20 000 spatial update
tables for 25 sound sources, resulting in a transmission time
for the table of 0.26 millisecond
± 0.01 millisecond. It seems
surprising that UDP communication is more expensive than
TCP, but this is a result from larger packet sizes of an spatial
update (
≈ 1 kB) in comparison to small TCP command sizes
(
≈ 150 bytes).
5.4. Overall performance
Several aspects have to be taken into account to give an
overview of the performance of the complete system, the per-
formance of several subsystems, the organization of parallel
processing, the network transport, but also of the scenery,
namely, the simulated room (dimension and complexity of
the geometry), the velocity of sources, and finally the user.
Updating the room acoustical simulation is the most time-
consuming part of the system and requires a strategy of
achieving the best perceptual performance. Image sources
and ray tracing are processed independently on different
CPUs. The binaural filter of the ray tracing process will be
calculated directly on the ray-tracing server. The auralization
server has to calculate the image source filter and combine all
filter segments of the ray-tracing process. Figure 15 describes
one possible segmentation of the ray tracing and combina-
tion of the image source filter. It should be mentioned that
the length of the specular part is room dependent. The ray-
tracing interrupt point will be adjusted based on the move-
ment velocity of the listener and the sources. This means that
the audio signal is filtered with the updated first part of the
room impulse response while the generation of the late part
by ray tracing is still in progress. The filter segment to be up-
dated will be cut off from the complete filter with a short
ramp of 32 samples
≈ 0.72 millisecond, and the new seg-
ment will be placed in with the same ramp to avoid audible
artifacts.
Due to the dependency of all these factors, update times
cannot be estimated in general. For this reason, we will give
some detailed examples with respect to the performance
measurements (see Tables 4 and 5) made in several sections
above. It should be noticed that the image source filter will
be updated at any time the source or the head moved more
than 2 cm or turned more than 1 degree, respectively. The
image source filter will be calculated on the current list of
audible sources (positions updated). The resulting filter only
Table 4: Overview of performance measurements of the several
subsystems.
Action Time
Tracking 18.90 ms
UDP transport
0.26 ms
CTC filter generation
3.50 ms
Audio buffer swap
5.80 ms
IS audibility test
710.00 ms
IS filter (2
× 6.95 ms) 13.90 ms
Ray tracing
500 ms impulse response length 1600.00 ms
1 s impulse response length
2600.00 ms
2 s impulse response length
3000.00 ms
contains a few wrong reflections which will be removed after
the audibility test. Thus, the specular reflections at the first
part of the impulse response become audible with the correct
spatial representation already after 35 milliseconds (tracking
+ UDP transport + CTC filter generation IS filter generation
+ audio buffer swap). This is also the time needed to react to
a listener’s head rotation (see Ta ble 5).
6. SUMMARY
In this contribution, we introduced a quite complex system
for simulation and auralization of room acoustics in real
time. The system is capable of simulating room acoustical
sound fields in any kind of enclosures without the prereq-
uisite of any diffuse-field conditions. The room shape can
hence be extremely long, flat, coupled, or of any other spe-
cial property. The surface properties, too, can be freely cho-
sen by using the amount of wave scattering according to
standardized material data. Furthermore, the system includes
a sound field reproduction for a single user based on dy-
namic crosstalk cancellation (virtual headphone). The soft-
ware is implemented on standard PC hardware and requires
no special processors. The performance (simulation process-
ing time, filter update rates, tracker, and sound hardware la-
tency) was evaluated and considered sufficiently in the case
of a concert hall of medium size.
Particular features of the system are the following.
(i)Itisnotbasedonanyassumptionofanidealdiffuse
sound field but on a full room acoustic simulation in
two parts. Specular and scattered components of the
impulse response are treated separately. Any kind of
room shape and volume can be processed except small
rooms at low frequencies.
(ii) The decision with regard to the amount of specu-
lar and diffuse reflections is just room dependent and
purely based on physical sound field aspects.
(iii) The user will just be involved to create the room
CAD model and the standard material data of ab-
sorption and scattering. Therefore, import functions
of commercial non-real-time simulation software can
be used. The fact that the auralization is performed in
Tobi as L en tz e t a l. 15
First part (specular reflections) of the impulse response generated by the IS method
First part (diffusereflections)oftheimpulseresponsegeneratedbytheraytracingmethod
Late parts (specular and diffuse reflections) of the impulse response
generated by the ray-tracing method
100-200 ms
200-500 ms
···
Figure 15: Combination of filter (or filter segments) for one ear generated by ray tracing and the first part of the impulse response generated
by the image source model.
Table 5: Update intervals for different modes and conditions of head or source movements based on the measurements shown in Tab le 4.
Action Update rate Filter content to be updated
Head rotation 35 ms
Binaural processing in listeners
coordinates
Translational
head/source movement > 0.25 m
710 ms
Binaural processing in listeners
coordinates
Specular impulse response
(3D image source cloud)
Translational
head/source movement > 1.0m
(complete impulse response update)
3.0 s
Binaural processing in listeners
coordinates
Specular impulse response
(3D image source cloud).
Scattering impulse response
(3D scattering matrix)
Fast translational
head/source movement > 1.0m
(update of the first 500 ms)
1.6 s
Binaural processing in listeners
coordinates
Specular impulse response
(3D image source cloud).
Scattering impulse response
(3D scattering matrix).
real time means that the user is not required to carry
out any additional tasks. The system will adjust all rele-
vant runtime parameters automatically and inherently,
like division into specular and scattered parts and filter
update rates.
(iv) The treatment of the components of the binaural im-
pulse response is separated regarding the simulation it-
self, the update rate to the auralization server, and the
convolution process.
(v) The decision regarding the update rate and depth of
impulse response simulation is based on the interac-
tion and speed of movement of the user in the VR sys-
tem.
(vi) The precision of details in the impulse response, its
exactness of delays, and its exactness of direction of
sound incidence are just depending on the relative ar-
rival time in the impulse response. This is in agree-
ment with the ability of the human hearing system
regarding localization and echo delays. Is should also
be mentioned here that the system parameters of
simulation depth and update rate are not controlled
by the user but inherently treated in the system. This
16 EURASIP Journal on Advances in Sig nal Processing
way of processing w ill create full complexity and exact
auralization in the very early part of the direct sound
and the first reflections. Gradually, the sound energy
will be transferred into the scattered component of the
impulse. The precision and update rates are reduced,
motivated by the limits due to psychoacoustic in mask-
ing effects. The system is open for further extension
with respect to sound diffraction and sound insula-
tion.
The real-time performance of the room acoustical simu-
lation software was achieved by the introduction of a flexi-
ble framework for the interactive auralization of virtual en-
vironments. The concept of scene graphs for the efficient
and flexible linkage of autonomously operating subscenes by
means of so-called portals has been incorporated into the ex-
isting framework and combined with an underlying BSP-tree
structure for processing geometry issues very fast. The use of
this framework provides the possibility of a significant reduc-
tion of computation time for both applied algorithms (de-
terministic image sources and a stochastic ray tracer). Espe-
cially, the image source method is improved by the introduc-
tion of spatial data structures as portal states can be exploited
so that the number of image sources to be processed can be
reduced remarkably.
A fast low latency engine ensures that impulse responses
regardless of their complete length will be considered by the
filtering of the mono audio material after 5.8 milliseconds
(block length 256 samples). Optimizations concerning mod-
ern processor extensions enable the rendering of, for exam-
ple, 10 sources with fi lters of 3-second (132 000 taps) length
or 15 sources with filters of 2-second length.
The reproduction of the binaural audio signal is provided
by a dynamic crosstalk cancellation system with no restric-
tions to user movements. This system acts as a virtual head-
phone providing the channel separation without the need to
wear physical headphones.
Gigabit Ethernet is used to connect the visual render-
ing system and the audio system. The visual VR system
transmits the control commands as well as the spatial up-
dates of the head and the sources. The control commands
(e.g., start/stop) will be considered in the audio server after
0.15 millisecond so that the changes are served with the next
sound output block for a tight audio video synchronism.
7. OUTLOOK
Despite the good performance of the whole system, there are
many aspects that have to be investigated. To further enhance
the quality of the room acoustical simulation, physical effects
like sound insulation and diffraction are to be incorporated
into the existing algorithms. In addition, the simulation of
frequencies below the Schroeder frequency could be done by
means of a fast and dynamic finite element method ( FEM)-
solver. The existing framework is already open to take these
phenomena into account, the respective algorithms have only
to be implemented. At present, the simulation software is im-
plemented in a first version as a self-contained stable base.
Thus, optimizing the algorithms is necessary to further in-
crease their performance, especially with focus on the com-
puting of processes in parallel. Position prediction could be a
possibility of reducing the deviation of the position, the filter
was calculated for, and the actual listener’s position.
Preliminary listening tests showed that the generated vir-
tual sources could be localized at a low er ror-rate [59]. The
room acoustical simulation was perceived as plausible and
matching to the generated visual image. In the future, more
tests will be accomplished to evaluate the limitation of the
update rates and the number of sources. Perception based
reduction such as stated in, for example, [71, 72] is also an
interesting method of reducing the processing costs, and will
be considered in the future.
ACKNOWLEDGMENTS
The authors would like to thank Frank Wefers, Hilmar De-
muth, and Philipp Dross for their commitment during parts
of the programming work, and also Torsten Kuhlen, Andreas
Franck, and Mark-Oliver G
¨
uld for their support and discus-
sion. Furthermore, thanks to the DFG for funding parts of
the project (DFG-Project “The Virtual Headphone,” 2004–
2006). Finally, the authors would like to thank the anony-
mous reviewers for the extended work which helped a lot to
improve this contribution.
REFERENCES
[1] D. R. Begault, “Challenges to the successful implementation of
3-D sound,” Journal of the Audio Engineering Society, vol. 39,
no. 11, pp. 864–870, 1991.
[2] M. Naef, O. Staadt, and M. Gross, “Spatialized audio render-
ing for immersive virtual environments,” in Proceedings of the
ACM Symposium on Virtual Reality Software and Technology
(VRST ’02), pp. 65–72, Hong Kong, November 2002.
[3] C. Cruz-Neira, D. J. Sandin, T. A. DeFanti, R. V. Kenyon, and
J. C. Hart, “The CAVE: audio visual experience automatic vir-
tual environment,” Communications of the ACM, vol. 35, no. 6,
pp. 65–72, 1992.
[4] D.A.BurgessandJ.C.Verlinden,“Anarchitectureforspatial
audio servers,” in Proceedings of Virtual Reality Systems Con-
ference (Fall ’93), New York, NY, USA, November 1993.
[5] J. D. Mulder and E. H. Dooijes, “Spatial audio in graphical ap-
plications,” in Visualization in Scientific Computing,M.G
¨
obel,
H. M
¨
uller, and B. Urban, Eds., pp. 215–229, Springer, Wien,
Austria, 1994.
[6] Lake Huron, 2005, />[7] L. Savioja, Modeling Techniques for Virtual Acoustics,Ph.D.
thesis, Helsinki University of Technology, Helsinki, Finland,
December 1999.
[8] L. Savioja, J. Huopaniemi, T. Lokki, and R. V
¨
a
¨
an
¨
anen, “Cre-
ating interactive virtual acoustic environments,” Journal of the
Audio Engineering Society, vol. 47, no. 9, pp. 675–705, 1999.
[9] T. Funkhouser, P. Min, and I. Carlbom, “Real-time acoustic
modeling for distr ibuted virtual environments,” in Proceedings
of the 26th Annual Conference on Computer Graphics and Inter-
active Techniques (SIGGRAPH ’99), pp. 365–374, Los Angeles,
Calif, USA, August 1999.
[10] R. L. Storms, “Npsnet-3D Sound Server: An Effective Use of
the Auditory Channel,” 1995.
Tobi as L en tz e t a l. 17
[11] H. Kuttruff, Room Acoustics, Elsevier Science Publisher, New
York, NY, USA, 4th edition, 2000.
[12] J. B. Allen and D. A. Berkley, “Image method for efficiently
simulating small-room acoustics,” TheJournaloftheAcoustical
Society of America, vol. 65, no. 4, pp. 943–950, 1979.
[13] J. Borish, “Extension of the image model to arbitrary polyhe-
dra,” The Journal of the Acoustical Society of America, vol. 75,
no. 6, pp. 1827–1836, 1984.
[14] B I. L. Dalenb
¨
ack, “Room acoustic prediction based on a uni-
fied treatment of diffuse and specular reflection,” The Journal
of the Acoustical Society of America, vol. 100, no. 2, pp. 899–
909, 1996.
[15] P A. Forsberg, “Fully discrete ray tracing,” Applied Acoustics,
vol. 18, no. 6, pp. 393–397, 1985.
[16] T. Funkhouser, N. Tsingos, I. Carlbom, et al., “A beam tracing
method for interactive architectural acoustics,” The Journal of
the Acoustical Society of America, vol. 115, no. 2, pp. 739–756,
2004.
[17] G. M. Naylor, “ODEON—another hybrid room acoustical
model,” Applied Acoustics, vol. 38, no. 2–4, pp. 131–143, 1993.
[18] U. M. Stephenson, “Quantized pyramidal beam tracing—a
new algorithm for room acoustics and noise immission prog-
nosis,” Acta Acustica United with Acustica, vol. 82, no. 3, pp.
517–525, 1996.
[19] D. van Maercke, “Simulation of sound fields in time and fre-
quency domain using a geometrical model,” in Proceedings of
the 12th International Congress on Acoustics ( ICA ’86), vol. 2,
Toronto, Ontario, Canada, July 1986, paper E11-7.
[20] M. Vorl
¨
ander, “Simulation of the transient and steady state
sound propagation in rooms using a new combined sound
particle—image source algorithm,” TheJournaloftheAcous-
tical Society of America, vol. 86, pp. 172–178, 1989.
[21] I. Bork, “A comparison of room simulation software—the 2nd
round Robin on room acoustical computer simulation,” Acta
Acustica United with Acustica, vol. 86, no. 6, pp. 943–956, 2000.
[22] M. Vorl
¨
ander, “International round Robin on room acoustical
computer simulations,” in Proceedings of the 15th International
Congress on Acoustics (ICA ’95), pp. 689–692, Trondheim, Nor-
way, June 1995.
[23] H. Kuttruff, “A simple iteration scheme for the computation of
decay constants in enclosures with diffusely reflecting bound-
aries,” The Journal of the Acoustical Society of America, vol. 98,
no. 1, pp. 288–293, 1995.
[24] C. L. Christensen and J. H. Rindel, “A new scattering method
that combines roughness and diffraction effects,” in Forum
Acousticum, Budapest, Hungary, 2005.
[25] R. Heinz, “Binaural room simulation based on an image
source model with addition of statistical methods to include
the diffuse sound scattering of walls and to predict the rever-
berant tail,” Applied Acoustics
, vol. 38, no. 2–4, pp. 145–159,
1993.
[26] Y. W. Lam, “A comparison of three reflection modelling meth-
ods used in room acoustics computer models,” The Journal
of the Acoustical Society of America, vol. 100, no. 4, pp. 2181–
2192, 1996.
[27] M. Vorl
¨
ander, “Ein Strahlverfolgungsverfahren zur Berech-
nung von Schallfeldern in R
¨
aumen,” Acustica, vol. 65, no. 3,
pp. 138–148, 1988.
[28] J. S. Suh and P. A. Nelson, “Measurement of transient response
of rooms and comparison with geometrical acoustic models,”
The Journal of the Acoustical Society of America, vol. 105, no. 4,
pp. 2304–2317, 1999.
[29] U. P. Svensson, R. I. Fred, and J. Vanderkooy, “An analytic sec-
ondary source model of edge diffraction impulse responses,”
The Journal of the Acoustical Society of America, vol. 106, no. 5,
pp. 2331–2344, 1999.
[30] N. Tsingos, T. Funkhouser, A. Ngan, and I. Carlbom, “Model-
ing acoustics in virtual environments using the uniform the-
ory of diffraction,” in Proceedings of the 28th Annual Confer-
ence on Computer Graphics and Interactive Techniques (SIG-
GRAPH ’01), pp. 545–552, Los Angeles, Calif, USA, August
2001.
[31] U. M. Stephenson, Beugungssimulation ohne Rechenzeitexplo-
sion: die Methode der quantisierten Pyramidenstrahlen; ein
neues Berechnungsverfahren f
¨
ur Raumakustik und L
¨
armimmis-
sionsprognose; Vergleiche, Ans
¨
atze, L
¨
osungen, Ph.D. thesis,
RWTH Aachen University, Aachen, Germany, 2004.
[32] M. Slater, A. Steed, and Y. Chrysanthou, Computer Graphics
and Virtual Environments: From Realism to Real-Time, Addi-
son Wesley, New York, NY, USA, 2001.
[33] L. Cremer and H. A. M
¨
uller, Die wissenschaftlichen Grundla-
gen der Raumakust i k—Band 1, S. Hirzel, Stuttgart, Germany,
2nd edition, 1978.
[34] T. Akenine-M
¨
oller and E. Haines, Real-Time Rendering,A.K.
Peters, Natick, Mass, USA, 2nd edition, 2002.
[35] J.D.Foley,A.vanDam,S.K.Feiner,andJ.F.Hughes,Com-
puter Graphics, Principles and Practice, Addison Wesley, Read-
ing, Mass, USA, 2nd edition, 1996.
[36] R. Shumacker, R. Brand, M. Gilliland, and W. Sharp, “Study
for applying computer-generated images to visual simula-
tions,” Report AFHRL-TR-69-14, U.S. Air Force Human Re-
sources Laboratory, San Antonio, Tex, USA, 1969.
[37] T.H.Cormen,C.E.Leiserson,R.L.Rivest,andC.Stein,In-
troduction to Algorithms, MIT Press, Cambridge, Mass, USA,
2nd edition, 2001.
[38] D. Schr
¨
oder and T. Lentz, “Real-time processing of image
sources using binar y space partitioning,” JournaloftheAudio
Engineering Society, vol. 54, no. 7-8, pp. 604–619, 2006.
[39] R. Heinz, Entwicklung und Beurteilung von computergest
¨
utzten
Methoden zur binauralen Raumsimulation, Ph.D. thesis,
RWTH Aachen University, Aachen, Germany, 1994.
[40] J. S. Bradley and G. A. Soulodre, “The influence of late arriv-
ing energy on spatial impression,” The Journal of the Acoustical
Society of America, vol. 97, no. 4, pp. 2263–2271, 1995.
[41] J. H. Rindel, “Evaluation of room acoustic qualities and de-
fects by use of auralization,” in Proceedings of the 148th Meet-
ing of the Acoustical Society of America,SanDiego,Calif,USA,
November 2004.
[42] D. Schr
¨
oder,P.Dross,andM.Vorl
¨
ander, “A fast reverbera-
tion estimator for virtual environments,” in Proceedings of the
AES 30th International Conference, Saariselk
¨
a, Finland, March
2007.
[43] T. Brookes and C. Treble, “The effect of non-symmetrical
left/right recording pinnae on the perceived externalisation of
binaural recordings,” in Proceedings of the 118th Audio Engi-
neering Society Convention, Barcelona, Spain, May 2005.
[44] D. S. Brungart, W. M. Rabinowitz, and N. I. Durlach, “Audi-
tory localization of a nearby point source,” The Journal of the
Acoustical Society of America, vol. 100, no. 4, p. 2593, 1996.
18 EURASIP Journal on Advances in Sig nal Processing
[45] A. Kulkarni and H. S. Colburn, “Role of spectral detail in
sound-source localization,” Nature, vol. 396, no. 6713, pp.
747–749, 1998.
[46] H. Lehnert and M. Richter, “Auditory virtual environment:
simplified treatment of reflections,” in Proceedings of the 15th
International Congress on Acoustics (ICA ’95), Trondheim,
Norway, June 1995.
[47] G. Romanenko and M. Vorl
¨
ander, “Employment of spherical
wave reflection coefficient in room acoustics,” in IoA Sympo-
sium Surface Acoustics, Salford, UK, 2003.
[48] C. Cruz-Neira, D. J. Sandin, and T. A. DeFanti, “Surround-
screen projection-based virtual reality: the design and imple-
mentation of the CAVE,” in Proceedings of the 20th Annual
Conference on Computer Graphics and Interactive Techniques
(SIGGRAPH ’93), pp. 135–142, ACM Press, Anaheim, Calif,
USA, August 1993.
[49] B. B. Bauer, “Stereophonic earphones and binaural loudspeak-
ers,” Journal of the Audio Engineering Society,vol.9,no.2,pp.
148–151, 1961.
[50] O. Kirkeby, P. A. Nelson, and H. Hamada, “Local sound
field reproduction using two closely spaced loudspeakers,” The
Journal of the Acoustical Society of America, vol. 104, no. 4, pp.
1973–1981, 1998.
[51] H. Møller, “Reproduction of artificial-head recordings
through loudspeakers,” Journal of the Audio Engineering Soci-
ety, vol. 37, no. 1-2, pp. 30–33, 1989.
[52] W. G. Gardner, 3-D audio using loudspeakers,Ph.D.the-
sis, Massachusetts Institute of Technology, Cambridge, Mass,
USA, 1997.
[53] T. Lentz and O. Schmitz, “Realisation of an adaptive cross-talk
cancellation system for a moving listener,” in Proceedings of the
21st Audio Engineering Society Conference, St. Petersburg, Rus-
sia, June 2002.
[54] T. Lentz and G. K. Behler, “Dynamic cross-talk cancellation
for binaural synthesis in virtual reality environments,” in Pro-
ceedings of the 117th Audio Engineering Society Convention,San
Francisco, Calif, USA, October 2004.
[55] Steinberg, “ASIO 2.0 Audio Streaming Input Output Develop-
ment Kit,” 2004.
[56] T. Lentz, “Dynamic crosstalk cancellation for binaural synthe-
sis in virtual reality environments,” Journal of the Audio Engi-
neering Society, vol. 54, no. 4, pp. 283–294, 2006.
[57] T. Takeuchi, P. Nelson, O. Kirkeby, and H. Hamada, “The
effects of reflections on the performance of virtual acoustic
imaging systems,” in Proceedings of the International Sympo-
sium on Active Control of Sound and Vibration (ACTIVE ’97),
pp. 955–966, Budapest, Hungary, August 1997.
[58] D. B. Ward, “On the performance of acoustic crosstalk cancel-
lation in a reverberant environment,” The Journal of the Acous-
tical Society of America, vol. 110, no. 2, pp. 1195–1198, 2001.
[59] T. Lentz, J. Sokoll, and I. Assenmacher, “Performance of spatial
audio using dynamic cross-talk cancellation,” in Proceedings of
the 119th Audio Engineering Society Convention,NewYork,NY,
USA, October 2005.
[60] W. G. Gardner, “Efficient convolution without input-output
delay,” Journal of the Audio Engineering Society, vol. 43, no. 3,
pp. 127–136, 1995.
[61] J. J. La Viola Jr., “A testbed for studying and choosing predic-
tive tracking algorithms in virtual environments,” in Proceed-
ings of the 7th International Immersive Projection Technologies
Workshop, 9th Eurographics Workshop on Virtual Environ-
ments, pp. 189–198, Zurich, Switzerland, May 2003.
[62] R. Azuma and G. Bishop, “A frequency-domain analysis of
head-motion prediction,” in Proceedings of the 22nd Annual
Conference on Computer Graphics and Interactive Techniques
(SIGGRAPH ’95), pp. 401–408, ACM Press, Los Angeles, Calif,
USA, August 1995.
[63] L.Chai,W.A.Hoff, and T. Vincent, “Three-dimensional mo-
tion and structure estimation using inertial sensors and com-
puter vision for augmented reality,” Presence: Teleoperators and
Virtual Environments, vol. 11, no. 5, pp. 474–492, 2002.
[64] J R. Wu and M. Ouhyoung, “A 3D tracking experiment on la-
tency and its compensation methods in virtual environments,”
in Proceedings of the 8th Annual ACM Symposium on User In-
terface and Software Technology (UIST ’95), pp. 41–49, ACM
Press, Pittsburgh, Pa, USA, November 1995.
[65] I. B. Witew, “Spatial var i ation of lateral measures in different
concert halls,” in Proceedings of the 18th International Congress
on Acoustics (ICA ’04), vol. 4, p. 2949, Kyoto, Japan, April 2004.
[66] R. Azuma and G. Bishop, “Improving static and dynamic reg-
istration in an optical see-through HMD,” in Proceedings of the
21st Annual Conference on Computer Graphics and Interactive
Techniques (SIGGRAPH ’94), pp. 197–204, ACM Press, New
York, NY, USA, July 1994.
[67] W. Pompetzki, Psychoakustische Verifikation von Computer-
modellen zur binauralen Raumsimulation, Ph.D. thesis, Ruhr-
Universit
¨
at Bochum, Bochum, Germany, 1993.
[68] M. Vorl
¨
ander and E. Mommertz, “Definition and measure-
ment of random-incidence scattering coefficients,” Applied
Acoustics, vol. 60, no. 2, pp. 187–199, 2000.
[69] ISO 354, “Acoustics, Measurement of sound absorption in a
reverberant room,” 2003.
[70] ISO/DIS 17497-1, “Acoustics Measurement of the sound scat-
tering properties of surfaces—part 1: measurement of the ran-
domincidence scattering coefficient in a reverberation room”.
[71] N. Tsingos, “Scalable perceptual mixing and filtering of audio
signals using an augmented spectral representation,” in Pro-
ceedings of the 8th International Conference on Digital Audio
Effects (DAFx ’05), Madrid, Spain, September 2005.
[72] N. Tsingos, E. Gallo, and G. Drettakis, “Perceptual audio ren-
dering of complex virtual environments,” in Proceedings of the
31st Annual Conference on Computer Graphics and Interactive
Techniques (SIGGRAPH ’04), pp. 249–258, Los Angeles, Calif,
USA, August 2004.
Tobias Lentz wasborninM
¨
onchenglad-
bach, Germany, in 1971. He studied elec-
trical engineering at RWTH Aachen, Ger-
many, from where he received a Dipl Ing.
(M.Sc.) degree in 2001. Since 2001 he has
been working as a Research Assistant and
is currently a Ph.D. candidate at the Insti-
tute of Technical Acoustics, RWTH Aachen
University. His main focus is on three-
dimensional audio technologies, architec-
tural acoustics, crosstalk cancellation, binaural technology, and
real-time applications for virtual reality. Currently, he is finishing
his Ph.D. thesis on “Binaural Technology for Virtual Reality.” He is
a Member of the Audio Engineering Society (AES) and the German
Acoustical Association (DEGA).
Tobi as L en tz e t a l. 19
Dirk Schr
¨
oder was born in Cologne, Ger-
many, in 1974. He studied electrical en-
gineering and information technology at
RWTH Aachen University, Germany, and
received a deg ree of Dipl Ing. (M.Sc.) in
2004. He has been working at the Institute
of Technical Acoustics, RWTH Aachen Uni-
versity, as a Research Assistant since 2005
and is currently a Ph.D. candidate at RWTH
Aachen University. His main research field
is room acoustic simulation with special focus on interactive real-
time applications such as virtual reality. He is a Member of the Au-
dio Engineering Society (AES) and the German Acoustical Associ-
ation (DEGA).
Michael Vorl
¨
ander is a Professor at RWTH
Aachen University, Germany. After univer-
sity education in physics and doctor de-
gree (Aachen, 1989 with a thesis in room
acoustical computer simulation), he worked
in various fields of acoustics at the PTB
Braunschweig, the National Laboratory for
Physics and Technology. In 1995 he finished
the qualification as university lecturer (ha-
bilitation) with a thesis on reciprocity cali-
bration of microphones. In 1996 he accepted an offer from RWTH
Aachen University for a Chair and Director of the Institute of Te ch-
nical Acoustics. He is President of the European Acoustics Asso-
ciation, EAA, in the term 2004–2007 and former Editor-in-Chief
of the International Journal Acta Acustica united with Acustica
(1998–2003). He is a Member of the German Acoustical Society,
DEGA, of the German Physical Society, DPG, and a Fellow of the
Acoustical Society of America, ASA.
Ingo Assenmacher was born in D
¨
uren, Ger-
many, in 1974. He studied computer science
at RWTH Aachen University, Aachen, and
received a degree of Dipl Inform. (M.Sc.)
degree in 2002. He is currently working at
the Center for Computation and Commu-
nication, RWTH Aachen University, as a Re-
search Assistant and is a Ph.D. candidate
at RWTH Aachen University. His main re-
search fields are interaction in immersive
Virtual Environments, software methods for real-time environ-
ments and virtual-reality-based data visualization and exploration.