Báo cáo hóa học: " Research Article Using Pitch, Amplitude Modulation, and Spatial Cues for Separation of Harmonic Instruments from Stereo Music Recordings" pptx
Bạn đang xem bản rút gọn của tài liệu. Xem và tải ngay bản đầy đủ của tài liệu tại đây (1.51 MB, 10 trang )
Hindawi Publishing Corporation
EURASIP Journal on Advances in Signal Processing
Volume 2007, Article ID 86369, 10 pages
doi:10.1155/2007/86369
Research Article
Using Pitch, Amplitude Modulation, and Spatial
Cues for Separation of Harmonic Instruments
from Stereo Music Recordings
John Woodruff
1
and Bryan Pardo
2
1
Music Technology Program, School of Music, Northwestern University, Evanston, IL 60208, USA
2
Department of Electrical Engineering and Computer Science, Northwestern University, Evanston, IL 60208, USA
Received 2 December 2005; Revised 30 July 2006; Accepted 10 September 2006
Recommended by Masataka Goto
Recent work in blind source sep aration applied to anechoic mixtures of speech allows for improved reconstruction of sources
that rarely overlap in a time-frequency representation. While the assumption that speech mixtures do not overlap significantly
in time-frequency is reasonable, music mixtures rarely meet this constraint, requiring new approaches. We introduce a method
that uses spatial cues from anechoic, stereo music recordings and assumptions regarding the structure of musical source signals to
effectively separ ate mixtures of tonal music. We discuss existing techniques to create partial source signal estimates from regions
of the mixture where source signals do not overlap significantly. We use these partial signals within a new demixing framework, in
which we estimate harmonic masks for each source, allowing the determination of the number of active sources in important time-
frequency frames of the mixture. We then propose a method for distributing energy from time-frequency frames of the mixture to
multiple source signals. This allows dealing with mixtures that contain time-frequency frames in which multiple harmonic sources
are active without requiring knowledge of source characteristics.
Copyright © 2007 Hindawi Publishing Corporation. All rights reserved.
1. INTRODUCTION
Source separation is the process of determining individual
source signals, given only mixtures of the source signals.
When prior analysis of the individual sound sources is not
possible, the problem is considered blind source separation
(BSS). In this work, we focus on the BSS problem as it relates
to recordings of music. A tool that can accomplish blind sep-
aration of musical mixtures would be of use to recording en-
gineers, composers, multimedia producers, and researchers.
Accurate source separation would be of great utility
in many music information retrieval tasks, such as mu-
sic transcription, vocalist and instrument identification, and
melodic comparison of poly phonic music. Source separation
would also facilitate post production of preexisting record-
ings, sample-based musical composition, multichannel ex-
pansion of mono and stereo recordings, and structured audio
coding.
The following section contains a discussion of related
work in source separation, with an emphasis on current
work in music source separation. In Section 3 we present a
new source separation approach, designed to isolate multiple
simultaneous instruments from an anechoic, stereo mixture
of tonal music. The proposed method incorporates existing
statistical BSS techniques and perceptually significant signal
features utilized in computational auditory scene analysis to
deal more effectively with the difficulties that arise in record-
ings of music. Section 4 provides a comparison of our algo-
rithm to the DUET [1] source separation algorithm on ane-
choic, stereo mixtures of three and four harmonic inst ru-
ments, and a discussion of the advantages and limitations of
using our approach. Finally, in Section 5 we summarize our
findings and discuss directions for future research.
2. CURRENT WORK
Approaches to source separation in audio are numerous,
and vary based on factors such as the number of available
mixture channels, the number of source signals, the mix-
ing process used, or whether prior analysis of the sources
is possible. Independent component analysis (ICA) is a well-
established technique that can be used in the BSS problem
when the number of mixtures equals or exceeds the number
of source signals [2–5]. ICA assumes that source signals are
2 EURASIP Journal on Advances in Signal Processing
statistically independent, and iteratively determines t ime-
invariant demixing filters to achieve maximal independence
between sources. When fewer mixtures than sources are
available (i.e., stereo recordings of three or more instru-
ments), the problem is considered the degenerate case of BSS
and traditional ICA approaches cannot be used.
Researchers have proposed sparse statistical methods to
deal more effectively with the degenerate case [1, 6–8]. Sparse
methods assume that in a time-frequency representation,
most time-frequency frames of individual source signals will
have magnitude near zero. In speech, if sources are also in-
dependent (in terms of pitch and amplitude), the assump-
tion that at most one source signal has significant energy in
anygiventime-frequencyframeismade[9]. Given this as-
sumption, binary time-frequency masks can be constructed
based on cross-channel amplitude and phase differences in
an anechoic stereo recording and multiplied by the mixture
to isolate source signals [1, 6]. The DUET algorithm, which
we discuss in more detail in a later section, operates in this
manner.
Tonal music makes extensive use of multiple simultane-
ous instruments, playing consonant intervals. When two har-
monic sources form a consonant interval, their fundamen-
tal frequencies are related by a ratio that results in signifi-
cant overlap between the harmonics (regions of high-energy
at integer multiples of the fundamental frequency) of one
source and those of another source. This creates a problem
for DUET and other binary time-frequency masking meth-
ods that distribute each mixture frame to only one source
signal. The resulting music signal reconstructions can have
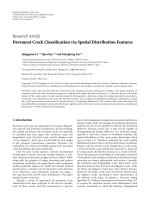
audible gaps and artifacts, as shown in Figure 1.
To deal with overlap of source signals in a time-frequency
representation, researchers have incorporated heuristics
commonly used in computational auditory scene analysis
(CASA). CASA systems seek to organize audio mixtures
based on known principles governing the organization of
sound in human listeners [10, 11]. Perceptually significant
signal features such as pitch, amplitude and frequency mod-
ulation, and common onset and offset are used in CASA sys-
tems to identify time-frequency regions of the mixture that
result from the same sound source [12–14]. While the goal
of many CASA researchers is to create a symbolic represen-
tation of a sound scene in terms of individual sources, CASA
heuristics can be used within source separation algorithms to
both identify mixture regions in which source signals overlap
and to guide the reconstruction of source signals in overlap
regions [2, 12, 14–19].
In the one-channel case, multiple researchers [14, 15,
17, 18] assume that source signals are harmonic in order
to determine time-frequency regions of source signal over-
lap based on the pitch of the individual sources. Virtanen
and Klapuri [ 17, 18] use multipitch estimation to determine
instrument pitches. Time-frequency overlap regions are re-
solved by assuming that the magnitude of each source sig-
nal’s harmonics decreases as a function of frequency. Signals
are then reconstructed using additive synthesis. Published re-
sults based on this method have been shown only for cases
when pitches were determined correctly, so it is difficult to
Time
Frequency
(a)
Time
Frequency
(b)
Time
Frequency
(c)
Figure 1: (a) The spectrogram of a piano playing a C (262 Hz). (b)
The DUET source estimate of the same piano tone when extracted
from a mixture with a saxophone playing G and French horn play-
ing C. (c) The source estimate of the same piano tone extracted from
the same mixture using the proposed source separation algorithm.
assess the robustness of this approach. Reconstructing sig-
nals based solely on additive synthesis also ignores residual,
or nonharmonic energy in pitched instrument signals [20].
Every and Szymanski [15] assume that pitches are known
in advance. Overlap regions are identified based on instru-
ment pitch and resolved by linearly interpolating between
neighboring harmonics of each source and applying spectral-
filtering to the mixture. This approach resolves the limita-
tions imposed by additive synthesis in [17, 18], but the as-
sumption that linear interpolation between the amplitudes
of known harmonics can be used to determine the amplitude
of unknown harmonics is somewhat unrealistic.
In the two-channel case, Viste and Evangelista [19] show
that they can perform iterative source separation by max-
imizing the correlation in amplitude modulation of fre-
quency bands in the reconstructed source signals. Although
this is a promising framework for demixing overlapping
signals, the current approach cannot be applied to mix-
tures where more than two signals overlap . Stereo record-
ings of three or more instruments frequently violate this con-
straint.
Vincent [16] proposes demixing stereo recordings with
two or more instruments by incorporating CASA heuristics,
spatial cues, and time-frequency source signal priors to cast
the demixing problem into a Bayesian estimation framework.
J. Woodruff and B. Pardo 3
This approach is designed to handle reverberant recordings,
but requires significant prior knowledge of each source sig-
nal in the mixture, making it unsuitable for mixtures where
the acoustic characteristics of each source are not known be-
forehand.
3. THE PROPOSED ALGORITHM
In this section, we present a new musical source separation
algorithm. The proposed method is designed to separate ane-
choic, stereo recordings of any number of harmonic musi-
cal sources without prior analysis of the sources and with-
out knowledge of the musical score. This method is similar
to recent approaches in that it incorporates signal features
commonly associated with CASA to achieve separation of
signals that overlap in time-frequency. Our technique differs
from existing methods in that it is designed to work when
the number of sources exceeds the number of mixtures, the
score is unknown, and prior modeling of source signals is
not possible. Since we use an existing time-frequency mask-
ing approach for initial source separation, we require a por-
tion of the time-frequency frames in the mixture contain en-
ergy from only one source signal. This requirement is, how-
ever, substantially reduced when compared to existing time-
frequency masking techniques.
3.1. Overview
Assume that N sources are recorded using two microphones.
If the sound sources are in different locations, the distance
that each source travels to the individual microphones will
produce a unique amplitude and timing difference between
the two recorded signals. These differences, often called spa-
tial cues or mixing parameters, provide information about
the position of the sources relative to the microphones. The
first step in numerous BSS methods is the determination of
mixing parameters for each source signal. Once mixing pa-
rameters are determined, they can be used to distribute time-
frequency frames from the mixture to individual source sig-
nals. In our approach, we assume that mixing parameters can
be determined using the DUET [1] algorithm (Section 3.2),
or from known source locations.
In assigning energy from a time-frequency frame in a pair
of anechoic mixtures to a set of sources, we note three cases of
interest. The first case is where at most one source is active;
we call these one-source frames. In this case, the full energy
from one mixture may be assigned directly to an estimate of
the source j,denotedby
S
j
. The second case is where exactly
two sources are active; two-source frames. In this case, we can
explicitly solve for the correct energy distribution to each ac-
tive source using the system of equations provided by (1).
The third case is w here more than two sources are active;
multisource frames. Since there are at least three unknown
complex values, we cannot solve for the appropriate source
energy and must develop methods to estimate this energy.
We approach source separation in three stages, corresp-
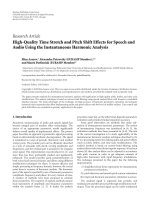
onding to the three cases described above. Figure 2 provides
a diagram of the three stages of analysis and reconstruction
in the proposed algor ithm. In the first stage (Section 3.3), we
create initial signal estimates using the delay and scale sub-
traction sc oring (DASSS) method [21], which identifies time-
frequency frames from the mixture that contain energy from
only one source. If we assume that sources are harmonic and
monophonic, there is often sufficient information in these
initial signal estimates to determine the fundamental fre-
quency of each source.
If fundamental frequencies can be determined, we can
estimate the time-frequency frames associated with each
source’s harmonics, which lets us categorize a dditional mix-
ture frames as one-source, two-source, or multisource. Two-
source frames are then distributed, further refining the
source estimates. This is the second stage of source recon-
struction (Section 3.4).
In the final stage (Section 3.5) we analyze the amplitude
modulation of the partially reconstructed sources to inform
the estimation of source energy in multisource frames. The
remainder of this section describes the implementation of
the proposed source separation algorithm in greater detail.
3.2. Mixing parameter estimation
In this section, we give a brief overview of mixing parame-
ter estimation using DUET. A more thorough discussion of
parameter estimation and the demixing approach taken in
DUET is provided in [1].
Let X
1
(τ, ω)andX
2
(τ, ω) represent the short-time
Fourier transforms of two signal mixtures containing N
source signals, S
j
(τ, ω), recorded by two, omni-directional
microphones,
X
1
(τ, ω) =
N
j=1
S
j
(τ, ω),
X
2
(τ, ω) =
N
j=1
a
j
e
−iωδ
j
S
j
(τ, ω).
(1)
Here, a
j
is the amplitude scaling coefficient and δ
j
is the
time-shift between the two microphones for the jth source,
τ represents the center of a time window, and ω represents a
frequency of analysis used in the STFT. Given these mixture
models, parameter estimation is simply associating a partic-
ular amplitude scaling and time-shift value with each source.
DUET assumes that signals are approximately window-
disjoint orthogonal, meaning that most time-frequency
frames in the mixture contain energy from no more than one
source [1, 9]. Any frame that meets this requirement should
match the amplitude scaling , a
j
, and time-shift, δ
j
,proper-
ties resulting from one source’s physical location relative to
the microphones. Finding the most common pairs of am-
plitude scaling and time-shift values between the two mix-
tures provides a means of estimating the mixing parameters
of each source.
In the rest of this work we assume that the amplitude
scaling, a
j
, and time-shift, δ
j
,canbeestimatedcorrectlyfor
each source j using DUET’s parameter estimation. Alternate
approaches that simulate binaural hearing in humans have
4 EURASIP Journal on Advances in Signal Processing
Stage one analysis
(1) Mixing parameter analysis
(2) Identify one-source frames
STFT of mixtures Cross-channel histogram
(a)
Stage one reconstruction
(3) Create initial signal estimates
from one-source frames
Remaining mixtures Initial source estimates
(b)
Stage two analysis
(1) Pitch estimation of initial signals
(2) Create harmonic masks
Pitch estimates Harmonic masks
(c)
Stage two reconstruction
(3) Source reconstruction from
one-source and two source frames
Remaining mixtures Refined source estimates
(d)
Stage three analysis
(1) Determine harmonic
amplitude envelopes
Harmonic amplitude envelopes
(e)
Stage three reconstruction
(2) Multi-source reconstruction
(3) Residual reconstruction
Final source estimates
(f)
Reconstructed source waveforms
(g)
Figure 2: An illustration of the three stages of the proposed source separation algorithm.
been proposed to localize and separate source sounds with
significant overlap or in reverberant environments [22–24],
however in this work we assume that recordings are made
with a stereo pair of omni-directional microphones.
3.3. Stage one: DASSS analysis and initial
source reconstruction
The DUET algorithm allows for successful demixing when
sources do not simultaneously produce energy at the same
frequency and time. The DASSS method [21]wasdevel-
oped to determine which time-frequency frames of the mix-
ture satisfy this condition, allowing reconstruction of sources
from only the disjoint,orone-sourceframes.Ourapproach
uses DASSS in the first stage to create partial signal estimates
from the single source frames. These estimates are then ana-
lyzed to provide guidance in further distribution of mixture
frames.
3.3.1. Finding one-source frames
To determine which frames in a stereo mixture correspond to
a single source, define a function, Y
j
, for each pair of mixing
parameters, (a
j
, δ
j
), associated with a source signal j,
Y
j
(τ, ω) = X
1
(τ, ω) −
1
a
j
e
iωδ
j
X
2
(τ, ω). (2)
If only one source is active in a given time-frequency frame,
Y
j
(τ, ω) takes on one of two values. Equation (3) represents
the expected values of the Y
j
(τ, ω) functions, under the as-
sumption that a single source, g (represented by the super-
script
g
), was active,
Y
g
j
(τ, ω) =
⎧
⎪
⎪
⎨
⎪
⎪
⎩
0, if j = g,
1 −
a
g
a
j
e
iω(δ
j
−δ
g
)
X
1
(τ, ω), if j = g.
. (3)
J. Woodruff and B. Pardo 5
Equation (4) is a scoring function to compare the expected
values in
Y
g
j
(τ, ω) to the calculated Y
j
(τ, ω),
d(g, τ, ω)
=
∀ j
Y
g
j
(τ, ω) − Y
j
(τ, ω)
∀ j
Y
j
(τ, ω)
. (4)
As the function d(g, τ , ω) approaches zero, the likelihood
that source g was the only active source during the time-
frequency frame (τ, ω) increases. A threshold value can then
be used to determine which frames are one-source. These
frames can be assigned directly to the estimate for source g
[21].
3.3.2. Initial source reconstruction
We distribute the full energy from each one-source frame di-
rectly to the appropriate initial signal estimate,
S
g
, as shown
in (5),
S
g
(τ, ω) =
⎧
⎪
⎪
⎪
⎨
⎪
⎪
⎪
⎩
X
1
(τ, ω), if
d(g, τ, ω) <T
∧g = arg min
∀ j
d(j, τ,ω)
0, else.
(5)
Here, T is a threshold value that determines how much en-
ergy from multiple sources a frame may contain and still be
considered a one-source frame. When setting T,wemust
both limit the error in
S
g
and distribute enough frames to
each source estimate so fundamental frequency estimation in
stage two is possible. We have found that T
= 0.15 balances
these two requirements well [25]. Once an initial signal esti-
mate is created for each source, the signals are analyzed and
further source reconstruction is accomplished in stage two.
3.4. Stage two: source activity analysis and further
source reconstruction
In this stage, we estimate the fundamental frequency of each
source from the partially reconstructed signals. These es-
timates are used to create harmonic masks. The harmonic
mask for a source indicates time-frequency regions w here we
expect energy from that source, given its fundamental fre-
quency. We use these masks to estimate the number of ac-
tive sources in important time-frequency frames remaining
in the mixture. We then refine the initial source estimates by
distributing mixture energy from additional mixture frames
in which either one or two sources are estimated to contain
significant energy.
3.4.1. Determining the active source count using
harmonic masks
We first determine the fundamental frequency of each sig-
nal estimate using an auto-correlation-based technique de-
scribed in [26]. We denote the fundamental frequency of sig-
nal estimate
S
g
for time window τ as F
g
(τ).
Since this estimation is based on partially reconstructed
sources, we employ two rules to refine the fundamental fre-
quencyestimatesofeachsource.Thefirsteliminatesspuri-
ous, short-lived variation in the F
g
estimates. The second ad-
justs F
g
values that we have low confidence in, based on the
amount of energy distributed to the source estimate during
stage one. Details on the refinement of the fundamental fre-
quency estimates based on these rules are provided in [25].
Since we assume harmonic sound sources, we expect
there to be energy at integer multiples of the fundamen-
tal frequency of each source. Accordingly, we create a har-
monic mask, M
g
(τ, ω), a binary time-frequency mask for
each source. Each mask has a value of 1 for frames near inte-
ger multiples of the fundamental frequency and a value of 0
for all other time-frequency frames,
M
g
(τ, ω) =
⎧
⎨
⎩
1, if
∃
k such that
kF
g
(τ) − ω
< Δ
ω
,
0, else.
(6)
Here, k is an integer and Δ
ω
is the maximal allowed difference
in frequency from the kth harmonic. We set Δ
ω
to 1.5times
the frequency resolution used in the STFT processing.
We use the harmonic masks to divide hig h-energy frames
of the mixtures into three categories: one-source frames,
two-source frames, and multisource frames. We do this by
summing the harmonic masks for all the sources to create
the active source count for each frame, C(τ,ω),
C(τ, ω)
=
∀g
M
g
(τ, ω). (7)
3.4.2. Further source reconstruction
Identification of one-source frames using DASSS is not per-
fect because two sources can interfere with each other and
match the cross-channel amplitude scaling and time-shift
characteristics of a third source. Also, we set the threshold
in (5) to accept enough time-frequency frames to estimate
F
g
(τ) for each source. We remove energy that might have
been mistakenly given to each source in (8),
S
two
g
(τ, ω) =
S
one
g
(τ, ω)M
g
(τ, ω). (8)
In (8)and(9) we add the superscripts “one” and “two”
to clarify which stage of source reconstruction is specified.
Thus, (8) eliminates time-frequency frames from the initial
source estimates that are not near the predicted harmonics
of that source. In time-frequency frames where the source
count C(τ,ω)
= 1 and the stage one estimate is zero, we add
energy to the stage two estimates, as shown in (9),
S
two
g
(τ, ω) = X
1
(τ, ω),
if
C(τ, ω) = M
g
(τ, ω) = 1 ∧
S
one
g
(τ, ω) = 0
.
(9)
In time-frequency frames where the source count C(τ,ω)
=
2, we presume the frame has two active sources and u se the
system of equations in (10)and(11) to solve for the source
values,
X
1
(τ, ω) ≈ S
g
(τ, ω)+S
h
(τ, ω), (10)
X
2
(τ, ω) ≈ a
g
e
−iωδ
g
S
g
(τ, ω)+a
h
e
−iωδ
h
S
h
(τ, ω). (11)
6 EURASIP Journal on Advances in Signal Processing
We can solve for source g as in (12), and use (10)tosolvefor
source h,
S
g
(τ, ω) =
X
2
(τ, ω) − a
h
e
−iωδ
h
X
1
(τ, ω)
a
g
e
−iωδ
g
− a
h
e
−iωδ
h
. (12)
Once we have calculated the energy for both sources in the
frame, we add this energy to the source signal estimates. Any
time-frequency frames with C(τ, ω) > 2 are distributed in
stage three.
3.5. Stage three: amplitude modulation analysis
and final reconstruction
In this section we propose a method to estimate the en-
ergy contribution from each source in a multisource mixture
frame, using the reconstructed source signals created during
stages one and two as guides.
We first note that when instrument pitches are stable
for even a short duration of time (20 milliseconds or so),
overlap between source signals tends to occur in sequences
of time-frequency frames. With this in mind, the proposed
multisource estimation method deals with sequences of time
frames at a particular frequency of analysis when possible.
Let [τ
s
, τ
s+n
]beasequenceofmultisourceframesatfre-
quency of analysis ω. In order to estimate the energy in mul-
tiple sources over this sequence of time-frequency frames,
we assume that each source signal’s harmonics will have cor-
related amplitude envelopes over time. Although this is not
precisely the case, this principle is used in instrument syn-
thesis [20], and source separation [2, 14, 19]. CASA algo-
rithms also commonly use correlated amplitude modulation
as a grouping mechanism [11–13].
A harmonic amplitude envelope is an estimate of the am-
plitude modulation trend of a source, based on the harmon-
ics reconstructed in stages one and two. We use these en-
velopes to estimate the energy for harmonics that could not
be resolved in the first two stages, due to overlap with multi-
ple sources. To do this for a sequence of multisource frames
[τ
s
, τ
s+n
]atfrequencyω we require an estimate of
S
g
(τ
s
, ω),
the complex value of each active source at the beginning
of the sequence. If we assume that each source’s phase pro-
gresses linearly over the sequence, the harmonic amplitude
envelopes let us estimate how each source’s energy changes
during the sequence. We can then appropriately assign en-
ergy to each active source g in frames
S
g
(τ
s+1
, ω) through
S
g
(τ
s+n
, ω).
We now describe our method to determine harmonic am-
plitude envelopes, and then proceed with a discussion of how
to estimate
S
g
(τ
s
, ω), the first complex value of each active
source in the sequence of multisource frames.
3.5.1. Determining harmonic amplitude envelopes
To calculate the overall harmonic amplitude envelope for
source g, we first find the amplitude envelope of each har-
monic in the signal estimate for g, using (13). Here, k de-
notes the harmonic number and A
g
(τ, k) is the amplitude
envelope for the kth harmonic. Equation (14)defineswhich
time-frequency frames we include in the estimate of A
g
(τ, k).
A frame is included if both the center frequency of the frame
is within Δ
ω
of the harmonic frequency (see (6)) and the
source signal estimate from stage two contains energy in that
frame,
A
g
(τ, k) = mean
∀ω∈Γ(k)
S
g
(τ, ω)
, (13)
ω
∈ Γ(k)if
ω − kF
g
(τ)
< Δ
ω
∧
S
g
(τ, ω) > 0
.
(14)
Equation (15) normalizes each amplitude envelope so that
each harmonic contributes equally to the overall amplitude
envelope,
A
g
(τ, k) =
A
g
(τ, k)
max
∀τ
A
g
(τ, k)
. (15)
Equation (16) is used to determine the overall harmonic am-
plitude envelope, which we denote, H
g
(τ). This equation
simply finds the average amplitude envelope over all har-
monics, and scales this envelope by the short-term energy of
the signal estimate, as shown in (17). Here, L specifies a time
window over w hich the signal energy is calculated. We in-
clude the amplitude scaling in (16) so the relative strength of
each source’s harmonic amplitude envelope corresponds to
the overall loudness of each source during the time window
L,
H
g
(τ) = mean
∀k
(
A
g
τ, k)
E
g
(τ), (16)
E
g
(τ) =
L/2
λ=−L/2
∀ω
S
g
(τ + λ, ω)
2
. (17)
3.5.2. Estimating
S
g
(τ
s
, ω)
If, for each source g, the first value in the sequence,
S
g
(τ
s
, ω),
can be estimated, then (18)and(19)canbeusedtoes-
timate the values of the sources in the remaining multi-
source frames, [τ
s+1
, τ
s+n
]. Here, we set τ
a
= τ
s
and τ
b
∈
[τ
s+1
, τ
s+n
],
S
g
τ
b
, ω
=
H
g
τ
b
H
g
τ
a
S
g
τ
a
, ω
, (18)
∠
S
g
τ
b
, ω
= mod
∠
S
g
τ
a
, ω
+
τ
b
− τ
a
ω,2π
.
(19)
3.5.3. Estimation from a prior example
The frame immediately before the start of the sequence of
multisource frames in question is (τ
s−1
, ω). If a source esti-
mate was already g iven energy in this frame during stage one
or two (i.e., if
|
S
g
(τ
s−1
, ω)| > 0), we can use
S
g
(τ
s−1
, ω)to
estimate
S
g
(τ
s
, ω) using (18)and(19) by setting τ
a
= τ
s−1
and τ
b
= τ
s
.
Since stage one and two only resolve one-source and two-
source frames, no matter how many sources we are estimat-
ing in frame τ
s
, we can expect that |
S
g
(τ
s−1
, ω)| > 0forat
J. Woodruff and B. Pardo 7
most two sources. We estimate |
S
g
(τ
s
, ω)| for the remaining
active sources by assuming that the relationship between the
amplitudes of two different sources’ harmonics at frequency
ω will be proportional to the relationship between the two
sources’ average harmonic amplitude, or H
g
(τ).
We denote a source whose amplitude was estimated using
(18)asn, and now estimate the amplitude of any remaining
active source in frame τ
s
,
S
g
τ
s
, ω
=
H
g
τ
s
H
n
τ
s
S
n
τ
s
, ω
. (20)
We set the phase of sources whose amplitudes are derived us-
ing (20)toavalueof0.
3.5.4. Estimation without a prior example
If after stage two,
|
S
g
(τ
s−1
, ω)|=0forallsources,wemust
use an alternate method of estimating
S
g
(τ
s
, ω). In this case,
we rely on the assumption that overlapping signals will cause
amplitude beating (amplitude modulation resulting from in-
terference between signals) in the mixture signals. The time
frame with maximal amplitude in the mixture signals during
the sequence [τ
s
, τ
s+n
] corresponds to the frame in which the
most constructive interference between active sources takes
place. We assume that this point of maximal constructive in-
terference results from all active sources having equal phase
and cal l this frame τ
MaxInt
. With this assumption, (8), altered
for the N active source case in frame (τ
MaxInt
, ω), yields (21),
where Φ is the set of active sources in the multisource se-
quence, [τ
s
, τ
s+n
], as determined by the harmonic masks,
X
1
τ
MaxInt
, ω
≈
∀g∈Φ
S
g
τ
MaxInt
, ω
. (21)
Theamplitudeofanyactivesourceg can then be determined
using (22),
S
g
τ
MaxInt
, ω
=
X
1
τ
MaxInt
, ω
H
g
τ
MaxInt
∀h∈Φ
H
h
τ
MaxInt
.
(22)
To find
|
S
g
(τ
s
, ω)| from |
S
g
(τ
MaxInt
, ω)| we apply (18)with
τ
a
= τ
MaxInt
and τ
b
= τ
s
. We set the phase values of each
active source during the first frame, ∠
S
g
(τ
s
, ω), to a default
value of 0.
We now apply ( 18)and(19) to determine
S
g
(τ
s+1
, ω)
through
S
g
(τ
s+n
, ω)from
S
g
(τ
s
, ω), and complete this pro-
cess for each sequence of multisource fr ames determined by
the source count, C(τ,ω).
3.5.5. Distributing residual energy
Thus far, we have focused our attention on the harmonic re-
gions of individual source signals. Even though we are as-
suming that source signals are harmonic, harmonic instru-
ment signals also contain energy at nonharmonic frequen-
cies due to factors such as excitation noise [20]. The nonhar-
monic energy in a harmonic signal is often called the resid-
ual ene rgy. We take a simple approach to the distribution
of residual energy in that we distribute any remaining time-
frequency frame of the mixture to the most likely source us-
ing an altered version of (5), shown in (23),
S
g
(τ, ω) =
⎧
⎨
⎩
X
1
(τ, ω), if
g = arg min
∀ j
d(j, τ,ω)
,
0, else.
(23)
Once the residual energy has been distributed, each source
estimate,
S
g
(τ, ω), is transformed back into the time domain
using the overlap-add technique [27]. The result is a time
domain waveform of each reconstructed source signal.
4. EXPERIMENTAL RESULTS
In this section we compare the performance of the proposed
method and the DUET algorithm on three and four instru-
ment mixtures. We chose to compare performance to DUET
because our approach is designed with the same mixture
models and constraints, making it a natural extension of
time-frequency masking techniques such as DUET. In pre-
vious work [25, 28] we have called our approach the active
source estimation algorithm. For convenience, we refer to our
method as ASE in the discussion below.
4.1. Mixture creation
The instrument recordings used in the testing mixtures are
individual long-tones played by alto flute, alto and soprano
saxophones, bassoon, B-flat and E-flat clarinets, French
horn, oboe, trombone, and trumpet, all taken from the Uni-
versity of Iowa musical instrument database [29].
Mixtures of these recordings were created to simulate the
stereo microphone pickup of spaced source sounds in an
anechoic environment. We assume omni-directional micro-
phones, spaced according to the highest frequency we expect
to process, as in [1]. Instruments were placed in a semicir-
cle around the microphone pair at a distance of one meter.
In the three-instrument mixtures, the difference in azimuth
angle from the sources to the microphones was 90
◦
. In the
four-instrument case, it was 60
◦
.
For each mixture, each source signal was assigned a ran-
domly selected instrument and a randomly selected pitch
from 13 pitches of the equal tempered scale, C4 through C5.
We created 1000 three-instrument mixtures and 1000 four-
instrument mixtures in this manner.
We wanted mixtures to realistically simulate a perfor-
mance scenario in which instrument attacks are closely
aligned. For this reason, each sample used was hand cropped
so that the source energy is present at the beginning of the
file. Although the instrument attack times vary to some ex-
tent, cropping samples in this manner ensures that the cre-
ated mixtures contain each instrument in all time frames of
analysis.
Each source was normalized to have unit energy prior
to mixing. Mixtures were created at 22.05 kHz and 16 bits,
and were 1 second in length. Mixtures were separated into
reconstructed source sig nals by our method and the DUET
8 EURASIP Journal on Advances in Signal Processing
algorithm, using a window length of 46 milliseconds and step
size of 6 milliseconds for STFT processing.
Extracted sources were then compared to the original
sources using the signal-to-distortion ratio (SDR)described
in [30]. In (24), s represents the original time-domain source
signal,
SDR
= 10 log
10
⎛
⎝
s, s
2
s, s
2
−
s, s
2
⎞
⎠
. (24)
4.2. Results
In order to assess the utility of the multisource distribution
stage proposed in Section 3.5, we compared performance re-
sults using the full algorithm as presented in Section 3 (de-
noted as ASE 1 in Table 1 ) and a simpler multisource dis-
tribution scheme. The alternate algorithm, denoted as ASE
2, is identical to ASE 1 until the multisource distribution
stage from Section 3.5, where ASE 2 dist ributes multisource
frames of the mixture, unaltered, to each active source.
Table 1 shows the median performance of ASE 1, ASE 2,
and DUET on the testing data. The median performance is
measured over the total number of source signals, 3000 in
the three-instrument tests and 4000 in the four-instrument
tests. Results of all mixtures containing consonant musical
intervals are also shown. The ASE performance data is not
normally dist ributed, thus we do not show means and stan-
dard deviations of the SDR data. In a nonparametric sign
test performed over all mixtures, we found the median per-
formance to be significantly different between ASE 1, ASE 2,
and DUET, with p < 10
−50
in all three comparisons.
Thesoledifference between ASE 1 and ASE 2 is in the
method used to assign energy from time-frequency frames
with energy from three or more sources. The results in
Table 1 indicate that the multi-source energy assignment
method in Section 3.5 improves performance, when com-
pared to a simpler approach of simply assigning multisource
energy evenly to each active source.
A primary goal of the ASE system was to reduce the re-
liance on nearly disjoint source signals, when compared to
existing time-frequency masking techniques. To determine
how both ASE and DUET perform as a function of inter-
ference from other sources, we use a measure of disjoint en-
ergy, DE. Disjoint energy represents the amount of energy
in a source signal that is not heavily interfered with by other
sources in the mix. We calculate DE as a simple ratio, where
the energy in all time-frequency fra mes that are deemed dis-
joint (less than 1 dB error caused by interfering sources) in a
particular mixture is divided by the total energy in the signal,
resulting in a value between 0 and 1. A DE score of 0 reflects
that all time-frequency frames of a source signal are distorted
by at least 1 dB due to the other sources in the mixture, while
a v alue of 1 reflects that interference from other sources is
restricted to less than 1 dB in all time-frequency frames. We
chose the error threshold of 1 dB because on informal tests,
subjects were unable to detect random amplitude distortions
of less than 1 dB when applied to all time-frequency frames
Table 1: Median signal-to-distortion ratio of the ASE and DUET
algorithms on 1000 three-instrument mixtures (3000 signals) and
1000 four-instrument mixtures (4000 signals). The table also shows
median performance on three- and four-instrument mixtures con-
taining specific musical intervals: unison (2383 signals), octave (366
signals), perfect fifth (1395 signals), and perfect fourth (1812 sig-
nals). Higher values are better.
ASE 1 ASE 2 DUET
All mixtures 13.77 dB 12.26 dB 10.22 dB
Three-instrument mixtures 18.63 dB 17.57 dB 14.12 dB
Four-instrument mixtures 10.22 dB 9.01 dB 8.13 dB
Unison 4.72 dB 3.63 dB 2.92 dB
Octave 8.79 dB 6.82 dB 6.38 dB
Fifth 13.36 dB 11.44 dB 8.13 dB
Fourth 13.99 dB 13.05 dB 10.45 dB
20
10
0
10
20
30
Signal-to-distortion ratio (dB)
0-0.20.2-0.40.4-0.60.6-0.80.8-1
Disjoint energy (DE)
0.47
0.59
8.24
6
13.81
9.67
19.57
15.75
22.9
21.62
ASE
DUET
Figure 3: ASE 1 and DUET SDR performance over five groups of
signals. Signals are grouped according to disjoint energy, DE.Me-
dian performance is shown in the lower half of each box. Higher
values are better.
of a signal independently. More details on the calculation of
DE are provided in [25].
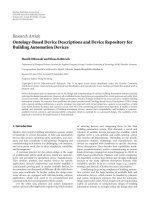
Figure 3 shows SDR performance for ASE 1 and DUET as
afunctionofDE. We first divided the data set into five cate-
gories: source signals with DE
∈ (0, 0.2), (0.2, 0.4), (0.4, 0.6),
(0.6, 0.8), and (0.8, 1). We show boxplots of the SDR perfor-
mance by ASE 1 and DUET on all signals within these group-
ings. The lower and upper lines of each box show 25th and
75th percentiles of the sample. The line in the middle of each
box is the sample median. The lines extending above and be-
low the box show the extent of the rest of the sample, exclud-
ing outliers. Outliers are defined as points further from the
J. Woodruff and B. Pardo 9
sample median than 1.5 times the interquartile range and are
not shown.
When disjoint energy is 0.8orgreater,bothASEand
DUET do quite well in source separation and the perfor-
mance improvement provided by our approach is moder-
ate. As the disjoint energy in a source signal decreases, the
improvement provided by ASE increases, as we can see on
signals with DE between 0.2and0.8. This suggests that our
approach can deal more effectively with partially obstructed
source signals. Performance improvement is greatest for sig-
nals with DE between 0.4and0.6 (over 4 dB), or signals with
roughly half of their energy unobstructed. As a source sig-
nal’s DE falls below 0.2, the performance by both algorithms
is poor, although only 17.56% of the signals in the mixtures
created for this s tudy had DE below 0.2.
It is also clear that as DE falls, the variability of ASE SDR
performance increases. This results from the fact that ASE
relies on fundamental frequency estimation of partial sig-
nals, created from only the disjoint (nonoverlapping) time-
frequency frames of each signal. In cases where fundamen-
tal frequency is estimated correctly, performance of ASE is
good despite significant source overlap. When fundamental
frequencies are incorrect, reconstruction of signals can be de-
graded when compared to DUET. While this is a limitation
of our approach, the data is promising in that more reliable
fundamental frequency estimation techniques may provide
significant performance improvements. We found that fun-
damental frequencies were estimated correctly in 89.42% of
the total time frames in the three-instrument data set and in
84.3% of the time frames in the four-instrument data set. In
other work, we have seen that using pitch information pro-
vided by an aligned musical score can lead to statistically sig-
nificant SDR improvements averaging nearly 2 dB [28]ona
corpus of four-part Bach chorales.
5. CONCLUSIONS AND FUTURE WORK
In this work we have presented a method to extend time-
frequency disjoint techniques for blind source separation to
the case where there are harmonic sources with significant
time-frequency overlap. We showed our method’s improve-
ment over the DUET method at separ ating individual musi-
cal instruments from contexts which contain low amounts of
disjoint signal energy.
We improve source reconstruction by predicting the ex-
pected time-frequency locations of source har monics. These
predictions are used to determine which sources are active in
each time-frequency frame. These predictions are based on
fundamental frequencies estimated from incomplete source
reconstructions. In the future, we intend to develop methods
to generate source templates from disjoint mixture regions
that do not assume harmonic sources.
In this paper, we introduced an analytic approach to as-
sign energy from two-source time-frequency frames. Our
methods of assigning energy from frames with more than
two sources make somewhat unrealistic assumptions. De-
spite this, source separation is still improved, when com-
pared to systems that do not attempt to appropriately as-
sign energy from time-frequency frames with three or more
sources. In future work we wi ll explore improved ways to de-
termine source amplitude and phase in these cases.
The theme of this work and our future work will remain
rooted in the idea of learning about source signals through
partial output signals. Considering that in any truly blind al-
gorithm we will have no a priori knowledge about the source
signals, techniques such as these can provide the necessary
means for deconstructing di fficult mixtures.
Although there are still many obstacles which prevent ro-
bust, blind separation of real-world musical mixtures, the
performance of our approach on anechoic mixtures provides
promising evidence that we are nearing a tool that can effec-
tively process real musical recordings.
REFERENCES
[1]
¨
O. Yilmaz and S. Rickard, “Blind separation of speech mix-
tures via time-frequency masking,” IEEE Transactions on Sig-
nal Processing, vol. 52, no. 7, pp. 1830–1846, 2004.
[2] J. Anem
¨
uller and B. Kollmeier, “Amplitude modulation decor-
relation for convolutive blind source separation,” in Proceed-
ings of the 2nd International Workshop on Independent Compo-
nent Analysis and Blind Signal Separation (ICA ’00), pp. 215–
220, Helsinki, Finland, June 2000.
[3] T W. Lee, A. J. Bell, and R. Orglmeister, “Blind source separa-
tion of real world signals,” in Proceedings of the IEEE Interna-
tional Conference on Neural Networks, vol. 4, pp. 2129–2134,
Houston, Tex, USA, June 1997.
[4] L. C. Parra and C. D. Spence, “Separation of non-stationary
natural signals,” in Independent Component Analysis: Principles
and Practice, pp. 135–157, Cambridge University Press, Cam-
bridge, Mass, USA, 2001.
[5] J. V. Stone, Independent Component Analysis: A Tutorial Intro-
duction, MIT Press, Cambridge, Mass, USA, 2004.
[6] P. Aarabi, G. Shi, and O. Jahromi, “Robust speech separation
using time-frequency masking,” in Proceedings of the IEEE In-
ternational Conference on Multimedia and Expo (ICME ’03),
vol. 1, pp. 741–744, Baltimore, Md, USA, July 2003.
[7] R. Balan and J. Rosca, “Source separation using sparse discrete
prior models,” in Proceedings of the Workshop on Signal Pro-
cessing with Adaptive Sparse Structured Representations (SPARS
’05), Rennes, France, November 2005.
[8]P.D.O’Grady,B.A.Pearlmutter,andS.T.Rickard,“Survey
of sparse and non-sparse methods in source separation,” In-
ternational Journal of Imaging Systems and Technology, vol. 15,
no. 1, pp. 18–33, 2005.
[9] S. Rickard and
¨
O. Yilmaz, “On the approximate W-disjoint
orthogonality of speech,” in Proceedings of IEEE International
Conference on Acoustics, Speech and Signal Processing (ICASSP
’02), vol. 1, pp. 529–532, Orlando, Fla, USA, May 2002.
[10] A. Bregman, Auditory Scene Analysis: The Perceptual Organi-
zation of Sound, The MIT Press, Cambridge, Mass, USA, 1990.
[11] D. F. Rosenthal and H. G. Okuno, Computational Auditory
Scene Analysis, Lawrence Erlbaum Associates, Mahwah, NJ,
USA, 1998.
[12] G. J. Brown and D. Wang, “Separation of speech by computa-
tional auditory scene analysis,” in Speech Enhancement,J.Ben-
esty, S. Makino, and J. Chen, Eds., pp. 371–402, Springer, New
York, NY, USA, 2005.
10 EURASIP Journal on Advances in Signal Processing
[13] D. Ellis, “Prediction-driven computational auditory scene
analysis,” Ph.D. dissertation, Media Laboratory, Massachusetts
Institute of Technology, Cambridge, Mass, USA, 1996.
[14] G. Hu and D. L. Wang, “Monaural speech segregation based
on pitch tracking and amplitude modulation,” IEEE Transac-
tionsonNeuralNetworks, vol. 15, no. 5, pp. 1135–1150, 2004.
[15] M. Every and J. Szymanski, “A spectral-filtering approach to
music signal separation,” in Proceedings of the 7th International
Conference on Digital Audio Effects (DAFx ’04), pp. 197–200,
Naples, Italy, October 2004.
[16] E. Vincent, “Musical source separation using time-frequency
source priors,” IEEE Transactions on Audio, Speech and Lan-
guage Processing, vol. 14, no. 1, pp. 91–98, 2006.
[17] T. Virtanen and A. Klapuri, “Separation of harmonic sounds
using multipitch analysis and iterative parameter estimation,”
in Proceedings of IEEE Workshop on Applications of Signal Pro-
cessing to Audio and Acoustics, pp. 83–86, New Paltz, NY, USA,
October 2001.
[18] T. Virtanen and A. Klapuri, “Separation of harmonic sounds
using linear models for the overtone series,” in Proceedings of
IEEEInternationalConferenceonAcoustics,SpeechandSignal
Processing (ICASSP ’02), vol. 2, pp. 1757–1760, Orlando, Fla,
USA, May 2002.
[19] H. Viste and G. Evangelista, “Separation of har monic instru-
ments with overlapping partials in multi-channel mixtures,”
in Proceedings of IEEE Workshop on Applications of Signal Pro-
cessing to Audio and Acoustics, pp. 25–28, New Paltz, NY, USA,
October 2003.
[20] J. C. Risset and D. Wessel, “Exploration of timbre by analy-
sis and synthesis,” in The Psychology of Music, pp. 26–58, Aca-
demic Press, New York, NY, USA, 1982.
[21] A. S. Master, “Sound source separation of n sources from
stereo signals via fitting to n models each lacking one source,”
Tech. Rep., CCRMA, Stanford University, Stanford, Calif,
USA, 2003.
[22] N. Roman, D. Wang, and G. J. Brown, “Speech segregation
based on sound localization,” Journal of the Acoustical Society
of America, vol. 114, no. 4, pp. 2236–2252, 2003.
[23] H. Viste and G. Evangelista, “On the use of spatial cues to
improve binaural source separation,” in Proceedings of the 6th
International Conference on Digital Audio Effects (DAFx ’03),
London, UK, September 2003.
[24] H. Viste and G. Evangelista, “Binaural source localization,” in
Proceedings of the 7th International Conference on Dig ital Audio
Effects (DAFx ’04), pp. 145–150, Naples, Italy, October 2004.
[25] J. Woodruff and B. Pardo, “Active source estimation for im-
proved source separation,” Tech. Rep. NWU-EECS-06-01,
EECS Department, Northwestern University, Evanston, Ill,
USA, 2006.
[26] P. Boersma, “Accurate short-term analysis of the fundamen-
tal frequency and the harmonics-to-noise ratio of a sampled
sound,” in Proceedings of the Institute of Phonetic Sciences of the
University of Amsterdam, vol. 17, pp. 97–110, Amsterdam, The
Netherlands, 1993.
[27] A. V. Oppenheim and R. W. Schafer, Discrete-Time Signal Pro-
cessing, Prentice Hall, Englewood Cliffs, NJ, USA, 1989.
[28] J. Woodruff, B. Pardo, and R. Dannenberg, “Remixing stereo
music with score-informed source separation,” in Proceed-
ings of the International Symposium on Music Information Re-
trieval (ISMIR ’06), Victoria, British Columbia, Canada, Oc-
tober 2006.
[29] L. Fritts, University of Iowa Musical Instrument Samples, http:
//theremin.music.uiowa.edu.
[30] R. Gribonval, L. Benaroya, E. Vincent, and C. Fevotte, “Pro-
posals for performance measurement in source separation,” in
Proceedings of the 4th International Symposium on Independent
Component Analysis and Blind Signal Separation (ICA ’03),
Nara, Japan, April 2003.
John Woodruff is a doctoral student and
Teaching Assistant in the Ohio State Uni-
versity, Department of Computer Science
and Engineering. He received a B.F.A. de-
gree in performing arts and technology in
2002 and a B.S. degree in mathematics in
2004 from the University of Michigan. He
received an M.Mus. degree in music tech-
nology in 2006 from Northwestern Univer-
sity. At Michigan, he was a Laboratory In-
structor for the School of Music and both Manager and instructor
for the sound recording facilities at the Duderstadt Center. While
at Northwestern, he was a Research Assistant in the Department of
Electrical Engineering and Computer Science and a Teaching As-
sistant in the School of Music. His current research interests in-
clude music source separ ation, music signal modeling, and compu-
tational auditory scene analysis. He is also an active Recording En-
gineer, Electroacoustic Composer, and Songwriter, and performs
on both guitar and laptop. His music is available on the 482-music
recording label.
Bryan Pardo is an Assistant Professor in the
Northwestern University, Department of
Electrical Engineering and Computer Sci-
ence with a courtesy appointment in North-
western University’s School of Music. His
academic career began at the Ohio State
University, where he received both a B.Mus.
degree in Jazz Composition and an M.S. de-
gree in Computer Science. After graduation,
he spent several years working as a Jazz Mu-
sician and Software Developer. As a Software Developer he worked
for t he Speech & Hearing Science Department of Ohio State and
for the statistical software company SPSS. He then attended the
University of Michigan, where he received an M.Mus. degree in
Jazz and Improvisation, followed by a Ph.D. degree in Computer
Science. Over the years, he has also been featured on five albums,
taught for two years as a n Adjunct Professor in the Music Depart-
ment of Madonna University, and worked as a researcher for gen-
eral dynamics on machine learning tasks. When he is not program-
ming, writing, or teaching, he performs on saxophone and clarinet
throughout the Midwest.