Báo cáo hóa học: " Time-Frequency Feature Extraction of Newborn EEG Seizure Using SVD-Based Techniques" pot
Bạn đang xem bản rút gọn của tài liệu. Xem và tải ngay bản đầy đủ của tài liệu tại đây (920.37 KB, 11 trang )
EURASIP Journal on Applied Signal Processing 2004:16, 2544–2554
c
2004 Hindawi Publishing Corporation
Time-Frequency Feature Extraction of Newborn
EEG Seizure Using SVD-Based Techniques
Hamid Hassanpour
Lab of Signal Processing Research, Queensland University of Technology, GPO Box 2434, Brisbane, QLD 4001, Australia
Email:
Mostefa Mesbah
Lab of Signal Processing Research, Queensland University of Technology, GPO Box 2434, Brisbane, QLD 4001, Australia
Email:
Boualem Boashash
Lab of Signal Processing Research, Queensland University of Technology, GPO Box 2434, Brisbane, QLD 4001, Australia
Email:
Received 27 August 2003; Revised 17 May 2004
The nonstationary and multicomponent nature of newborn EEG seizures tends to increase the complexity of the seizure detection
problem. In dealing with this type of problems, time-frequency-based techniques were shown to outperform classical techniques.
This paper presents a new time-frequency-based EEG seizure detection technique. The technique uses an estimate of the distribu-
tion function of the singular vectors associated with the time-frequency distribution of an EEG epoch to characterise the patterns
embedded in the signal. The estimated distr ibution functions related to seizure and nonseizure epochs were used to train a neural
network to discriminate between seizure and nonseizure patterns.
Keywords and phrases: detection, time-frequency distribution, singular value decomposition, probability distribution function.
1. INTRODUCTION
Clinical signs of central nervous system dysfunctions in the
neonate are often revealed by seizures which are the results
of synchronous discharge of a large number of neurons [1].
Seizures increase the risk of impaired neurological and devel-
opmental functioning in neonatal period and also increase
the risk of death [2].
Clinical manifestations of seizure in adults such as body
jerking, repetitive winking, or fluttering of eyelids are well
defined and easily recognisable. However, in newborns, the
clinical signs are not as clear and can be missed without con-
stant and close supervision. In neonates, the brain function
is constantly changing as its neurophysiology matures [3, 4].
This emphasises the nonstationary behaviour of the elec-
troencephalogram (EEG) in neonates [5, 6]. In addition, the
frequency spectrum of the background EEG largely overlaps
with the seizure one [7]. This behaviour makes the task of
analysing newborn EEG signal a complex one for both neu-
rologists and signal analysts. To overcome this complexity,
time-frequency- (TF) based techniques were introduced.
Neonatal EEG seizures have signatures in both low fre-
quency (as low as 0.5 Hz) [8] and high frequency (higher
than 70 Hz) [9]. This study concentrates on using the low-
frequency signatures for seizure detection. Detection of EEG
seizures using the low-frequency signature requires a lower
number of data samples, hence the computational time is
reduced. To remove the high-frequency activity, the signal
is filtered by a lowpass filter with a cutoff frequency 10 Hz.
The filtered signal is then segmented into 30-second epochs.
By choosing 30-second epochs we are not assuming that the
minimum seizure length is 30 seconds. Indeed, in the pre-
sented technique, no limitation for the minimum length of
seizure was assumed. However, the longer the duration of
EEG epochs, the better is the discrimination between seizures
and nonseizures. Choosing 30 seconds for the duration of
epochs is found to be adequate for the feature extraction
process and also alleviates the computation task. Once the
EEG is seg mented, the epochs are mapped into the TF do-
main. To extract the features of the seizure, we use a singular-
value-decomposition- (SVD) based technique applied to the
TF dist ribution (TFD) of the EEG epochs. Singular vectors
SVD-Based Time-Frequency Feature Extraction for Newborn EEG Seizure 2545
(SVs) of a matrix are the span bases of the matrix, and their
importance in the composition of the matrix is reflected by
the related singular values. Since SVs are orthonormal [10],
their squared elements can be treated as probability density
function (PDF) [11].ThesePDFsareusedintheprocessof
seizure feature extraction in this paper.
2. EEG DATA ACQUISITION
EEG data acquisition was performed on the newborn, ages
ranging between two days and two weeks, at the Royal
Women’s Hospital, Brisbane, Australia. The electrodes were
placed on the scalp according to the 10–20 International
System of Electrode Placement. The data were recorded on
20 channels using Medelec (Oxford Instruments, UK) soft-
ware/hardware environment. The sampling frequency was
set to 256 Hz. The seizure activities on the recordings were
visually labeled by a neurologist from the Neurosciences De-
partment at the Royal Children’s Hospital.
3. TF-BASED FEATURE EXTRACTION
In analysing nonstationary and multicomponent signals, the
TF-based techniques have been shown to outperform clas-
sical techniques based on either time or frequency domains
[12]. SVs of the matrix associated with the TFD of a signal
can be used to characterise the signal. By using the SVD tech-
nique, the SVs and their importance in the composition of
the matrix (singular values) are computed.
3.1. TFD of signals
TFDs are powerful tools for extracting features of the pat-
terns embedded in a nonstationary signal [13]. The TFD of
a signal is a joint representation in both time and frequency
domains. For a given signal x(t), the TFD that belongs to the
quadratic class can be expressed as [14]
ρ
z
(t, f ) =
∞
−∞
∞
−∞
∞
−∞
e
j2πv(u−t)
g(v, τ)z
u +
τ
2
z
∗
×
u −
τ
2
e
− j2πfτ
dv dudτ,
(1)
where z(t) is the analytic signal associated with x(t), and
g(v, τ) is a 2-dimensional kernel that determines the char-
acteristics of the TFD. For example, by setting g(v, τ) = 1, we
get the Wigner-Ville distribution (WVD), and with g(v, τ) =
|τ|
β
|Γ(β + jπv)|
2
/2
1−2β
Γ(2β), the equation represents the B-
distribution [15]. In the B-distribution, Γ(·) represents the
Gamma function and β is a smoothing parameter.
The bilinear operation on the signal in (1)mayproduce
spurious components, cross-terms, in the TFD when the
signal is a multicomponent or a nonlinear FM [16]. The
reduced interference distributions (RIDs), such as the B-
distribution, have been introduced to reduce the effect of
cross-terms on the TFD of a signal [15]. Different TF kernels
are valuable under certain conditions, hence their suitabil-
ity is application dependent. It has been shown that the B-
distribution is very suitable, in terms of resolution and cross-
terms, for analysing the low-frequency activities in the EEG
signal [8]. A TFD with high resolution provides a better in-
sight in the analysis of signals, especially when the signals
are multicomponent and the components are close to each
other.
3.2. SVD
The SVD method has been a valuable tool in signal process-
ing and statistical data analysis. A SVD of an M × N matrix
X, representing the TFD of the signal x,isgivenby
X = UΣV
T
,(2)
where U(M × M)andV(N × N) are orthonormal matri-
ces, and Σ is an M × N diagonal matrix of singular values
(σ
ij
= 0ifi = j and σ
11
≥ σ
22
≥··· ≥ 0). The columns
of the orthonormal matrices U and V are called the left and
right SVs, respectively. An important property of U and V is
that they are mutually orthogonal [10]. The singular values
(σ
ii
) represent the importance of individual SVs in the com-
position of the matrix. In other words, SVs corresponding to
the larger singular values have more information about the
structure of patterns embedded in the matrix than the other
SVs.
3.3. Using SVs to characterise signal in the TF domain
In the analysis of signals in the TF domain using SVD, the
type of TF distribution is important. Indeed, it is desirable
that the TFD has both less cross-terms and high resolution.
To satisfy these specifications, we use the B-distribution [17],
which has been shown to give good performance for new-
born EEG signals [8].
Previous researches have mostly concentrated on features
based only on the singular values of the TFD of the signals
[18, 19]. By themselves, singular values do not carry signifi-
cant information about the behaviour of patterns embedded
in the matrix. In other words, they are not suitable features
for classification purposes [11, 20].
To find the characteristics of a signal in the TF domain
using the SVD technique, we propose to use the right and left
SVs corresponding to the largest singular values. The reason
is that the right and left SVs contain the time and frequency
domain information of the signal, respectively [11]. In ad-
dition, SVs related to the largest singular values have more
information about the structure of the signal. Consequently,
if the structure of signals are different for dissimilar classes,
using SVs related to the largest singular values is more suit-
able for classification [21]. However, SVs corresponding to
the lowest singular values would be more appropriate if the
structure of different classes are similar to each other (see,
e.g., [22]).
To show that both left and right SVs are necessary to char-
acterise a signal in the TF domain, examples are given be-
low. Assume that x
1
(t)andx
2
(t) are two linear FM signals in
2546 EURASIP Journal on Applied Signal Processing
30
25
20
15
10
5
1234567
Frequency (Hz)
Time (s)
(a)
30
25
20
15
10
5
1234567
Frequency (Hz)
Time (s)
(b)
Figure 1: The TFD of two linear FM signals in the noise: (a) t
1
(t) and (b) x
2
(t)(Fs = 15 Hz, N = 450, time resolution= 5).
450
400
350
300
250
200
150
100
50
0
12345678910
Bin
Value
(a)
450
400
350
300
250
200
150
100
50
0
12345 678910
Value
Bin
(b)
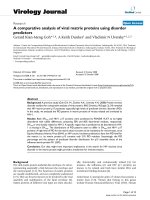
Figure 2: The first ten singular values of the TFDs related to (a) x
1
(t) and (b) x
2
(t).
white noise n(t); that is,
x
1
(t) = sin
4πt +0.02πt
2
Π
t − 15
18
+ n(t),
x
2
(t) = sin
12πt − 0.02πt
2
Π
t − 15
18
+ n(t),
(3)
where Π(
·) is the rectangular function. The rectangular
function is defined as
Π(α)
=
1if−
1
2
<α<
1
2
,
0 otherwise.
(4)
The TFDs of these two signals are shown in Figure 1. In the
figure, the power spectral density and the time-domain rep-
resentation of the signal are displayed at the bottom and left
side of the TF plane. The singular values related to the TFD
of these signals (see Figure 2) show that the two signals are
not distinguishable using the singular values alone. Figure 3
shows the first two right SVs related to the TFDs of Figure 1.
These two SVs are similar in spite of the fact that the two sig-
nals are different. Figure 4, however, shows that the two left
SVs are different.
Another example that illustrates the above claim is given
below. Assume that
x
3
(t) = sin
4πt +0.02πt
2
Π
t − 9
6
+Π
t − 21
6
+ n(t).
(5)
The TFD of the signal along with the singular values and the
first two SVs related to the TFD are shown in Figure 5.Itcan
be seen in the figure that the left SVs are similar to those
of x
1
(t) represented in Figure 4a, whereas the right SVs are
different.
SVD-Based Time-Frequency Feature Extraction for Newborn EEG Seizure 2547
1
0.5
0
−0.5
−1
0 5 10 15 20 25 30
Time (s)
The first right SV
Amplitude
1
0.5
0
−0.5
−1
0 5 10 15 20 25 30
Time (s)
The first right SV
Amplitude
1
0.5
0
−0.5
−1
0 5 10 15 20 25 30
Time (s)
The second right SV
Amplitude
(a)
1
0.5
0
−0.5
−1
0 5 10 15 20 25 30
Time (s)
The second right SV
Amplitude
(b)
Figure 3:ThefirsttworightSVsoftheTFDsrelatedto(a)x
1
(t) and (b) x
2
(t).
1
0.5
0
−0.5
−1
012345678
Frequency (Hz)
ThefirstleftSV
Amplitude
1
0.5
0
−0.5
−1
012345678
Frequency (Hz)
ThefirstleftSV
Amplitude
1
0.5
0
−0.5
−1
012345678
Frequency (Hz)
ThesecondleftSV
Amplitude
(a)
1
0.5
0
−0.5
−1
012345678
Frequency (Hz)
ThesecondleftSV
Amplitude
(b)
Figure 4: The first two left SVs of the TFDs related to (a) x
1
(t) and (b) x
2
(t).
The above examples show that to unambiguously charac-
terise nonstationary signals in the TF domain, left and right
SVs should be used simultaneously.
In [20], the authors introduced an SVD-based approach
for TF feature extraction of nonstationary signals. The tech-
nique attempts to approximate the TF patterns through a
number of rectangles. In the TF plot, the area with a uniform
energy density is represented by a rectangle. The rectangles
are identified by vectors of five elements [t, f ,
ˆ
t,
ˆ
f ,
ˆ
σ], where
t and
ˆ
t represent the location and duration in time; f and
ˆ
f represent the location and width in frequency dimension
in the TF plot; and
ˆ
σ represents the importance of the rect-
angle in the composition of the TF plot. The position and
dimensions of the rectangles are computed from the first and
second moments of the density functions extracted from the
SVs of the TF plot.
The above-mentioned technique is useful for extracting
features of nonstationary signals. However, it has three draw-
backs. Firstly, it uses a fixed number of features (rectangles)
to charac terise the patterns embedded in TF plots. Using a
limited number of rectangles may not be adequate to identify
all possible patterns in the TF plot. Secondly, if there are more
2548 EURASIP Journal on Applied Signal Processing
30
25
20
15
10
5
1234567
Frequency (Hz)
Time (s)
(a)
350
300
250
200
150
100
50
0
12345678910
Bin
Value
(b)
1
0.5
0
−0.5
−1
0 5 10 15 20 25 30
Time (s)
The first right SV
Amplitude
1
0.5
0
−0.5
−1
012345678
Frequency (Hz)
The first left SV
Amplitude
1
0.5
0
−0.5
−1
0 5 10 15 20 25 30
Time (s)
The second right SV
Amplitude
(c)
1
0.5
0
−0.5
−1
012345678
Frequency (Hz)
ThesecondleftSV
Amplitude
(d)
Figure 5: (a) The TFD of x
3
(t)(Fs = 15 Hz, N = 450, time resolution= 5). (b) Its singular values. ((c) and (d)) Its right and left SVs.
than one local maximum in the density function, the first and
second moments of the densit y functions cannot show the
position and the width of the local maxima. Hence, the tech-
nique may work well if (a) the TF patterns are simple enough
to be approximated by a limited number of rectangles, and
(b) the energy density of the signal is not uniformly con-
centrated at various locations of the TF plot. Thirdly, a TF
pattern decomposed into the orthonormal bases, the left and
right SVs, may not be addressed by only one left and right
SVs. In other words, more than one left and right SVs may
be needed to properly approximate a TF pattern. Hence, the
moments extracted from only one left and right SVs are not
enough to find the location, time duration, and frequency
band of the pattern in the TF plot.
In another study [11], the same authors improved the
feature extraction technique with respect to the third flaw.
In this technique, the orthonormal bases created for a TF
plot are rotated in order to minimise the number of vectors
required in linear combinations to approximate the TF pat-
terns.
3.4. TF-based EEG seizure feature extraction
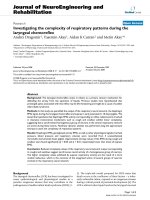
Figure 6 shows the TFDs of two 30-second epochs of new-
born EEG signal exhibiting seizure and nonseizure activities.
The TFD were obtained using the B-distribution with pa-
rameter β = 0.01. The SVD was applied to the TFD matr ices
to compute the left and right SVs. The two first left and right
SVs are shown in Figures 7 and 8.
SVD-Based Time-Frequency Feature Extraction for Newborn EEG Seizure 2549
30
25
20
15
10
5
12345678910
Frequency (Hz)
Time (s)
(a)
30
25
20
15
10
5
12345678910
Frequency (Hz)
Time (s)
(b)
Figure 6: The TFD of two EEG epochs using the B-distribution: (a) seizure activity and (b) nonseizure activity (Fs = 20 Hz, N = 600, time
resolution= 5).
In Figure 7, the first left SV shows that there is a burst of
activity at frequencies around 1 Hz, while the first right SV
points to an activity that emerges 14 seconds after the be-
ginning of the epoch and lasts about 15 seconds. The second
left SV shows that there are high-energy activities around the
frequencies 1.3Hzand1.5 Hz. The second right SV indicates
the presence of an activity that spans the w hole 30-second
epoch. These observations related to the first two SVs cap-
ture the essential information of the EEG seizure contained
in the TF domain.
As shown above, a signal can be characterised by the SVs
of its TFD. In other words, the SVs can be used as discrim-
inating features in the seizure detection process. However, a
reduced feature set with more appropriate features can pro-
vide a better classification accuracy with reduced data anal-
ysis cost [23]. In this paper, we suggest using a feature selec-
tion technique based on the probability distribution function
of the SVs (DFSVs). This technique is described below.
Since the SVs are orthonormal, their squared elements
can be treated as the different values of a PDF. The PDF
can then be used to compute the probability distribution
function.
Let X
tf
represents a T FD matrix of a signal x. Using SVD,
this matrix can be represented as
X
tf
= UΣV
T
,(6)
where U(M × M), Σ (M × N), and V(N × N)arematricesof
left SVs, singular values, and right SVs, respectively. The PDF
can be formed from individual columns of matrices associ-
ated with the left and right SVs. For example, the PDF related
to the first column of matrix U, f
U
1
,isgivenby
f
U
1
=
u
2
11
, u
2
12
, , u
2
1M
,(7)
where u
1i
represents the ith element of U
1
(the first column
of U), and
M
i=1
u
2
1i
= 1. The related probability distribution
function can be obtained as
F
U
1
=
υ
1
, υ
2
, , υ
M
,(8)
where
υ
j
=
j
i=1
u
2
1i
for j = 1toM. (9)
Distribution functions are nondecreasing, and it can be
seen from Figures 9 and 10 that they have no significant
changesinsomeareas.Thisisreflectedinthecorrespond-
ing histograms by few points with significant values. By us-
ing these histograms as features for detection, a considerable
computational time will be gained.
Figures 9 and 10 show the distribution functions ex-
tracted from the first and second SVs associated with seizure
and nonseizure activities shown in Figures 7 and 8,respec-
tively. The histograms extracted from the left SVs show that
for a signal including seizure, except the first and last bins,
the content of the bins is almost zero.
3.5. The feature extraction algorithm
To summarise, the proposed TF-based algorithm for seizure
feature extraction comprises the following steps.
Step 1. Filtering: since only the low-frequency signature of
the seizure is of interest, any activit y higher than 10 Hz is fil-
tered.
Step 2. Segmentation: seg menting the EEG signal into 30-
second epochs without overlapping.
Step 3. Down sampling: reducing the sampling rate from
256, the sampling rate in the recording time, to 20 samples
per second to reduce the computational load. Following the
Nyquist rate, this sampling rate is enough to analyse signals
with frequencies less than 10 Hz. The resample function of
Matlab was used for the down-sampling process.
2550 EURASIP Journal on Applied Signal Processing
0.6
0.4
0.2
0
−0.2
−0.4
−0.6
0246810
Frequency (Hz)
ThefirstleftSV
Amplitude
0.5
0
−0.5
0102030
Time (s)
The first right SV
Amplitude
0.6
0.4
0.2
0
−0.2
−0.4
−0.6
0246810
Frequency (Hz)
ThesecondleftSV
Amplitude
0.5
0
−0.5
0102030
Time (s)
The second right SV
Amplitude
Figure 7: Left and right SVs of the matrix representing Figure 6a (seizure activit y).
0.6
0.4
0.2
0
−0.2
−0.4
−0.6
0246810
Frequency (Hz)
ThefirstleftSV
Amplitude
0.5
0
−0.5
0102030
Time (s)
The first right SV
Amplitude
0.6
0.4
0.2
0
−0.2
−0.4
−0.6
0246810
Frequency (Hz)
ThesecondleftSV
Amplitude
0.5
0
−0.5
0102030
Time (s)
The second right SV
Amplitude
Figure 8: Left and right SVs of the mat rix representing Figure 6b (nonseizure activity).
Step 4. TF representation: the 30-second EEG epoch is
mapped into the TF domain using B-distribution with β =
0.01.
Step 5. Applying SVD: computing left and right SVs of the
matrix related to the TF representation.
Step 6. Extracting distribution functions: since SVs are or-
thonormal, the squared elements of the SVs can be consid-
ered as density functions. The density functions are then used
for computing the distribution functions.
Step 7. Histogram computing: to compute the histogram re-
lated to the distribution function, we have used 11 bins.
Successive bins have discrete elements of the distribution
function with the maximum variation of 0.09. Reducing
the number of bins decreases performance of the system
in differentiating between seizure and nonseizure activities.
SVD-Based Time-Frequency Feature Extraction for Newborn EEG Seizure 2551
1
0.8
0.6
0.4
0.2
0
0246810
Frequency (Hz)
ThefirstleftSV
Distribution functions
120
100
80
60
40
20
0
00.20.40.60.81
Bin
Histograms
1
0.8
0.6
0.4
0.2
0
0102030
Time (s)
The first right SV
Distribution functions
120
100
80
60
40
20
0
00.20.40.60.81
Bin
Histograms
1
0.8
0.6
0.4
0.2
0
0246810
Frequency (Hz)
ThesecondleftSV
Distribution functions
120
100
80
60
40
20
0
00.20.40.60.81
Bin
Histograms
(a)
1
0.8
0.6
0.4
0.2
0
0102030
Time (s)
The second right SV
Distribution functions
120
100
80
60
40
20
0
00.20.40.60.81
Bin
Histograms
(b)
Figure 9: The probability distribution functions and their histograms associated with (a) the left SVs and (b) rig ht SVs of the matrix
representing Figure 6a (seizure activity).
1
0.8
0.6
0.4
0.2
0
0246810
Frequency (Hz)
ThefirstleftSV
Distribution functions
120
100
80
60
40
20
0
00.20.40.60.81
Bin
Histograms
1
0.8
0.6
0.4
0.2
0
0102030
Time (s)
The first right SV
Distribution functions
120
100
80
60
40
20
0
00.20.40.60.81
Bin
Histograms
1
0.8
0.6
0.4
0.2
0
0246810
Frequency (Hz)
ThesecondleftSV
Distribution functions
120
100
80
60
40
20
0
00.20.40.60.81
Bin
Histograms
(a)
1
0.8
0.6
0.4
0.2
0
0102030
Time (s)
The second right SV
Distribution functions
120
100
80
60
40
20
0
00.20.40.60.81
Bin
Histograms
(b)
Figure 10: The probability distribution functions and their histograms associated with (a) the left SVs and (b) right SVs of the matrix
representing Figure 6b (nonseizure activity).
However, this number of bins was found to be adequate for
30-second epoch seizure detection.
4. EEG SEIZURE DETECTION
To discriminate between seizure and nonseizure act ivities in
newborn EEG signals, we have used two left and two right
SVs related to the TFD of the 30-second EEG epoch. Ex-
periments showed that using these vectors achieves good re-
sults. The feature extracted through the histogram of the
four SVs was reorganised into a feature vector to be fed to
a neural network. As the individual histograms have 11 bins,
the length of the feature vector fed to neural network was
44.
2552 EURASIP Journal on Applied Signal Processing
The neural network used in this research was a feed-
forward network. Networks with both one and two hidden
layers using different neurons (2 to 15 neurons) in each of the
hidden layers were studied. A two-layer neural network with
44, 8, and 2 neurons, respectively, in the input, hidden, and
output layers offered the best detection rate. The network was
then supervisely trained using the Levenberg-Marquardt al-
gorithm [24].
4.1. Experimental results and performance
comparison
In order to assess the performance of the above technique,
the EEG data of eight newborns have been used. Firstly,
we made a database of 30-second epochs associated with
seizure and nonseizure activities. Seizure activities in the
seizure epochs may have durations less than 30 seconds. The
database includes 300 seizures and 800 nonseizures. To train
the neural network, 200 seizures and 200 nonseizures were
randomly selected and applied to the neural network. The
training process learned the seizure and nonseizure patterns
after 800 training iterations. The trained neural network was
tested using the remaining EEG data and resulted in about
90% and 5.7% good detect ion rate (GDR)and false detection
rate (FDR), respectively. The GDR and FDR are defined as
GDR
= 100 ×
GD
R
%, FDR = 100 ×
FD
GD+FD
%, (10)
where GD and FD are the total number of good and false
detections, respectively, and R represents the total number
of seizures recognised by the neurologist. A good detection
occurs if the detected EEG epoch matches the epoch labeled
as a seizure by the neurologist.
The performance of the proposed seizure detection
method is compared with three other methods, namely,
autocorrelation, spectrum, and singular spectrum analysis
(SSA) techniques. These techniques are briefly described in
the following sec tions.
4.2. The autocorrelation technique
The autocorrelation-based technique proposed by Liu et al.
[25] relies on the assumption that the essential characteristic
in newborn EEG seizures is periodicity. To asses the amount
of periodicity, the EEG data is segmented into 30-second
epochs and each epoch is divided into 5 windows. Depend-
ing on the autocorrelation function of a window, up to four
primary periods are calculated for each window in an epoch.
The windows are then scored whereby more evenly spaced
primary periods are allocated larger scores. After each win-
dow in an epoch is scored, a rule-based detection scheme
is applied to classify each epoch as seizure positive or neg-
ative. If two or more channels of EEG data in the same epoch
are seizure positive, the epoch is then classified as containing
seizure activity.
4.3. The spectrum technique
The method introduced by Gotman et al. was mainly based
on the spectrum analysis of short epochs of EEG data
[26, 27]. In this technique, to detect seizure activities, the
EEG data is seg mented into 10-second epochs using a slid-
ing w indow. The window is moved along the EEG in 2.5-
second steps. The algorithm was designed to extract features
from each epoch and compare them with those of the back-
ground. The background is defined as a 20-second segment
of EEG finishing 60 seconds before the start of the current
epoch. The main advantage of using a constantly updated
background is that results are not dependent on the specific
features of a fixed epoch.
The frequency spectrum of the individual epochs is cal-
culated and the following features are extracted: (1) the fre-
quency of the dominant spectral peak, (2) the width of the
dominant spectral peak, and (3) the ratio of the power in the
dominant spectral peak to that of the background spectrum
in the same frequency band.
The three features are used in detecting seizures in each
epoch. If an epoch is recognised as containing seizure, a fur-
ther three criteria are employed to reduce the rate of false de-
tections. Detected seizures are ignored if the epoch is largely
nonstationary, if there is a large amount of AC power noise
present, or if it appears that an EEG lead has been discon-
nected.
The aim of this technique is to determine whether a dom-
inant peak exists in the power spectral density estimate. This
is equivalent to finding whether an EEG signal has a domi-
nant periodic shape in the time domain. The features used to
classify an epoch as a seizure ensure that the dominant peak
of the spectrum is significant compared with the background
spectrum.
4.4. The SSA technique
Celka et al [7] proposed a method for newborn EEG seizure
detection using SSA. The SSA method is suited for extrac t-
ing information from stationary or at least quasistationary
signals cluttered with noise.
In this method, to detect seizure activity in EEG data,
the signal is preprocessed. The preprocessing is based on
a nonlinear whitening filter that spreads the spectrum of
the background while keeping rhythmical features of the
seizure activities. The filtered signal is then segmented into
10-second epochs using sliding window with 1.25-second
steps. The individual epochs are converted into a matrix
for separating the noise subspace from the signal subspace.
The signal subspace is obtained by using n
0
SVs related
to the n
0
largest singular values of the matrix using the
SVD technique. To find n
0
, as a criterion for space divi-
sion, they used the Rissanen minimum description length
(MDL) method. In this technique, if n
0
is equal to 1, the re-
lated epoch is considered as a background; otherwise, it is a
seizure.
4.5. Performance comparison and discussion
The performance assessment of the above-mentioned meth-
ods was accomplished by applying their algorithms to all the
EEG channels of each newborn. In using the DFSV tech-
nique, the EEG epoch is considered to contain a seizure in
SVD-Based Time-Frequency Feature Extraction for Newborn EEG Seizure 2553
Table 1: Performance comparison of the DFSV with the three other methods.
Patients
Autocorrelation Spectral SSA DFSV
GDR FDR GDR FDR GDR FDR GDR FDR
Baby 1 50% 11% 44% 14% 50% 19% 66% 9%
Baby 2 32% 7.5% 47% 0 97% 2% 98% 2%
Baby 3 95% 37 % 85% 36% 99% 35% 95% 15%
Baby 4
31% 0 0 0 91% 0 96% 0
Baby 5 67% 1 % 78% 1% 98% 1% 99% 1%
Baby 6 29% 9 % 0 0 87% 0 92% 0
Baby 7 72% 3 % 33% 0 97% 2% 95% 2%
Baby 8 77% 1 % 67% 0 97% 1% 99% 1%
Average 56.6% 8.6 % 44.2% 6.3% 89.5% 7.5% 92.5% 3.7%
a given time interval if the algorithm detects a seizure in
one or more channels in that specific interval. The perfor-
mance results are summarised in Table 1. The results show
that the DFSV technique has the overall better performance
than the other techniques in terms of the GDR and FDR.
For Baby 3, although the DFSV has 4% lower GDR than
the SSA, its FDR is remarkably lower than all the other
tested techniques. The GDRs of all four techniques for Baby
1 are considerably lower than those of the other babies.
The reason could be the lack of low-frequency signature
of seizures as all of the techniques are based on the low-
frequency signatures. In such case, EEG seizures can be de-
tected using the high-frequency signature as mentioned in
[28].
5. CONCLUSIONS
This paper presents a new TF-based technique for detect-
ing seizure activity in the EEG signal of neonates. The de-
tection process uses the low-frequency signature of seizures.
To detect EEG seizure, the signal is segmented into 30-second
epochs and analysed using the SVs of the TFD of the signal.
Histograms extracted from the distribution function formed
from the squared-elements of the left and right SVs were
shown to efficiently discriminate between the seizure and
nonseizure activities as evidenced by the high detection rates.
The GDR resulted from applying the untrained data set to
the neural network shows the good quality of the extracted
feature.
This technique is based on low-frequency signature
of the seizures. In a related work, we have shown that
some types of seizures may have only signatures in high-
frequency area. This fact may potentially result in a re-
duction of the seizure detection rate. To overcome this
problem, the authors proposed a new technique based on
high-frequency seizure signature and are working toward a
method that can effectively combine the detectors based on
those types of signatures. The results of the work will appear
elsewhere.
ACKNOWLEDGMENTS
This research is funded by the Australian Research Council
(ARC). The authors wish to thank Professor Paul Colditz of
the Royal Women’s Hospital in Brisbane for providing access
to the Perinatal Research Centre and Dr. Chris Burke of the
Royal Children’s Hospital in Brisbane for his assistance in the
interpretation of the EEG data.
REFERENCES
[1] E. M. Mizrahi and P. Kellaway, “Neonatal electrocephalogra-
phy,” in Diagnosis and Management of Neonatal Seizures,pp.
99–143, Lippincott-Raven, Philadelphia, Pa, USA, 1998.
[2] P. L. Paige and P. R. Carney, “Neurologic disorders,” in
Handbook of Neonatal Intensive Care, chapter 25, pp. 644–678,
Mosby, St. Louis, Mo, USA, 2002.
[3] C. T. Lombroso, “Neonatal EEG polygraphy in normal and
abnormal newborns,” in Elect roencephalography. Basic Princi-
ples, Clinical Applications and Related Fields,E.Niedermeyer
and F. H. Lopes da Silva, Eds., chapter 48, pp. 803–875,
Williams and Wilkins, Baltimore, Md, USA, 1993.
[4] E. M. Mizrahi, P. Plouin, and P. Kellaway, “Neonatal seizures,”
in Epilepsy: A Comprehensive Textbook,J.EngelandT.A.Ped-
ley, Eds., vol. 1, chapter 57, pp. 647–663, Lippincott–Raven,
Philadelphia, Pa, USA, 1997.
[5] P. Celka and P. Colditz, “Nonlinear nonstationary wiener
model of infant EEG seizures,” IEEE Transactions on Biomed-
ical Engineering, vol. 49, no. 6, pp. 556–564, 2002.
[6] B. Boashash, H. Carson, and M. Mesbah, “Detection of
seizures in newborns using time-frequency analysis of EEG
signal,” in Proc. 10th IEEE Workshop on Statistical Signal and
Array Processing, pp. 564–568, Pocono Manor, Pa, USA, Au-
gust 2000.
[7] P. Celka and P. Colditz, “A computer-aided detection of EEG
seizures in infants: a singular-spectrum approach and perfor-
mance comparison,” IEEE Transactions on Biomedical Engi-
neering, vol. 49, no. 5, pp. 455–462, 2002.
[8] B. Boashash and M. Mesbah, “A time-frequency approach for
newborn seizure detection,” IEEE of EMBS Magazine, vol. 20,
no. 5, pp. 54–64, 2001.
[9] H. Hassanpour, W. J. Williams, M. Mesbah, and B. Boashash,
“Time-frequency extraction of EEG spike events for seizure
detection in neonate,” in Proc. 6th International Symposium
on Signal Processing and Its Application (ISSPA ’01), vol. 1, pp.
246–249, Kuala Lumpur, Malaysia, August 2001.
2554 EURASIP Journal on Applied Signal Processing
[10] G. Nakos and D. Joyner, Linear Algebra with Applications,
Brooks/Cole Publishing Company, Pacific Grove, Calif, USA,
1998.
[11] D. Groutage and D. Bennink, “A new mat rix decomposi-
tion based on optimum transformation of the singular value
decomposition basis sets yields pr incipal features of time-
frequency distributions,” in Proc. 10th IEEE Workshop on
Statistical Signal and Array Processing, pp. 598–602, Pocono
Manor, Pa , USA, August 2000.
[12] L. Cohen, “The need for time-freaquency analysis,” in
Time-Frequency Analysis, Prentice Hall Signal Processing Se-
ries, chapter 5, pp. 70–81, Prentice-Hall, Englewood Cliffs, NJ,
USA, 1995.
[13] S. S. Abeysekera and B. Boashash, “Methods of signal classifi-
cation using the images produced by the Wigner-Ville distri-
bution,” Pattern Recognition Letters, vol. 12, no. 11, pp. 717–
729, 1991.
[14] B. Boashash, “Part I: Introduction to the concepts of TFSAP,”
in Time-Frequency Signal Analysis and Processing: A Compre-
hensive Reference, pp. 1–81, Elsevier, Oxford, UK, 2003.
[15] B. Boashash and B. Barkat, “Introduction to time-frequency
signal analysis,” in Wavelet Transforms and Time-Frequency
Signal Analysis, L. D ebnath, Ed., pp. 321–380, Birkh
¨
auser,
Boston, Mass, USA, 2000.
[16] W. J. Williams, “Reduced interference time-frequency distri-
butions,” in Time-Frequency Signal Analysis and Processing:
AComprehensiveReference, B. Boashash, Ed., chapter 5, pp.
168–177, Elsevier, Oxford, UK, 2003.
[17] B. Barkat and B. Boashash, “A high-resolution quadratic time-
frequency distribution for multicomponent signals a nalysis,”
IEEE Trans. Signal Processing, vol. 49, no. 10, pp. 2232–2239,
2001.
[18] N. M. Marinovic and G. Eichmann, “Feature extraction and
pattern classification in space-spatial frequency domain,” in
SPIE Intelligent Robots and Computer Vision, vol. 579 of Pro-
ceedings of SPIE, pp. 19–25, September 1985.
[19] S. Gu, J. Ni, and J. Yuan, “Non-stationary signal analysis and
transient machining process condition monitoring,” Interna-
tional Journal of Machine Tools and Manufacture, vol. 42, no.
1, pp. 41–51, 2002.
[20] D. Groutage and D. Bennink, “Feature sets for nonstationary
signals derived from moments of the singular value decom-
position of Cohen-Posch ( positive time-frequency) distribu-
tions,” IEEE Trans. Signal Processing, vol. 48, no. 5, pp. 1498–
1503, 2000.
[21] V. Venkatachalam and J. L. Aravena, “Nonstationary signal
classification using pseudo power signatures: The matrix SVD
approach,” IEEE Trans. on Circuits and Systems II: Analog and
Digital Signal Processing, vol. 46, no. 12, pp. 1497–1505, 1999.
[22] D. Bernal, “Damage localization using load vectors,” in Euro-
pean COST F3 Conference, pp. 223–231, Madrid, Spain, June
2000.
[23] A. Jain and D. Zongker, “Feature selection: evaluation, ap-
plication, and small sample performance,” IEEE Trans. on
Pattern Analysis and Machine Intelligence, vol. 19, no. 2, pp.
153–158, 1997.
[24] G. Lera and M. Pinzolas, “Neighborhood based Levenberg-
Marquardt algorithm for neural network training,” IEEE
Transactions on Neural Networks, vol. 13, no. 5, pp. 1200–
1203, 2002.
[25] A. Liu, J. S. Hahn, G. P. Heldt, and R. W. Coen, “Detection of
neonatal seizures through computerized EEG analysis,” Elec-
troencephalography and Clinical Neurophysiolog y, vol. 82, no.
1, pp. 30–37, 1992.
[26] J. Gotman, D. Flanagan, J. Zhang, and B. Rosenblatt, “Auto-
matic seizure detection in the newborn: methods and initial
evaluation,” Electroencephalography and Clinical Neurophysi-
ology, vol. 103, no. 3, pp. 356–362, 1997.
[27] J. Gotman, J. Zhang, B. Rosenblatt, and R. Gottesman, “Auto-
matic seizure detection in newborns and infants,” in Proc.
IEEE 17th Annual Conference on Engineering in Medicine
and Biology Society, vol. 2, pp. 913–914, Montreal, Quebec,
Canada, September 1995.
[28] H. Hassanpour and M. Mesbah, “Neonatal EEG seizure de-
tection using spike signatures in the time-frequency domain,”
in Proc. International Symposium on Signal Processing and Its
Application (ISSPA ’03), vol. 2, pp. 41–44, Paris, France, July
2003.
Hamid Hassanpour received the B.S. de-
gree in computer engineering from Iran
University of Science & Technology, Tehran,
Iran, in 1994, the M.S. degree in com-
puter engineering from Amirkabir Univer-
sity of Technology, Tehran, Iran, in 1997,
and the Ph.D. degree in signal processing
from Queensland University of Technology,
Brisbane, Australia. His research interests
include signal detection and classification,
biomedical signal processing, and time-frequency signal analysis.
Mostefa Mesbah received his M.S. and
Ph.D. degrees in electrical engineering from
University of Colorado at Boulder, Col-
orado, USA, in the area of automatic con-
trol systems. He is currently a Senior Re-
searcher at the Signal Processing Research
Centre (SPRC), Queensland University of
Technology in Brisbane, Australia, leading
a biomedical engineering project that deals
with the automatic detection and classifi-
cation of newborn EEG seizures. His research interests include
biomedical signal processing, time-frequency signal processing,
signal detection and classification, 3D shape reconstruction from
image sequences, and intelligent control systems.
Boualem Boashash obtained a Diplome
d’ingenieur-Physique-Electronique from
Institut de Chimie et de Physique Indus-
trielles de Lyon (ICPI), University of Lyon,
France, in 1978, the M.S. and Doctorate
(Docteur-Ingenieur) degrees from the In-
stitut National Polytechnique de Grenoble,
France, in 1979 and 1982, respectively. In
1979, he joined Elf-Aquitaine Geophysical
Research Centre, Pau, France. In May
1982, he joined the Institut National des Sciences Appliqu
´
ees
de Lyon, France. In 1984, he joined the Electrical Engineering
Department, University of Queensland, Australia, as a Lecturer.
In 1990, he joined Graduate School of Science and Technology,
Bond University, as a Professor of electronics. In 1991, he joined
Queensland University of Technology as the foundation Professor
of signal processing and Director of the Signal Processing Research
Centre. B. Boashash is the Editor of three books and has written
over four hundred technical publications. His research interests
include time-frequency signal analysis, spectral estimation, signal
detection and classification, and higher-order spectra. Professor
Boashash is a Fellow of Engineers Australia, Fellow of IREE, and
Fellow of IEEE.