Báo cáo hóa học: " A Maximum Likelihood Approach to Least Absolute Deviation Regression" potx
Bạn đang xem bản rút gọn của tài liệu. Xem và tải ngay bản đầy đủ của tài liệu tại đây (726.48 KB, 8 trang )
EURASIP Journal on Applied Signal Processing 2004:12, 1762–1769
c
2004 Hindawi Publishing Corporation
A Maximum Likelihood Approach to Least Absolute
Deviation Regression
Yinbo Li
Department of Electrical and Computer Engineering, University of Delaware, Newark, DE 19716 3130, USA
Email:
Gonzalo R. Arce
Department of Electrical and Computer Engineering, University of Delaware, Newark, DE 19716 3130, USA
Email:
Received 7 October 2003; Revise d 22 December 2003
Least absolute deviation (LAD) regression is an important tool used in numerous applications throughout science and engineer-
ing, mainly due to the intrinsic robust characteristics of LAD. In this paper, we show that the optimization needed to solve the
LAD regression problem can be viewed as a sequence of maximum likelihood estimates (MLE) of location. The derived algorithm
reduces to an iterative procedure where a simple coordinate transformation is applied during each iteration to direct the opti-
mization procedure along edge lines of the cost surface, followed by an MLE of location which is executed by a weighted median
operation. Requiring weighted medians only, the new algorithm can be easily modularized for hardware implementation, as op-
posed to most of the other existing LAD methods which require complicated operations such as matrix entry manipulations. One
exception is Wesolowsky’s direct descent algorithm, which among the top algorithms is also based on weighted median operations.
Simulation shows that the new algorithm is superior in speed to Wesolowsky’s algorithm, which is simple in structure as well. The
new algorithm provides a better tradeoff solution between convergence speed and implementation complexity.
Keywords and phrases: least absolute deviation, linear regression, maximum likelihood estimation, weighted median filters.
1. INTRODUCTION
Linear regression has long been dominated by least squares
(LS) techniques, mostly due to their elegant theoretical foun-
dation and ease of implementation. The assumption in this
method is that the model has normally distributed errors.
In many applications, however, heavier-than-Gaussian tailed
distributions may be encountered, where outliers in the mea-
surements may easily ruin the estimates [1]. To address this
problem, robust regression methods have been developed so
as to mitigate the influence of outliers. Among all the ap-
proaches to robust regression, the least absolute deviations
(LADs) method, or L
1
-norm, is considered conceptually the
simplest one since it does not require a “tuning” mechanism
like most of other robust regression procedures. As a result,
LAD regression has drawn significant attentions in statistics,
finance, engineering, and other applied sciences as detailed
in a series of studies on L
1
-norm methods [2, 3, 4, 5]. LAD
regression is based on the assumption that the model has
Laplacian distributed errors. Unlike the LS approach though,
LAD regression has no closed-form solution, hence numeri-
calanditerativealgorithmsmustberesortedto.
Surprisingly to many, the LAD regression method first
suggested by Boscovich (1757) and studied by Laplace (1793)
predated the LS technique originally developed by Legen-
dre (1805) and Gauss (1823) [1, 2]. It was not until nearly
a century later that Edgeworth [6]proposedageneralnu-
merical method to solve the unconstrained LAD problem,
where the weighted median was int roduced as the basic op-
eration in each iteration. Edgeworth’s method, however, suf-
fers from cycling when data has degeneracies [7]. A break-
through came in the 1950’s when Harris [8] brought in the
notion that linear programming techniques could be used
to solve the LAD regression, and Char nes et al. [9]actually
utilized the simplex method to minimize the LAD objective
function. Many simplex-like methods blossomed thereafter,
among which Barrodale and Roberts [10]andArmstrong
et al. [11] are the most representative ones. Other efficient
approaches include the active set method by Bloomfield and
Steiger [12], the direct decent algorithm by Wesolowsky [13],
and the interior point method proposed by Zhang [14]. More
historical background about LAD estimate can be found in
[2].
A Maximum Likelihood Approach to LAD Regression 1763
The simple LAD regression problem is formulated as fol-
lows. Consider N observation pairs (X
i
, Y
i
)modelledina
linear fashion
Y
i
= aX
i
+ b + U
i
, i = 1, 2, , N,(1)
where a is the unknown slope of the fitting line, b the in-
tercept, and U
i
areunobservableerrorsdrawnfromaran-
dom variable U obeying a zero-mean Laplacian distribution
f (U) = (1/2λ)e
−|U|/λ
with variance σ
2
= 2λ
2
.TheLADre-
gression is found by choosing a pair of parameters a and b
that minimizes the objective function
F(a, b) =
N
i=1
Y
i
− aX
i
− b
,(2)
which has long been known to be continuous and convex [1].
Moreover, the cost surface is of a polyhedron shape, and its
edge lines are characterized by the sample pairs (X
i
, Y
i
).
Notably, the minimization of the LAD cost function (2)is
closely related to the location estimation problem defined as
follows. Let the random variable V be defined as V = U + µ,
where µ is an unknown constant location and U obeys the
Laplacian distribution. The maximum likelihood estimate
(MLE) of location on the sample set {V
i
|
N
i=1
} is
µ
∗
= arg min
µ
N
i=1
V
i
− µ
. (3)
The solution to the above minimization problem is well
known to be the sample Median
µ
∗
= MED
V
i
N
i=1
. (4)
The striking similarity between (2)and(3) infers that, for
afixeda
= a
0
, the minimizer of (2), say b
∗
a
0
, is essentially
an MLE for location under the Laplacian assumption. For
reasons that will be explained shor t ly in Section 2, the mini-
mizer of (2) a
∗
b
0
,givenb = b
0
, is also an MLE for location un-
der the Laplacian assumption with certain extensions. Thus,
a very intuitive way of solving the LAD regression problem
can be constructed as a “seesaw” procedure: first, hold one
of the parameters a or b constant, optimize the other us-
ing the MLE concept, then alternate the role of the parame-
ters, and repeat this process until both parameters converge.
It will soon be shown in the paper that this method suffers
from some intrinsic limitations that often leads to nonglobal
optimal solutions despite its attractive simplicity. However,
further inspection on this initial algorithm reveals that, with
some specific guidance on how to do the MLE optimiza-
tion and one simple coordinate transformation, a similar but
more accurate algorithm can be formulated where the global
optimum can be reached. In fact, in this paper, we derive
a fast iterative solution where the concept of ML is applied
jointly with coordinate transformations. It is also shown that
the proposed method is comparable with the best algorithms
used to date in terms of computational complexity, and has a
greater potential to be implemented in hardware.
2. ALGORITHM DERIVATION
2.1. Basic understanding
Consider the linear regression model in (1). If the value of
a is fixed at first, say a = a
0
, the objective function (2)now
becomes a one-parameter function of b:
F(b) =
N
i=1
Y
i
− a
0
X
i
− b
. (5)
Assuming a Laplace distribution for the errors U
i
, the above
cost function reduces to an ML estimator of location for b.
That is, we observe the sequence of random samples {Y
i
−
a
0
X
i
}, and the goal is to estimate the fixed but unknown lo-
cation parameter b. Thus according to (4), the parameter b
∗
in this case can be obtained by
b
∗
= MED
Y
i
− a
0
X
i
N
i=1
. (6)
If, on the other hand, we fix b = b
0
, the objective function
reduces to
F(a) =
N
i=1
Y
i
− b
0
− aX
i
=
N
i=1
X
i
Y
i
− b
0
X
i
− a
.
(7)
Again, if the error random variable U
i
obeys a Laplacian
distribution, the observed samples {(Y
i
− b
0
)/X
i
} are also
Laplacian distributed, but with the difference that each sam-
ple in this set has different variance. The reason is obvious
since for each known X
i
and zero-mean U
i
, U
i
/X
i
remains a
zero-mean Laplacian with var iance scaled by 1/X
2
i
. Thus the
parameter a
∗
minimizing the cost function (7) can still be
seen as the ML estimator of location for a, and can be calcu-
lated out as the weighted median
a
∗
= MED
X
i
Y
i
− b
0
X
i
N
i=1
,(8)
where is the replication operator. For a positive inte-
ger |X
i
|, |X
i
|Y
i
means Y
i
is replicated |X
i
| times. When
the weights |X
i
| are not integers, the computation of the
weighted median is outlined in the appendix.
A simple and intuitive approach to the LAD regression
problem is through the following iterative algorithm.
(1) Set k = 0. Find an initial value a
0
for a, such as the LS
solution.
(2) Set k = k + 1 and obtain a new estimate of b for a fixed
a
k−1
using
b
k
= MED
Y
i
− a
k−1
X
i
N
i=1
. (9)
(3) Obtain a new estimate of a for a fixed b
k
using
a
k
= MED
X
i
Y
i
− b
k
X
i
N
i=1
. (10)
(4) Once a
k
and b
k
do not deviate from a
k−1
and b
k−1
within a tolerance range, end the iteration. Otherwise,
go back to step (2).
1764 EURASIP Journal on Applied Signal Processing
10
5
0
−5
−2 −10 1 2
(X
1
, Y
1
)
b
∗
(X
5
, Y
5
)
a
∗
X
Y
(a)
10
5
0
−5
−10
−10 −5
0
510
−X
1
(a
∗
, b
∗
)
−X
5
a
b
(b)
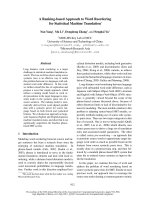
Figure 1: Illustration of (a) the sample space and (b) the parameter space in the simple linear regression problem. The circles in (a) represent
the samples; the dot in (b) represents the global minimum.
Since the median and weig hted median oper ations are both
ML location estimators under the least absolute criterion, the
cost functions will be nonincreasing throughout the iterative
procedure, that is,
F
a
k−1
, b
k−1
≥ F
a
k−1
, b
k
≥ F
a
k
, b
k
. (11)
The algorithm then converges iteratively. Since the objective
function F(a, b) is continuous and convex, one may readily
conclude that the algorithm converges to the global mini-
mum. However, careful inspection reveals that there are cases
where the algorithm does not reach the global minimum. To
see this, it is important to describe the relationship between
the sample space and the parameter space.
As shown in Figure 1, the two spaces are dual to each
other. In the sample space (Figure 1a), each sample pair
(X
i
, Y
i
) represents a point on the plane. The solution to the
problem (1), namely (a
∗
, b
∗
), is represented as a line with
slope a
∗
and intercept b
∗
. If this line goes through some sam-
ple pair (X
i
, Y
i
), then the equation Y
i
= a
∗
X
i
+ b
∗
is satis-
fied. On the other hand, in the parameter space (Figure 1b),
(a
∗
, b
∗
) is a point on the plane, and (−X
i
, Y
i
)representsa
line with slope (−X
i
) and intercept Y
i
. When b
∗
= (−X
i
)a
∗
+
Y
i
holds, it can be inferred that the point (a
∗
, b
∗
)ison
the line defined by (−X
i
, Y
i
). As can be seen in Figure 1,
the line going through (X
1
, Y
1
)and(X
5
, Y
5
) in the sample
space has a slope a
∗
and an intercept b
∗
, but in the pa-
rameter space, it is represented as a point which is the in-
tersection of two lines with slopes (−X
1
)and(−X
5
), respec-
tively. The sample set used to generate Figure 1 is, in a (X
i
, Y
i
)
manner, [(−1.4, −0.4), (0.6, 8.3), (1.2, 0.5), (−0.7, −0.9),
(0.8, 2.6)].
80
70
60
50
40
30
20
10
0
−10
−8
−6
−4
−2
0
2
4
6
8
10
−10
−5
0
5
10
Cost
a
b
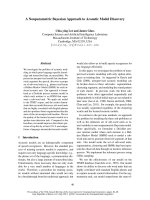
Figure 2: The cost surface of the LAD regression problem. The dot
at an intersection on the a-b plane represents the global minimum.
To better illustrate the inner topology of the function, the half sur-
face that is towards the viewers is cut off.
The structure of the objective function F(a, b)iswellde-
fined as a polyhedron sitting on top of the a-b plane, as seen
in Figure 2. The projections of the polyhedron edges onto the
plane are exactly the lines defined by sample pairs (X
i
, Y
i
),
which is why the term “edge line” is used. In other words,
every sample pair (X
i
, Y
i
) has a corresponding edge line in
the parameter space. Moreover, the projections of the poly-
hedron corners are those locations on the a-b plane, where
two or more of the edge lines intersect. Most importantly,
the minimum of this convex, linearly-segmented error sur-
face occurs at one of these corners.
A Maximum Likelihood Approach to LAD Regression 1765
8
4
0
−4
036
a
b
(a)
4
2
0
−2
−20
a
2
b
(b)
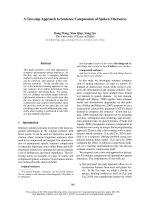
Figure 3: The parameters’ trajectories during the iterations. Vertical dashed lines represent b updates, while horizontal dotted lines represent
a updates; (a) zigzag case, (b) nonoptimal case. The marked dots represent the g lobal minima. To better illustrate, the initial values for a and
b are not set from the LS solution.
To describe the dynamics of this simple iterative method,
consider Step (2) in the procedure, where a new estimate b
k
is
calculated based on a fixed, previously obtained a
k−1
through
a median operation. Since the median is of selection type, its
output is always one of the inputs. Without loss of general-
ity, assume b
k
= Y
j
− a
k−1
X
j
, which means that the newly
estimated parameter pair (a
k−1
, b
k
) is on the edge line de-
fined by (−X
j
)andY
j
. Thus, the geometrical interpretation
of Step (2) can be derived as fol lows: draw a vertical line at
a = a
k−1
in the par ameter space and mark all the intersec-
tions of this line with N edge lines.
1
The intersection on the
edge line defined by (−X
j
)andY
j
is vertically the median
of all; thus its b-coordinate value is accepted as b
k
, the new
update for b. Similar interpretation can be made for Step (3),
except that the chosen intersection is a weighted median out-
put, and there may b e some edge lines parallel to the a-axis.
The drawback of this algorithm is that the convergence
dynamics depends on the geometry of the edge lines in
the parameter space. As can be seen in Figure 3a, the it-
eration is carried on between edge lines in an inefficient
zigzag manner, needing infinite steps to converge to the
global minimum. Moreover, as illustrated in Figure 3b,it
is possible that vertical optimization and horizontal op-
timization on the edge lines can both give the same re-
sults in each iteration. Thus the algorithm gets stuck in a
nonoptimal solution. The sample set used for Figure 3a is
[(−0.1, −3.2), (−0.9, −2.2), (0.4, 5.7), (−2.4, −2.1), (−0.4,
−1.0)], and the initial values for a and b are 5 and
6. The sample set used for Figure 3b is [(0.3, −1.0),
1
Since all meaningful samples are finite, no edge lines will be parallel to
the b-axis; hence there must be N intersections.
(−0.4, −0.1), (−2.0, −2.9), (−0.9, −2.4), (−1.1, 2.2)], and
the initial values for a and b are −1 and 3.5.
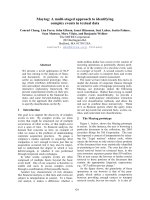
2.2. New algorithm
To overcome these limitations, the iterative algorithm must
be modified exploiting the fact that the optimal solution is
at an intersection of edge lines. Thus, if the search is di-
rected along the edge lines, then a more accurate and more
efficient algorithm can be formulated. The approach pro-
posed in this paper is through coordinates transformation.
The basic idea is as follows. In the parameter space, if the
coordinates are transformed so that the edge line contain-
ing the previous estimate (a
k−1
, b
k−1
) is parallel to the a
-axis
at height b
k−1
, then the horizontal optimization based upon
b
k−1
is essentially an optimization along this edge line. The
resultant (a
k
, b
k
) will be one of the intersections that this line
has with all other edge lines, thus avoiding possible zigzag
dynamics during the iterations. Transforming the obtained
parameter pair back to the original coordinates results in
(a
k
, b
k
). This is illustrated in Figure 4. The only requirement
for this method is that the shape of the cost surf ace must be
preserved upon transformation; thus the same optimization
result can be achieved. Notice that, if an edge line is horizon-
tal, its slope (−X
j
) has to be 0. We will show shortly that a
simple shifting in the sample space can satisfy the require-
ment.
The following is the proposed algorithm for LAD regres-
sion.
(1) Set k = 0. Initialize b to be b
0
using the LS solution
b
0
=
N
i=1
X
i
−
¯
X
¯
YX
i
−
¯
XY
i
N
i=1
X
i
−
¯
X
2
. (12)
1766 EURASIP Journal on Applied Signal Processing
3
0
−3
11.52
a
b
(a
K−1
, b
k−1
)
(a
K
, b
k
)
(a)
5
2
−1
11.52
a
b
(a
K−1
, b
k−1
)
(a
K
, b
k
)
(b)
Figure 4: Illustration of one iteration. The previous estimate (a
k−1
, b
k−1
) is mapped into the transformed coordinates as (a
k−1
, b
k−1
); (a
k
, b
k
)
is obtained through ML estimation in the transformed coordinates; the new estimate (a
k
, b
k
) is formed by mapping (a
k
, b
k
) back into the
original coordinates. The sample set is [(1.6, 2.8), (−1.4, −3.8), (1.2, 3.5), (−4.3, −4.7), (−1.8, −2.2)].
Calculate a
0
by a weighted median
a
0
= MED
X
i
Y
i
− b
0
X
i
N
i=1
. (13)
Keep the index j which satisfies a
0
= (Y
j
− b
0
)/X
j
.In
the parameter space, (a
0
, b
0
) is on the edge line with
slope (−X
j
) and intercept Y
j
.
(2) Set k = k + 1. In the sample space, right shift the co-
ordinates by X
j
so that the newly formed y
-axis goes
through the original (X
j
, Y
j
). The transformations in
the sample space are
X
i
= X
i
− X
j
, Y
i
= Y
i
, (14)
and the transformations in the parameter space are
a
k−1
= a
k−1
, b
k
= b
k−1
= b
k−1
+ a
k−1
X
j
. (15)
The shifted sample space (X
, Y
) corresponds to a new
parameter space (a
, b
), where (−X
j
, Y
j
)representsa
horizontal line.
(3) Performaweightedmediantogetanewestimateofa
:
a
k
= MED
X
i
Y
i
− b
k
X
i
N
i=1
. (16)
Keep the new index t which gives a
k
= (Y
t
− b
k
)/X
t
.
(4) Transform back to the original coordinates
a
k
= a
k
, b
k
= b
k
− a
k
X
j
. (17)
(5) Set j
= t.Ifa
k
is identical to a
k−1
within the tolerance,
end the program. Otherwise, go back to step (2).
It is simple to verify that the transformed cost function is the
same as the original one using the relations in (14)and(15).
For fixed b
k
,
F
(a
) =
N
i=1
Y
i
− a
X
i
− b
k
=
N
i=1
Y
i
− a
X
i
− X
j
−
aX
j
+ b
k
=
N
i=1
Y
i
− aX
i
− b
k
=
F(a).
(18)
This relationship guarantees that the new update in each it-
eration is c orrect.
3. SIMULATIONS
The major part of the computational power of the proposed
algorithm is consumed in the weighted median operation at
each iteration. Essentially, it is a sorting problem, which, for
n samples, is in the order of n log n.Fortunately,forthispar-
ticular application, some speed-up can be achieved by not
doing a full sorting every time. In [13], where the weighted
median is also used as the kernel operation, a shortcut to cir-
cumvent this time-consuming full-sorting procedure is de-
veloped. The basic idea is the previous estimate can be con-
sidered close enough to the true value, thus “fine tuning” can
be executed around this point by making use of the weighted
median inequalities shown next in (21).
A Maximum Likelihood Approach to LAD Regression 1767
Consider a weighted median defined as follows:
a
∗
= MED
W
i
Z
i
n
i=1
= arg min
a
N
i=1
W
i
Z
i
− a
,
(19)
where the weights W
i
≥ 0. If we order the samples Z
i
as
Z
(1)
≤ Z
(2)
≤···≤Z
(N)
, then the weight associated with the
ith order statistic Z
(i)
is often referred to as the concomitant
W
[i]
[15]. In this way, the weighted median a
∗
can always
be identified as Z
( j)
whose index j satisfies the following in-
equalities:
j−1
i=1
W
[i]
<
N
i= j
W
[i]
, (20)
j
i=1
W
[i]
≥
N
i= j+1
W
[i]
. (21)
Comparing to (16), we should notice that the weights W
i
and samples Z
i
in every LAD iteration are different. Suppose
that the prev ious estimate a
k−1
, which is also the output of a
weighted median, corresponds to Z
j
. We do not have to fully
order all these samples, but classify them into two categories,
the ones smaller than it and the ones larger. Check the in-
equalities to see if they still hold. If not, transfer the boundary
sample and its weight into another group and recheck until
the new weighted median output is found.
Two criteria are often used to compare LAD algorithms:
speed of convergence and complexity. Most of the effi-
cient algorithms, in terms of convergence speed (except for
Wesolowsky’s and its var iations), are derived from linear pro-
gramming (LP) perspectives, such as simplex and interior
point. Take Barrodale and Roberts’ algorithm
2
[10], for ex-
ample; its basic idea is to apply row and column operations
on a constructed (N +K)×(K +1) matrixA. The initial value
of A is
A =
XY
I0
, (22)
where Y is an N × 1vectorofobservationsofthedepen-
dent variable and X is an N × K matrix of the indepen-
dent variables. For the simple regression case, K = 2. BR-
like algorithms usually consist of two phases: Phase I forms
a set of independent edge direction vectors, Phase II updates
the variable basis until it converges. In general, BR-like al-
gorithms are slightly faster than other algorithms with sim-
pler structures. Their computational complexity, however, is
significantly higher. The complicated variable definition and
2
which can be considered as the basic form of the other two best
simplex-type algorithms, namely, Bloomfield and Steiger’s [1], and Arm-
strong, Frome, and Kung’s [11], according to [2].
logical branches used in BR-like algorithms cause tremen-
dous efforts in their hardware implementations and are thus
less attractive in such cases. Focusing on efficient algorithms
that have a simple structure for ease of implementation,
Wesolowsky’s direct descent algorithm stands out. The algo-
rithm is summarized below.
Step 1. Set k = 0. Choose the initial values a
0
, b
0
. Choose j
so that |Y
j
− a
0
X
j
− b
0
| is a minimum.
Step 2. Set k = k + 1. Use the weighted median struc ture to
get the update for b,
b
k
= MED
1 −
X
i
X
j
Y
i
− Y
j
X
i
/X
j
1 − X
i
/X
j
N
i=1
. (23)
Record the index i at which the term (Y
i
− Y
j
X
i
/X
j
)/(1 −
X
i
/X
j
) is the weighted median output.
Step 3. (a) If b
k
− b
k−1
= 0: if k ≥ 3, go to Step 4;ifnot,set
j
= i and go to Step 2.
(b) If b
k
− b
k−1
= 0: set j = i and go to Step 2.
Step 4. Let b
∗
= b
k
, a
∗
= Y
j
/X
j
− b
∗
/X
j
.
The major difference between Wesolowsky’s algorithm
and ours is that the weighted median operations in their
case are used for intercept b updates, while in our algo-
rithm, they are used for slope a updates. Since the realiza-
tion of the weig hted median in both algorithms can bene-
fit from the partial sorting scheme stated above, to compare
them, we only need to count the iteration times. Also no-
tice that in the initialization of Step 1, there is a minimum-
finding procedure, which can be considered a sorting op-
eration thus treated as having the same order of complex-
ity as a weighted median, even though they may be imple-
mented with totally different structures. For this reason, this
step in Wesolowsky’s algorithm will be counted as one it-
eration. Figure 5 depicts the comparison of the newly pro-
posed algorithm and Wesolowsky’s direct descent algorithm
intermsofnumberofiterations.Itcanbeobservedfrom
Figure 5 that, for large sample sets, the newly proposed LAD
regression method needs 5% less iterations, and about 15%
less for small sample sets.
4. CONCLUSIONS
A new iterative algorithm for LAD regression is developed
based on MLEs of location. A simple coordinate tr ansfor-
mation technique is used so that the optimization within
each iteration is carried out by a weighted median operation,
thus the proposed algorithm is well suited for hardware im-
plementation. Simulation shows that the new algorithm is
comparable in computational complexity with the best algo-
rithms available to date.
1768 EURASIP Journal on Applied Signal Processing
9
7
5
3
10
1
10
2
10
3
10
4
Number of samples
Average number of iterations
Weso low sk y’s alg or it hm
New algorithm
Figure 5: Comparison on the average number of iterations of
Wesolowsky’s and LA algorithms. The dimensions of the sample sets
are chosen as [20, 50, 200, 1000, 5000], each having 1000 averaging
runs.
APPENDIX
WEIGHTED MEDIAN COMPUTATION
The weighted median
Y = MED
W
i
X
i
N
i
=1
,(A.1)
having a set of positive real weights, can be computed out as
follows.
(1) Calculate the threshold W
0
= (1/2)
N
i=1
W
i
.
(2) Sort all the samples into X
(1)
, , X
(N)
with the corre-
sponding concomitant weights W
[1]
, , W
[N]
.
(3) Sum the concomitant weights beginning with W
[1]
and continuing up in order.
(4) The weighted median output is the sample X
( j)
whose
weight causes the inequality
j
i=1
W
[i]
≥ W
0
to hold
first.
ACKNOWLEDGMENT
This work was supported in part by the Charles Black Evans
Endowment and by collaborative participation in the Com-
munications and Networks Consortium sponsored by the US
Army Research Laboratory under the Collaborative Technol-
ogy Alliance Program, Cooperative Agreement DAAD19-01-
2-0011.
REFERENCES
[1] P. Bloomfield and W. L. Steiger, Least Absolute Deviations:
Theory, Applications, and Algorithms, Progress in Probability
and Statistics, Birkh
¨
auser Boston, Boston, Mass, USA, 1983.
[2] Y.Dodge,Ed., Statistical Data Analysis Based on the L
1
-Norm
and Related Methods, Elsevier Science Publishers (North-
Holland), Amsterdam, The Netherlands, 1987.
[3] Y. Dodge, Ed., L
1
-Statistical Analysis and Related Meth-
ods, North-Holland Publishing, Amsterdam, The Nether-
lands, 1992.
[4] Y. Dodge, Ed., L
1
-Statistical Procedures and Related Topics,In-
stitute of Mathematical Statistics, Hayward, Calif, USA, 1997.
[5] Y.DodgeandW.Falconer,Eds.,Statistical Data Analysis Based
on the L
1
-Norm and Related Methods, Barika Photography &
Productions, New Bedford, Mass, USA, 2002.
[6] F. Y. Edgeworth, “A new method of reducing observations
relating to several quantities,” Philosophical Magazine (Fifth
Series), vol. 24, pp. 222–223, 1887.
[7] R. W. Hawley and N. C. Gallagher Jr., “On edgeworth’s
method for minimum absolute error linear regression,” IEEE
Trans. Signal Processing, vol. 42, no. 8, pp. 2045–2054, 1994.
[8] T. E. Harris, “Regression using minimum absolute devia-
tions,” The American Statistician, vol. 4, no. 1, pp. 14–15,
1950.
[9] A. Charnes, W. W. Cooper, and R . O. Ferguson, “Optimal es-
timation of executive compensation by linear programming,”
Management Science, vol. 1, no. 2, pp. 138–151, 1955.
[10] I. Barrodale and F. D. K. Roberts, “An improved algorithm for
discrete l
1
linear approximation,” SIAM Journal on Numerical
Analysis, vol. 10, no. 5, pp. 839–848, 1973.
[11] R. D. Armstrong, E. L. Frome, and D. S. Kung, “A revised sim-
plex algorithm for the absolute deviation curve fitting prob-
lem,” Communications in Statistics, Simulation and Computa-
tion, vol. B8, no. 2, pp. 175–190, 1979.
[12] P. Bloomfield and W. Steiger, “Least absolute deviations
curve-fitting,” SIAM Journal on Scientific and Statistical Com-
puting, vol. 1, no. 2, pp. 290–301, 1980.
[13] G. O. Wesolowsky, “A new descent algorithm for the least ab-
solute value regression problem,” Communications in Statis-
tics, Simulation and Computation, vol. B10, no. 5, pp. 479–
491, 1981.
[14] Y. Zhang, “Primal-dual interior point approach for com-
puting l
1
-solutions, and l
∞
-solutions of overdetermined lin-
ear systems,” Journal of Optimization Theory and Applications,
vol. 77, no. 2, pp. 323–341, 1993.
[15] H. A. David, “Concomitants of order statistics,” Bulletin de
l’Institut International de Statist ique, vol. 45, no. 1, pp. 295–
300, 1973.
Yinbo Li was born in Mudanjiang, China, in
1973. He received the B.S. degree and M.S.
degree in underwater acoustic and electri-
cal engineering, both with the highest hon-
ors, from the Harbin Engineering Univer-
sity, Harbin, China, in 1994 and 1997, re-
spectively. From 1997 to 1998, he was with
the Institute of Acoustics, Chinese Academy
of Sciences, Beijing, China, mainly focus-
ing on signal processing and automatic sys-
tem control. He was a Research and Development Engineer with
the Beijing Division of Shenzhen Huawei Technology Co., Beijing,
China, and a key member of the high-end router developing group
from 1998 to 1999. He is currently a Research Assistant with the
Department of Electrical and Computer Engineering, University of
Delaware. He has been working with industry in the areas of signal
processing and optical communications. His research interests in-
clude statistical signal processing, nonlinear signal processing and
its applications, image processing, and optical and wireless com-
munications.
A Maximum Likelihood Approach to LAD Regression 1769
Gonzalo R. Arce received the Ph.D. degree
from Purdue University, West Lafayette, in
1982. Since 1982, he has been with the fac-
ulty of the Department of Electrical and
Computer Engineering at the University of
Delaware, where he is the Charles Black
Evans Professor and Chairman of Electrical
and Computer Engineering. His research
interests include statistical and nonlinear
signal processing, multimedia security, elec-
tronic imaging and display, and signal processing for communica-
tions. Dr. Arce received the Whittaker, Rehabilitation Engineering
& Assistive Technolog y Society of North America (RESNA) and
the Advanced Telecommunications/Information Distribution Re-
search Program (ATIRP) Consortium best paper awards. He re-
ceived the NSF Research Initiation Award. He is a Fellow of the
IEEE. Dr. Arce was the Cochair of the 2001 EUSIPCO/IEEE Work-
shop on Nonlinear Signal and Image Processing (NSIP’01), Cochair
of the 1991 SPIE’s Symposium on Nonlinear Electronic Imaging,
and the Cochair of the 2002 and 2003 SPIE ITCOM conferences.
He has served as an Associate Editor for the IEEE Transactions on
Signal Processing, and a Senior Editor of the Express.