Báo cáo hóa học: " Image Analysis of Soil Micromorphology: Feature Extraction, Segmentation, and Quality Inference Petros Maragos" doc
Bạn đang xem bản rút gọn của tài liệu. Xem và tải ngay bản đầy đủ của tài liệu tại đây (1.47 MB, 11 trang )
EURASIP Journal on Applied Signal Processing 2004:6, 902–912
c
2004 Hindawi Publishing Corporation
Image Analysis of Soil Micromorphology: Feature
Ex traction, Segmentation, and Quality Inference
Petros Maragos
School of Electrical & Computer Engineering, National Technical University of Athens, Athens 15773, Greece
Email:
Anastasia Sofou
School of Electrical & Computer Engineering, National Technical University of Athens, Athens 15773, Greece
Email:
Giorgos B. Stamou
School of Electrical & Computer Engineering, National Technical University of Athens, Athens 15773, Greece
Email:
Vassilis Tzouvaras
School of Electrical & Computer Engineering, National Technical University of Athens, Athens 15773, Greece
Email:
Efimia Papatheodorou
Department of Biology, Ecology Division, Aristotle University of Thessaloniki, Thessaloniki 54006, Greece
Email:
George P. Stamou
Department of Biology, Ecology Division, Aristotle University of Thessaloniki, Thessaloniki 54006, Greece
Email:
Received 6 February 2003; Revised 15 December 2003
We present an automated system that we have developed for estimation of the bioecological quality of soils using various image
analysis methodologies. Its goal is to analyze soilsection images, extract features related to their micromorphology, and relate the
visual features to various degrees of soil fertility inferred from biochemical characteristics of the soil. The image methodologies
used range from low-level image processing tasks, such as nonlinear enhancement, multiscale analysis, geometric feature detection,
and size distributions, to object-oriented analysis, such as segmentation, region texture, and shape analysis.
Keywords and phrases: soilsection image analysis, geometric feature extraction, morphological segmentation, multiscale texture
analysis, neurofuzzy quality inference.
1. INTRODUCTION
The goal of this research work is the automated estimation
of the bioecological quality of soils using image processing
and computer vision techniques. Estimating the soil quality
with the traditional biochemical methods, and more specif-
ically estimating those elements that are essential compo-
nents for the soil fertility, is a difficult, time-consuming, and
expensive process, which is, however, necessary for select-
ing and applying any management practice to land ecosys-
tems. Our approach has been the development of an auto-
mated system that will recognize the characteristics relevant
to the soil quality by computer processing of soilsection im-
ages and extraction of suitable visual features. Its final goals
are double-fold: (1) quantification of the micromorphology
of the soil via analysis of soilsection images and (2) corre-
spondence of the extracted visual information with the clas-
sification of soil into various fertility degrees inferred from
measurements performed biochemically on the soil samples.
The overall system is shown in Figure 1.
Soil Image Analysis 903
Initial knowledge
of soil quality
from soilsection
features
Neural network
Correspondence
Chemical analysis
Soil quality
evaluation
Feature
extraction
using computer
vision
Homogeneous
regions texture
analysis with
fractals
Shape analysis
Size distribution
histograms
and moments
measures
Multiscale image
analysis
Geometrical
feature
extraction
Marker
detection/
extraction
Watershed
segmentation
Texture analysis
with AM-FM
models
Soil
(map image)
Soil sampling
Digital image
acquisition system
(digital camera,
scanner)
Filtering for image
enhancement
Figure 1: Overall system architecture.
In the image analysis part of this work, the above goals
require solving a broad spectrum of problems in image
processing and computer vision. Next, we list the most
important of such problems (following a hierarchy from
low-level vision to high-level vision) which we have inves-
tigated for detecting characteristics and extracting infor-
mation from soilsection images: (1) enhancement of im-
ages; (2) feature detection; (3) multiscale image analysis;
(4) statistical size distributions; ( 5) segmentation into ho-
mogeneous regions; (6) texture analysis; (7) shape analy-
sis; and (8) correspondence of the features extracted from
analyzing the soilsection images with the fertility grade of
the soil inferred from its biochemical character istics. The
tools and methodolog ies that we have used for solving the
above image analysis problems (1)–(7) include the follow-
ing: (i) nonlinear geometric multiscale lattice-based image
operators (of the morphological and fuzzy type) for multi-
scale image simplification and enhancement, extracting pre-
segmentation features, size distributions, and region-based
segmentation; (ii) nonlinear part ial differential equations
(PDEs) for isotropic modeling and implementing various
multiscale evolution and visual detection tasks; ( iii) frac-
tals for quantifying texture and shape analysis from the
viewpoint of geometrical complexity; (iv) modulation mod-
els for texture modeling from the viewpoint of instanta-
neous spatial frequency and amplitude components; and
(v) topological and curvature-based methods for region
shape analysis. Finally, methods of fuzzy logic and neu-
ral networks were investigated for the symbolic descrip-
tion and automated adaptation of the correspondence be-
tween the soilsection images and the bioecological quality of
soil.
2. SOIL DATA AND MICROMORPHOLOGY
Soil data: the first phase of this work dealt with collecting
soil samples both for performing biochemical measurements
and for computer-based automated analysis of their images.
During the phase of data collection, soil was sampled in
mid September 2000 under the canopy of five chara cteris-
tic shrubs of the Mediterranean (Greek) ecosystem (Junipe-
rus sp., Quercus coccifera, Globularia sp., Erica sp. and Thymus
sp.) as well as from the empty area among shrubs. Digital im-
ages of soilsections (of size in the order of about 20
×20 mm)
were formed using cameras and scanners at a resolution of
1200 dpi. Representative images from the six categories are
904 EURASIP Journal on Applied Signal Processing
(a) (b) (c)
(d) (e) (f)
Figure 2: Characteristic soilsection categories. (a) Erica.(b)Thymus capitatus.(c)Juniperus oxycedrus.(d)Globularia alypum.(e)Quercus
coccifera. (f) Void.
shown in Figure 2. The white regions correspond to air voids,
while the dark regions to soil grains or aggregates.
Soil visual micromorphology: we summarize a few main
concepts and definitions from [1]. The goal of soil micro-
morphology, as a branch of soil science, is the description, in-
terpretation, and measurement of components, features, and
fabrics in soils at a microscopic level. Basic soil components
are the individual particles (e.g., quartz grains, clay minerals,
and plant fragments) that can be resolved with the optical
microscope together with the fine material that is unresolved
into discrete individuals. Soil fabric deals with the total orga-
nization of a soil, expressed by the spatial arrangement of soil
constituents, their shape, size, and frequency. Discrete fab-
ric units are called pedofeatures. Soil structure is concerned
with the size, shape, and spatial arrangement of primary par-
ticles and voids in both agg regated and nonaggregated mate-
rial. Important characteristics of indiv idual soil constituents,
which are to be inferred by analyzing thin soilsections for
describing soil fabric and structure, include: (1) size: classi-
fied into various scale bands, that is, micro (1–100 µm), meso
(100–1000 µm), and macro (1–10 mm), (2) shape: 2D repre-
sentation of 3D objects, (3) surface roughness/smoothness,
(4) boundary shape, (an)isotropy, and complexity, (5) con-
trast: degree to which the feature being described is clearly
differentiable from other features, and (6) sharpness: transi-
tion between the particular feature and other features. Many
of these characteristics are a function of the orientation of
components and the direction in which they are cut as well
as of the magnification used.
Biochemical analysis: in parallel and independently from
the analysis of soilsection images, biochemical measurements
were also performed on the soil samples. Specifically, the
soil samples were analysed for C-microbial, CO
2
-evolution
at 10
◦
C, fungal biomass by measuring ergosterol, bacte-
rial substrate utilization (used as an index of bacterial ac-
tivity) at 28
◦
C for 120 h, by using GN Biolog plates, rate
of C-mineralization at 28
◦
C, C-organic, N-organic, and N-
inorganic (NH
4
and N0
3
). These biochemical characteristics
were used to infer the fertility grade of the soil.
3. NONLINEAR & GEOMETRIC IMAGE ANALYSIS
3.1. Enhancement and presegmentation
feature detection
The objective of image enhancement is to reduce the pres-
ence of noise, remove redundant information, and produce
a smooth image that consists mostly of flat and large re-
gions of interest. The methodology developed for the en-
hancement of soilsection images was based on the geomet-
rical features and properties these images exhibit. Soilsection
images have a great variety of geometrical features that can
beeither1Dsuchasedgesorcurves,or2Dsuchaslightor
dark blobs (small homogeneous regions of usually random
shape) providing useful information for the evaluation of
structure quality. Since shape, size, and contrast are features
of primary importance, the image needs an object-oriented
processing so that its structure is simplified but at the same
time the remaining object-regions’ boundaries are preserved.
Soil Image Analysis 905
Three types of connected morphological operators
1
that have
such object-oriented properties are reconstruction and area
openings and closings [3, 4] and levelings [5].
The (conditional) reconstruction opening ρ
−
(m| f )ofan
image f given a marker signal m ≤ f can be obtained as
follows:
ρ
−
(m| f ) = lim
n→∞
δ
n
B
(m| f ), δ
B
(m| f ) = (m ⊕ B) ∧ f ,(1)
where δ
n
B
denotes the n-fold composition of the conditional
dilation δ
B
with itself and B is a unit disk. The reconstruction
closing is defined dually by iterating conditional erosions:
ρ
+
(m| f ) = lim
n→∞
ε
n
B
(m| f ), ε
B
(m| f ) = (m B) ∨ f. (2)
The operations ⊕ and denote the classic Minkowski dila-
tion and erosion.
The area opening (closing) of a binary image at size scale
s ≥ 0 removes all the connected components of the image
foreground (background) whose area is <s. Particularly, let
the set X =
i
C
i
represent a binary image, where C
i
rep-
resent the connected components of X. The area opening
output is α
s
(X) =
j
C
j
with area(C
j
) ≥ s,forall j.Any
increasing binary operator can be extended to gray-level im-
ages via threshold superposition. Consider a gray-level im-
age f and its threshold binary images f
h
(x), where h ranges
over all gray levels. The value of f
h
(x)is1if f (x) ≥ h and
0 otherwise. Then, the gray-level area opening is defined as
α
s
( f )(x) = sup{h : α
s
( f
h
)(x) = 1}. If the image f takes only
nonnegative integer values h ∈{0, 1, , h
max
}, then
α
s
( f )(x) =
h≥1
α
s
f
h
(x). (3)
Similarly, we can define the area closing of f by duality as
β
s
( f ) = h
max
− α
s
(h
max
− f ).
The levelings are a powerful class of self-dual connected
operators [5]. The leveling Λ(m| f )ofareferenceimage f
given a marker m can be obtained either from (i) a spe-
cific composition ρ
+
(ρ
−
(m| f )| f )ofareconstructionopen-
ing followed by a reconstruction closing, where the former
result is used as the marker of the latter or (ii) as the limit
(as t →∞) of a scale-space function u(x, t) generated by the
following PDE [5]:
∂u
∂t
=−sign
u(x, t) − f (x)
∇u (4)
with initial condition u(x,0)= m(x).
Based on the demands of the specific application, we have
found that the following two systems of morphological con-
1
Whenever we refer to morphological operators we will mean them in
the lattice-theoretic sense [2]. Namely, consider the complete lattice L of
real-valued image signals equipped with the partial ordering f
≤ g,the
supremum
, and the infimum
. Then, dilation (erosion) is any opera-
tor that distributes over
(
). Further, opening (closing) is any operator
that is antiextensive (extensive), increasing, and idempotent.
nected filters were the most suitable family of operators for
enhancement and simplification of the soilsection images:
(1) alternating sequential filters (ASFs), consisting of multi-
scale alternating openings and closings of the area type or re-
construction type; (2) multiscale levelings [5]. Scale in both
cases was obtained by varying the scale of the marker signal.
Furthermore, we have developed generalized morpho-
logical operators by using concepts from lattice morphology
and fuzzy sets. Specifically, we defined as lattice-fuzzy dilation
δ
fuz
( f )(x) =
y
T
f (y), g(x − y)
(5)
formed as supremum of a fuzzy intersection norm T,which
can be the minimum, product or any other parametric trian-
gular norm (T-norm) [6]. Replacing the sup with infimum
and T with its adjoint fuzzy implication operation yields a
lattice-fuzzy erosion ε
fuz
such that the pair (ε
fuz
, δ
fuz
)formsa
lattice adjunction [2]. This guarantees that their composition
will be a valid algebraic opening or closing. The power, but
also the difficulty, in applying these fuzzy operators to image
analysis is the large variety of fuzzy norms and the absence of
systematic ways in selecting them. Towards this goal, we have
performed extensive experiments in applying these fuzzy op-
erators to various nonlinear filtering and soil image analysis
tasks, attempting first to understand the effect that the type
of fuzzy norm and the shape and size of structuring function
have on the resulting new image operators. In general, we
have observed that the fuzzy operators are more adaptive and
track closer the image peaks/valleys than the corresponding
flat morphological operators of the same scale. Details can be
found in [7].
After the enhancement follows the feature extraction
stage, such as estimation of an edge gradient which can pro-
vide information about critical zones and regions of interest
that are present in the soilsection image f . A simple and ef-
ficient scheme is the morphological gradient f ⊕ B − f B.
Further, we have developed some new fuzzy gradients of the
type min[δ
fuz
( f ), 1 − ε
fuz
( f )] which yielded sharper image
edges [7].
Using the aforementioned edge gradients and other non-
linear object-oriented operators we extract 2D features such
as dark or lig h t blobs that indicate the presence of objects-
regions. Such operators are the g eneralized top-hat transform
defined as the residual ψ
+
( f ) = f − α( f ), as well as its dual
bottom-hat transform ψ
−
( f ) = β( f ) − f . The operators α
and β are generalized openings and closings, respectively, of
the Minkowski, area, or reconstruction type.
3.2. Granulometric size distributions
Using Matheron’s theory of sizing and granulometries, the
classic Minkowski openings and closings by multiscale con-
vex sets can yield size distributions of images [8]. The corre-
sponding size histograms (a.k.a. “pattern spectra”) have been
very useful for shape-size description of images and for de-
tecting critical scales [8, 9].Thesizehistogramsareespecially
important for analyzing soilsection images where multiscale
size and shape of the soil components play a centr al role. For
906 EURASIP Journal on Applied Signal Processing
this application, we have developed generalized granulomet-
ric size distributions by using multiscale openings and clos-
ings of the area and reconstruction type [10].
Let α
s
and β
s
denote families of multiscale openings and
closings, respectively, which depend on a scale parameter s ≥
0 and vary monotonically as the scale varies:
s<r
=⇒ α
s
( f ) ≥ α
r
( f ), β
s
( f ) ≤ β
r
( f ). (6)
By measuring the volume Vol(·) under the surface of these
multiscale filterings of f , we can create the granulometry
G
f
(s) =
Vol
α
s
( f )
, s ≥ 0,
Vol
β
−s
( f )
, s<0.
(7)
Due to (6), the granulometry G
f
(s) decreases as s increases.
Further, after some appropriate normalization [9], it can be-
come the size distribution of a random variable whose value
is related to the size content of f . The derivative of this dis-
tribution yields a size density which behaves like the proba-
bility density function of this random variable. Ignoring this
size density, for notational simplicity, the normalizing factor
yields a nonnegative function P
f
(s) =−dG
f
(s)/ds.Thisun-
normalized size density is also called “pattern spectrum” due
to its ability to quantify the shape-size content of images [9].
For discrete images f , we use integer scales s, the granulome-
try G
f
(s) is obtained as above by defining Vol( f ) as the sum
of values of f , and the size density P
f
(s) is obtained by using
differences instead of derivatives:
P
f
(s) = G
f
(s) − G
f
(s +1). (8)
In the discrete case, we call P
f
(s)asize histogram.Now,we
have examined three types of size histograms for soilsec-
tion images by using three corresponding types of multi-
scale openings and closings: (1) classic Minkowski openings
α
s
( f ) = ( f sB)⊕sB and closings β
s
( f ) = ( f ⊕sB)sB by fl at
disks of radii s; (2) reconstruction openings ρ
−
( f sB| f )and
reconstruction closings ρ
+
( f ⊕ sB| f ) with multiscale mark-
ers; and (3) area openings and closings where the varying
scale s coincides with the area threshold below which com-
ponents are removed by the filter.
All the above multiscale opening s and closings obey the
threshold superposition. The pattern spectrum inherits this
property [9]. Thus, if a discrete image f assumes integer val-
ues h ∈{0,1, , h
max
}, then
P
f
(s) =
m
h≥1
P
f
h
(s), (9)
where f
h
is the threshold binary image obtained from f by
thresholding it at level h.Theabovepropertyallowedusto
develop in [10] a fast algorithm for measuring the general-
ized size histograms, because the size histograms based on re-
construction and area openings become extremely fast when
applied to binary images since we essentially need just to la-
bel the connected components of the binary image and count
their areas. Then the total size histogram results as the sum
of the histograms of all the threshold binary images.
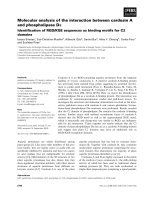
The aforementioned granulometric analysis based on
classic and generalized openings is applied to the charac-
terization and description of the size content of soilsection
images. Typical experimental results are shown in Figure 3,
where the closings yield the size distribution of the dark im-
age objects, that is, the soil grains or aggregates. In general,
the classic size histogram based on Minkowski granulome-
tries informs us on how the (volume) combination of size
and contrast is distributed among soil components across
many scales. Isolated spikes indicate the existence of objects
with components at those scales. As Figure 3c shows, the size
histogram based on reconstruction closings offers a better
localization of the object sizes since the histogram presents
abrupt peaks at the scales where large connected objects ex-
ist. The area closing size histogram of a binary image contains
spikes only at scales equal to areas of binary components ex-
isting in the image. The area size histogram of a graylevel im-
age, as in Figure 3d, is a superposition of the area histograms
of its threshold binary images, as property (9) predicts.
3.3. Texture analysis
Objects or regions of interest in soilsection images often ex-
hibit a considerable degree of geometrical complexity in their
boundary or surface. Such sets can be modeled as fractals.
The degree of surface roughness, measured via its fractal di-
mension, can serve as a useful descriptor for texture analysis.
In our work, we estimate the fractal dimension D of homoge-
neous regions using multiscale surface covers computed via
multiscale flat morphological erosions and dilations. Specif-
ically, D = lim
r↓0
log Vol[ f ⊕ rB − f rB]/ log(1/r). The
estimated fractal dimension can be used as a measure of lo-
caltextureroughnessofsoilsectionimagesandcanhelpwith
their classification.
We have also studied the texture of soilsection images us-
ing 2D AM-FM models and energy demodulation algorithms
[11]. A texture image is locally modeled as a 2D AM-FM sig-
nal a(x, y)cos[φ(x, y)], meaning that it can be parametrized
by a local spatial frequency vector (ω
x
, ω
y
) = (∂φ/∂x, ∂φ/∂y)
and a local intensity amplitude (contrast) |a(x, y)|. These 2D
instantaneous spatial amplitude and frequency signals are the
components of the 2D AM-FM image model. Based on the
fact that local spatial frequencies have higher absolute val-
ues where greater alterations in texture occur, we can distin-
guish the different texture regions that are present in soil-
section images. Using a 2D energy-based demodulation al-
gorithm with relatively low computational complexity, based
on a 2D energy-tracking operator Ψ( f ) =∇f
2
− f ∇
2
f ,
we were able to estimate the constituent signals |a|, ω
x
, ω
y
of
the model and presegment the soilsection image in distinct
texture areas.
4. SEGMENTATION
Segmentation of soilsection images is a very important task
for automating the measurement of the grains’ properties as
well as for detecting and recognizing objects in the soil, im-
portant for its bioecological quality. It proves to be difficult
to achieve due to the low contrast, complex structure, and
Soil Image Analysis 907
(a)
0
0.5
1
1.5
2
2.5
3
3.5
4
4.5
5
−10 −8 −6 −4 −20 2 4 6 810
×10
5
Radius (mm)
Size histogram
(b)
0
1
2
3
4
5
6
−9 −8 −7 −6 −5 −4 −3 −2 −10
×10
5
Marker (mm)
Size histogram
(c)
0
0.5
1
1.5
2
2.5
3
3.5
4
0 1020 304050607080
×10
4
Area (mm
2
)
Size histogram
(d)
Figure 3: Size histograms for a soilsection image. (a) Original image (405 × 479 pixels, 20 .3 × 17.2 mm). (b) Size histogram based on flat
Minkowski openings/closings. (c) Size histogram based on reconstruction closings. (d) Size histogram based on area closings.
often overlapping components present in these images. A
well-known segmentation methodology in the field of math-
ematical morphology is the watershed approach [12], which
is the preferred solution for the segmentation of soilsection
images. The segmentation task can be divided into three dif-
ferent stages: (a) preprocessing and image enhancement, (b)
region-feature extraction, and (c) watershed transform [13].
As described in Section 3.1, stage (a) is of critical im-
portance since its output strongly influences the segmenta-
tion results. Its objective is to reduce the presence of noise
and make the image easier to segment by removing useless
information, thus producing an image that consists mostly
of flat and large regions. Since we are interested in ob-
ject boundaries, the images need to be processed in such
a way that their structure is simplified, the objects’ inte-
rior texture is smoothed while the relevant contour informa-
tion is accurately preserved. Preservation of object bound-
aries is the main property of connected operators,described
in Section 3.1,whichdifferentiates them from other opera-
tors that perform their func tion locally, thus affecting region
boundaries. Connected operators do not remove some fre-
quency components (like linear filters do) or some small-size
structures (like median filters or simple openings and clos-
ings do), but what they actually do is removing and merging
flat zones. The preprocessing was based on reconstruction fil-
ters (1), (2)andareafilters(3). Reconstruction openings re-
move entire bright components that are not marked by the
markers, filling up the voids in soil grains or clusters and
908 EURASIP Journal on Applied Signal Processing
(a) (b)
(c) (d)
Figure 4: Segmentation stages: (a) original image, (b) enhanced
image, (c) markers, and (d) segmented image.
making them more flat and uniform. Similarly, reconstruc-
tion closings remove dark components that are disjoint from
the markers, eliminating very small soil grains and dark re-
gions, making the background more uniform. The i mage can
be further simplified by applying area openings and closing s.
An area closing with relatively low area threshold suppresses
small dark regions, whereas an area opening with relatively
high threshold merges flat regions inside the boundaries of
soil grains, making the grains look darker and more uniform.
In this way, arbitrarily shaped image components with area
smaller than a given threshold are suppressed and the result-
ing image consists mostly of flat regions. The outcome of this
stage can be viewed in Figure 4b.
At stage (b), the goal is to extract some special features
from the simplified image such as small region seeds, called
markers, which will be used as the starting points for the
flooding process. The markers should be indicative of the re-
gions where the objects of interest exist. Using the edge gra-
dients mentioned in Section 3.1 and performing nonlinear
object-oriented processing on the image, we extract region
features such as contrast grain markers via the following pro-
cedure. First, we perform a reconstruction closing (2) to the
simplified image f (obtained after the enhancement stage)
by using as marker m = f + h, the simplified image incre-
mented by a constant h. The simplified image f is subtracted
from the reconstructed image ρ
+
( f + h| f ), and the resulting
image residue is thresholded at a level about h/2. The ob-
tained binary image is the set of markers that are included in
the clusters of soil grains. These inside markers specify the lo-
cation of the soil grains of a certain contrast that produce val-
leys of contrast depth h. The size and shape of region markers
are not critical for the segmentation, but only their location
and existence. These features are of extreme importance since
they specify the location of soil grains and clusters of a cer-
tain contrast and are used as segmentation seeds. In order
to segment the image successfully, another set of markers is
needed. This set is called outside markers and corresponds to
the background of the image. The marker for the background
is extracted by flooding the filtered soilsection image using as
sources the inside markers. The resulted watershed line is the
outside connected marker (background marker). The final
set of markers is the union of the two sets detected previously,
markers
= inside markers ∪ outside markers, presented in
Figure 4c.
At stage (c), the watershed transform is applied on the
morphological gr adient of the enhanced image. It can be
viewed as the process of flooding a topographic surface using
the markers as sources. The watershed construction grows
the markers until the exact contours of the objects are found.
The watershed transformation is implemented via hierar-
chical queues using an ordering relation for flooding [12].
Figure 4 shows an example of our results from segmenting a
soilsection image using the above methodologies. As shown
in Figure 4d, most of the soil grains are detected. The ones
that a re missed are of small size and low contrast compared
to their local background. This was expected due to the spe-
cific filtering that was performed on the image.
5. POSTSEGMENTATION VISUAL FEATURE
EXTRACTION
After the segmentation is completed, the obtained regions are
further processed in order to determine some postsegmen-
tation features related to size, shape, and texture. Initially,
we measure the area of global soil structure in comparison
to void. In addition, various other local region descriptors
are computed such as the area, perimeter, equivalent diame-
ter, eccentricity (elongation), convexity, and compactness of
each soil grain or cluster, using binary image analysis tech-
niquesasin[14]. As far as texture is concerned, the fractal
dimension of the surface of each soil grain and its local fre-
quency vectors are estimated so as to be used in some further
texture analysis and soilsection classification.
The results of granulometric image analysis are also used
to study the multiscale structure of soilsections based on
their images. The large number of components of such im-
ages requires a multisided statistical description of the size
distribution of regions. Thus, we use the generalized size his-
tograms to measure many useful attributes including: (1)
the average size of grains and pores, expressed by the mean
values of the closing- and opening-based, respectively, size
histogram; (2) size variability, measured by the deviation
around the mean of the size histograms; (3) the percent
of grains/pores in localized scale zones; (4) the coarse-to-
fine ratio; (5) the statistical complexity of grain-pore size
distribution, measured by the entropy of the size closing-
opening histogram; (6) all the above with various alternative
Soil Image Analysis 909
Table 1: The image features (input of the neurofuzzy network).
INPUTS (X)
x
1
Mean area (post)
∗
x
8
Mean closing histogram (pre)
∗∗
x
2
Mean perimeter (post) x
9
Mean opening histogram (pre)
x
3
Mean eccentricity (post) x
10
St. dev. closing histogram (pre)
x
4
Mean orientation (post) x
11
St. dev. opening histogram (pre)
x
5
Mean convexity (post) x
12
Entropy closing histogram (pre)
x
6
Mean equiv. diam. (post) x
13
Entropy opening histogram (pre)
x
7
Mean compactness (post) x
14
Void perce nt age (p ost)
∗
postsegmentation,
∗∗
presegmentation.
interpretations of “scale” based on different geometrical
properties (e.g., smallest or largest diameter, area, and de-
gree of connectivity). All the above features extracted from
size histograms refer both to the global image as well as to
an averaging of its segmented region properties, because the
size histogram of the whole image is the sum of the size his-
tograms of individual regions.
As inputs to the neurofuzzy system that will perform the
soil classification, we have used, during the first phase of our
experiments, only a subset of all the above derived image fea-
tures shown in Ta ble 1.
6. CLASSIFICATION AND AUTOMATED
CORRESPONDENCE
Finally, the segmentation results (homogeneous areas), the
postsegmentation features (shape and texture) and the gran-
ulometric analysis results (size histograms), as well as the
biochemical analysis results, are used as inputs in a neuro-
fuzzy system with the objective of classifying the soil into
bioecological quality categories. A main difficulty we had
was the small number of training data (only 26 input-output
pairs), since the chemical analysis of soilsections was expen-
sive and time consuming. Moreover, the dimensionality of
the problem was very high (14 features). Thus, the amount
of data was not sufficient for “learning from scratch” a neu-
ral network to approximate the feature-to-category associa-
tion. Thus, a two-layered neurofuzzy system is developed, for
the hybrid subsymbolic-symbolic processing of the feature-
to-category association. This neurofuzzy system has the abil-
ity to initialize the set of weights with the aid of symbolic in-
formation (represented in the form of rules) and then adapt
it with the aid of input-output numerical data.
Error minimization on this small number of data will
lead to a loss of the generalization property. The symbolic
information provided by the experts (bioecologists) must be
used in order to improve the system performance. The as-
sociation of the image features with the quality is essential
for the initialization of the neurofuzzy network. Heterogene-
ity in the soil characteristics implies high biological activity.
The features can be associated, either directly or in combi-
nation with other features, with the soil fertility of the bi-
ological images. The postsegmentation features have a clear
physical meaning providing size and textual information and
are mainly used for the detection of soil heterogeneous char-
acteristics.
There are many ways to express heterogeneity using the
proposed image features (Tab le 1). Two or more features can
form a rule to express the soil key attributes. The disparity
of the component size is a significant attribute of a biological
image. Mean area (x
1
), mean perimeter (x
2
), mean equiv-
alent diameter (x
6
), and standard deviation of the opening
histogram (x
11
) are the main features related to the compo-
nent size. Another attribute is the amount of void in a soil
section. The void percentage implies the existence of small
components. Consequently, the void percentage (x
14
)and
the mean area (x
1
) can be employed to express the void at-
tribute. In addition, mean convexity (x
5
) and mean compact-
ness (x
7
) a re related to the level of void in a soilsection. Mean
orientation (x
4
) is slightly relevant to the heterogeneity.
Homogeneous soil characteristics imply low biological
activity. The postsegmentation features are mainly involved
in detecting high and medium quality biological images. On
the other hand, the presegmentation features are very help-
ful for the detection of low quality images. Entropy closing
histogram (x
12
), standard deviation of the closing histogram
(x
10
), and mean closing histogram (x
8
) are re lated to low fer-
tility images. In addition, the existence of uniform large size
components refer to homogeneous soil textual characteris-
tics. Mean closing histogram (x
8
), mean area (x
1
), and en-
tropy closing histogram (x
12
) are used for the detection of
large components.
The rules relating the features to the bioecological soil
quality categories are generally of the form “IF feature (1)
and andfeature(n)THENcategory(i).” Each rule consists
of an antecedent (its IF par t ) and a consequence (its THEN
part), it is given in symbolic form by the experts and used
in order to initialize the neurofuzzy network (giving its ini-
tial st ructure and weights). During the learning process, the
weights of both layers may change with the objective of the
error minimization approximating the solution of the fuzzy
relational equation that describes the association of the in-
put with the output data. After the weight adaptation, the
network keeps its transparent structure and the new knowl-
edge represented in it can be extracted in the form of fuzzy
IF-THEN rules.
Let F ={f
1
, f
2
, , f
n
} and C ={c
1
, c
2
, , c
m
} be
the set of features and categories, respectively, and let also
910 EURASIP Journal on Applied Signal Processing
R ={r
1
, r
2
, , r
p
} be the set of rules describing the knowl-
edge of the system. The set of antecedents of the rules is de-
noted by Z ={z
1
, z
2
, , z
l
}. Suppose now that a set D =
{(A
i
, B
i
), i ∈ N
q
},whereA
i
∈
F and B
i
∈
C (
∗
is the set of
fuzzy sets defined on ∗), of input-output numerical data is
given sequentially and randomly to the system (some of them
are allowed to reiterate before the first appearance of some
others). The two problems that arise are (1) the initialization
of the weights with the aid of fuzzy IF-THEN rules and (2)
the adaptation of these weights w ith the aid of input-output
numerical data.
The proposed neurofuzzy system consists of two layers of
compositional neurons which are extensions of the conven-
tional neurons [15]. The compositional neurons are based
on the operation of triangular norm T [6] and the respective
implication operator ω
T
defined by
ω
T
(a, b) = sup
x ∈ [0, 1] : T(a, x) ≤ b
, a, b ∈ [0, 1].
(10)
Based on the above operators, we define the inf-ω
T
com-
positional neuron as
z
i
=
j∈N
n
ω
T
W
1
, f
j
, i ∈ N
l
, (11)
and the sup-T compositional neuron as
c
i
=
j∈N
l
T
z
j
, W
2
j
, i ∈ N
m
, (12)
where W
1
, W
2
are weight matrices.
The proposed neurofuzzy system uses two layers of com-
positional neurons. The first consists of inf-ω
T
neurons tak-
ing as input the features and computing the antecedents of
the rules, while the second layer consists of sup-T neurons
giving to the output the recognized category. We initialize
the weight matrices W
1
ij
, i ∈ N
n
, j ∈ N
l
and W
2
ij
, i ∈ N
n
,
j ∈ N
l
, using the set of rules R and taking advantage of the
representational power of fuzzy relational equations [15].
The adaptation of the system is based on the computa-
tion of the new weight matrices W
1
new
and W
2
new
for which
the error
=
i∈N
q
B
i
− c
i
(13)
is minimized (c
i
, i ∈ N
q
is the network output with input
A
i
). The computation is based on the resolution of the fuzzy
relational equations
W
1
◦
ω
T
A = Z, Z ◦
T
W
1
= B,
(14)
where T is a continuous T-norm and Z is the set of an-
tecedents fired when the input A is given to the network.
Using a traditional minimization algorithm (like the steep-
est descent), we cannot take advantage of the specific charac-
ter of the problem (symbolic representation). The algorithm
that we use is based on a more sophisticated credit assign-
ment that penalizes the neurons of the network using the
Table 2:Therulesoftheneurofuzzysystem.
R Antecedent Output
r
1
x
1
+ x
2
+ x
6
+ x
10
High fertility
r
2
x
1
+ x
14
High fertility
r
3
x
5
+ x
7
+ x
14
High fertility
r
4
x
3
+ x
4
+ x
10
High fertility
r
5
x
3
+ x
5
Medium fertility
r
6
x
4
+ x
7
+ x
10
Medium fertility
r
7
x
8
+ x
10
+ x
12
Low fertility
r
8
x
1
+ x
9
+ x
13
Low fertility
knowledge about the topographic structure of the solution
of the fuzzy relation equation [16].
Roughly speaking, the above equations describe a gener-
alized two-layered fuzzy associative memory with the proper-
ties of perfect recall and generalization. It has been applied for
classifying the six categories of soilsection images into three
fertility categories (low, medium, and high fertility). The Ju-
niperus oxycedrus and the Quercus cocc ifera are classified as
high-fertility soil, the Void is classified as low-fertility soil and
the rest are classified as medium-fertility soil. For the exper-
iments, we have employed 26 different soilsection images (7
high, 15 medium, and 4 low fertilit y).
The network has 14 inputs, X = (x
1
, x
2
, , x
14
), which
were the extracted image features listed in Ta ble 1.Itrepre-
sents eight rules, R = (r
1
, r
2
, , r
8
) (see Ta ble 2) covering the
knowledge provided by the experts. The antecedent and the
consequence part are used for the initialization of W
1
and
W
2
,respectively.
We first used the Yager T-norm
Y
yager
z, w
2
= 1 − min
1,
(1 − z)
p
+
1 − w
2
p
1/p
, p>0,
(15)
with parameter value p
= 2. The Yager implication ω
T
is
Z
yager
w
1
, x
=
1 −
1 − w
1
p
− (1 − x)
p
1/p
, w
1
>x,
1, else.
(16)
The neurons were adapted independently, in 20 itera-
tions. The adaptation procedure did not alter the knowledge
of the system, it only adjusted the strength of the image fea-
tures. The error perfor mance is illustrated in Figure 5.Al-
though the number of numerical data was not sufficient to
learn the neural network from scratch, the adaptation of the
system has been performed using the data set presented in
the previous section (we excluded one data from each cat-
egory and used it for testing). Before the adaptation proce-
dure the classification rate was 70%, while afterwards it rose
to 80%. In general, we could achieve a better performance by
importing more rules in the network. However, the number
of rules influenced the generalization and symbolic meaning
of the network.
Soil Image Analysis 911
0
0.05
0.1
0.15
0.2
0.25
0.3
0.35
0.4
0.45
0.5
0102030
Iterations
Learning error
Figure 5: The error performance of the system.
7. CONCLUSION
In this paper, we have developed the first phase of an auto-
mated system for soil image analysis and quality inference.
The image analysis was based on relatively advanced tech-
niques that emphasized object-oriented processing, but the
final features used for classification were of a simple type to
maintain a modest overall complexity of the system. In fu-
ture phases, we plan to use more sophisticated visual features
resulting from geometrical and statistical object-based shape
and texture analysis as well as integrate into the neuro-fuzzy
inference procedure a more mature reasoning and a finer
grading for the soil quality from the bioecology experts.
ACKNOWLEDGMENTS
We wish to thank the additional researchers who participated
in this research project. (1) D. Dimit riadis, A. D oulamis,
N. Doulamis, G. Tsechpenakis from NTUA. (2) J. Diaman-
topoulos, M. Argyropoulou from Dept. Biology, Arist. Univ.
Thessaloniki. (3) S. Varoufakis, N. Vassilas, C. Tzafestas from
NCSR Demokritos, Athens. This research work was sup-
ported by the Greek General Secretariat for Research and
Technolog y and by the European Union under the pro-
gram ΠENE∆-2001 with Grant # 01E∆ 431. It was also par-
tially supported by the European Network of Excellence
“MUSCLE.”
REFERENCES
[1]P.Bullock,N.Fedoroff,A.Jongerius,G.Stoops,and
T. Tursina, Eds., Handbook for Soil Thin Section Descrip-
tion, Waine Research Publications, Albrighton, Wolverhamp-
ton, UK, 1985.
[2] H.J.A.M.Heijmans, Morphological Image Operators, Aca-
demic Press, New York, NY, USA, 1994.
[3] P. Salembier and J. Serra, “Flat zones filtering, connected op-
erators, and filters by reconstruction,” IEEE Trans. Image Pro-
cessing, vol. 4, no. 8, pp. 1153–1160, 1995.
[4] L. Vincent, “Morphological grayscale reconstruction in im-
age analysis: applications and efficient algorithms,” IEEE
Trans. Image Processing, vol. 2, no. 2, pp. 176–201, 1993.
[5] F. Meyer and P. Maragos, “Nonlinear scale-space representa-
tion with morphological levelings,” Journal of Visual Commu-
nication and Image Representati on, vol. 11, no. 2, pp. 245–265,
2000.
[6] G. J. Klir and B. Yuan, Fuzzy Sets and Fuzzy Logic: Theory
and Applications, Prentice-Hall, Upper Saddle River, NJ, USA,
1995.
[7] P. Maragos, V. Tzouvaras, and G. Stamou, “Synthesis and ap-
plications of lattice image operators based on fuzzy norms,” in
Proc. IEEE International Conference on Image Processing, vol. 1,
pp. 521–524, Thessaloniki, Greece, October 2001.
[8] J. Serra, Image Analysis and Mathematical Morphology,Aca-
demic Press, New York, NY, USA, 1982.
[9] P. Maragos, “Pattern spectrum and multiscale shape repre-
sentation,” IEEE Trans. on Pattern Analysis and Machine Intel-
ligence, vol. 11, no. 7, pp. 701–716, 1989.
[10] A. Doulamis, N. Doulamis, and P. Maragos, “Generalized
multiscale connected op erators with applications to granulo-
metric image analysis,” in Proc. IEEE International Conference
on Image Processing, vol. 3, pp. 684–687, Thessaloniki, Greece,
October 2001.
[11] P. Maragos and A. C. Bovik, “Image demodulation using mul-
tidimensional energy separation,” JournaloftheOpticalSoci-
ety of America {A}, vol. 12, no. 9, pp. 1867–1876, 1995.
[12] S. Beucher and F. Meyer, “The morphological approach to
segmentation: the watershed transformation,” in Mathemati-
cal Morphology in Image Processing,E.R.Dougherty,Ed.,pp.
433–481, Marcel Dekker, New York, NY, USA, 1993.
[13] A. Sofou, C. Tzafestas, and P. Maragos, “Segmentation of soil-
section images using connected operators,” in Proc. IEEE In-
ternational Conference on Image Processing, vol. 3, pp. 1087–
1090, Thessaloniki, Greece, October 2001.
[14] R.M.HaralickandL.G.Shapiro,Computer and Robot Vision,
Addison-Wesley, Reading, Mass, USA, 1992.
[15] G. B. Stamou and S. G. Tzafestas, “Fuzzy relation equa-
tions and fuzzy inference systems: an inside approach,” IEEE
Trans. Systems, Man, and Cybernet ics, vol. 29, no. 6, pp. 694–
702, 1999.
[16] G. B. Stamou and S. G. Tzafestas, “Neural fuzzy relational sys-
tems with a new learning algorithm,” Mathematics and Com-
puters in Simulation, vol. 51, no. 3, pp. 301–314, 2000.
Petros Maragos received his Ph.D. from
Georgia Tech in 1985. During 1985–1998,
he worked as a Professor of electrical and
computer engineering at Harvard U niver-
sity and Georgia Tech in the USA. Since
1998, he has been working as a Professor at
the National Technical University of Athens
(NTUA). His research interests include im-
age processing and computer vision and
speech processing and recognition.
Anastasia Sofou received her first degree in
1998 from the Department of Informatics,
University of Athens, Greece, and her M.S.
in advanced computing in 1999 from Uni-
versity of Bristol, United Kingdom. She is
currently pursuing her Ph.D. in the area of
computer vision at the National Technical
University of Athens. Her research interests
include computer vision, image processing,
image segmentation, and pattern recognition.
912 EURASIP Journal on Applied Signal Processing
Giorgos B. Stamou obtained the Diploma
and Ph.D. degrees in electrical and com-
puter Engineering from the National Tech-
nical University of Athens (NTUA) in 1994
and 1998, respectively. He is currently a Se-
nior Researcher at the NTUA Institute for
Communication and Computer Systems.
His research interests include fuzzy set the-
or y and decision making, neural networks,
hybrid intelligent systems, computer vision,
semantic video analysis, and human computer interaction.
Vassilis Tzouvaras received his B.S. degree
in 1998 from University of Essex, United
Kingdom and his M.S. degree in 1999 from
University of Sheffield, United Kingdom.
He is currently pursuing his Ph.D. at the Na-
tional Technical University of Athens. His
research interests are neural networks, com-
puter vision, fuzzy systems and inferencing,
and s emantic video analysis.
Efimia Papatheodorou is a Biologist with
a background in soil ecology. She works as
a Lecturer in the Department of Ecology,
in the Biology Department of Thessaloniki
University. Her work relates to the evalu-
ation of soil quality, in terms of biologi-
cal and biochemical parameters, in physical
and agricultural ecosystems.
George P. Stamou has a great experience
in soil biology. His work relates to pop-
ulation dynamics and community orga-
nization patterns of soil animals, effects
of global climate change on soil environ-
ments, desertification of Mediterranean-
type ecosystems, and effect of management
practices and land use on soil communities.