Defect detection of metallic samples by electromagnetic tomography using closed loop fuzzy pid controlled iterative landweber method
Bạn đang xem bản rút gọn của tài liệu. Xem và tải ngay bản đầy đủ của tài liệu tại đây (6.54 MB, 20 trang )
Nondestructive Testing and Evaluation
ISSN: (Print) (Online) Journal homepage: www.tandfonline.com/journals/gnte20
Defect detection of metallic samples by
electromagnetic tomography using closed-loop
fuzzy PID-controlled iterative Landweber method
Pu Huang, Xiaofei Huang, Zhiying Li & Yuedong Xie
To cite this article: Pu Huang, Xiaofei Huang, Zhiying Li & Yuedong Xie (12 Jan 2024): Defect
detection of metallic samples by electromagnetic tomography using closed-loop fuzzy
PID-controlled iterative Landweber method, Nondestructive Testing and Evaluation, DOI:
10.1080/10589759.2024.2304256
To link to this article: />
Published online: 12 Jan 2024.
Submit your article to this journal
Article views: 20
View related articles
View Crossmark data
Full Terms & Conditions of access and use can be found at
/>
NONDESTRUCTIVE TESTING AND EVALUATION
/>
Defect detection of metallic samples by electromagnetic
tomography using closed-loop fuzzy PID-controlled iterative
Landweber method
Pu Huang, Xiaofei Huang, Zhiying Li and Yuedong Xie
Key Laboratory of Precision Opto-mechatronics Technology of Education Ministry, School of
Instrumentation and Opto-Electronic Engineering, Beihang University, Beijing, China
ABSTRACT ARTICLE HISTORY
Received 27 September 2023
Electromagnetic tomography (EMT) uses the mutual inductance of Accepted 2 January 2024
the coil to visualise the conductivity distribution of interesting
regions. Since the conductivity of defects and metal samples are KEYWORDS
different, the metal samples with defects can be treated as binary- Electromagnetic
valued material distributions. This paper investigates the closed- tomography; defect
loop fuzzy proportional, integral and derivative (PID)-controlled detection; fuzzy PID
iterative Landweber method. The whole method includes fuzzy controller; Landweber
PID controller, the Landweber reconstruction method, and the method; image
Dirichlet-to-Neumann map. Specifically, the differential signal reconstruction
between the mutual inductance of the coil and the feedback signal
is used as the input of the fuzzy PID controller. The fuzzy controller
can automatically adjust three parameters (Kp, Ki and Kd) of PID
controller. Subsequently, the output of the PID controller can
serve as the input of the Landweber algorithm to reconstruct the
distribution of conductivity. Furthermore, the Dirichlet-to-
Neumann map is used to calculate the mutual inductance, acting
as the feedback signal based on the reconstruction conductivity
distribution. Finally, both the numerical simulation and experi
ments are applied to verify the proposed method. The results
indicate that the proposed method can reconstruct the image
with a clear edge, and the average correlation coefficient can
reach 0.792.
1. Introduction
During the service process, metal materials are prone to defects due to corrosion,
compression and wear, resulting in potential safety hazards. Non-destructive testing
can provide effective defect information without damaging the structure of metal mate
rials [1]. Compared to other technologies, electromagnetic non-destructive testing has
the advantages of non-contact and high sensitivity. Traditional electromagnetic non-
destructive testing equipment generally adopts a single sensor, and the sensor or metal
plate needs to be moved during testing, which takes a long time and requires the
corresponding mechanical devices [2–5]. It not only easily causes detection errors but
also cannot meet the requirements of real-time performance. Compared with the single
CONTACT Yuedong Xie
© 2024 Informa UK Limited, trading as Taylor & Francis Group
2 P. HUANG ET AL.
sensor structure, the multi-sensor detection can improve the detection accuracy and
efficiency by increasing the number of sensors [6,7].
Electromagnetic tomography (EMT) is a kind of non-destructive testing technology,
which has the advantages of non-contact, visualisation and fast imaging [8,9]. It is widely
used in the field of defect detection, multiphase flow measurement, biomedical and other
fields. The EMT system mainly consists of sensor arrays, the data acquisition system and
image reconstruction algorithm.
In fact, the ultimate goal of EMT technology is to obtain the spatial distribution of
materials with different conductivities. There are two key problems, i.e. the forward
problem and the inverse problem, that need to be solved. The inverse problem of
EMT is to solve the distribution of conductivity according to the measured voltage
and prior sensitivity matrix, that is image reconstruction [10–13]. Due to the fact that
the electromagnetic sensitive field of EMT exhibits nonlinear property, it is difficult to
directly solve it. Meanwhile, the EMT inverse problem belongs to the Fredholm
integral equation of the first kind. Its solution is ill-conditioned, which limits the
development of EMT. In practice, image reconstruction algorithms of EMT technol
ogy can be divided into iterative and non-iterative algorithms. Non-iterative algo
rithms include linear back projection (LBP), Tikhonov regularisation and truncated
singular value decomposition [14–16]. The LBP algorithm is simple and has fast
imaging speed, but the accuracy of image reconstruction is relatively low. It is suitable
for online rapid qualitative imaging, but cannot provide accurate quantitative infor
mation. The regularisation method is an effective method to overcome the ill-posed
problem of EMT. However, the parameters of the regularisation method are selected
based on experience. The iterative algorithms mainly include Landweber iteration,
algebraic reconstruction technique (ART), simultaneous iterative reconstruction tech
nique (SIRT) and so on [17–19]. The ART and SIRT are commonly used algebraic
iteration methods, which require a higher number of iterations to achieve better
image reconstruction results. The Landweber iterative algorithm is based on the
principle of steepest descent and is the most commonly used iterative algorithm for
solving the inverse problem of EMT. However, it requires multiple iterations and has
a slow rate of convergence. In recent years, Zhang et al. investigated the compatible
multi-template supervised descent method to monitor the structural information of
CFRP (Carbon Fiber Reinforced Polymer) [20]. Liu et al. designed a novel L-type
sensor and three-layer array eddy current sensor combined with LBP method to
inspect the defect of the wheel [21,22]. Moreover, Liu et al. investigated image
reconstruction algorithms combining deep learning and optimised fully connected
net to learn image reconstruction of EMT [23]. Wang et al. investigated the sparse
regularisation method to improve the EMT image reconstruction quality [24]. Ma and
Soleimani researched the dual-plane magnetic induction tomography method to
locate the damage of composite parts [25,26]. Besides that, Soleimani improved the
reconstruction quality of EMT image using the Kalman filtering method [27]. Teniou
et al. proposed the constrained Landweber algorithm to improve image reconstruc
tion, which uses both boundary data and the foreground–background fractions [28].
Wang et al. developed a novel EMT system based on FPGA (Field Prog ram mable
Gate Array), which uses TMR (Tunnel Magneto Resistance) sensors instead of tradi
tional coils [29,30]. Meanwhile, the improved Landweber iterative algorithm is
NONDESTRUCTIVE TESTING AND EVALUATION 3
investigated to improve the quality of image reconstruction [31]. Tamburrinoa et al.
proposed non-iterative monotonic imaging algorithm for defect detection, and the
method can be simplified using the geometric symmetry characteristics of the
detected object [32].
In this paper, a closed-loop fuzzy proportional, integral and derivative (PID)-
controlled iterative Landweber reconstruction method is proposed. The whole recon
struction method includes a fuzzy PID controller, the Landweber method and the
Dirichlet-to-Neumann map. The differential signal between the measurement and the
feedback signal is fed into the fuzzy controller, and the fuzzy controller can adjust the
parameters of PID. The output of PID acts as the input of the Landweber algorithm to
reconstruct the distribution of conductivity. Based on the distribution of conductivity,
the boundary mutual inductance can be calculated by the Dirichlet-to-Neumann map,
which is the feedback signal. The closed-loop structure can improve the quality of
reconstructed images. The proposed method can achieve three-dimensional imaging
for metallic defects, which is conducive to quantitative evaluation of defect size and
thus avoids the occurrence of accidents in practice.
2. Fundamental methods
In EMT systems, image reconstruction algorithms reconstruct the field distribution
based on boundary measurement values and sensitivity matrices. The factors that affect
the quality of image reproduction mainly include two parts: software and hardware
systems. The hardware system mainly includes the rationality, accuracy and anti-
interference ability of each part of the system design. The software mainly includes
image reconstruction algorithms, whose performance directly determines the final ima
ging quality and is the core of EMT.
If EMT is approximated as a linear system, its forward problem can be expressed as
Equation (1).
U ¼ SG (1)
The greyscale value G of the reconstructed image can be obtained by Equation (2) if the
inverse matrix of S is assumed to exist.
G ¼ SÀ 1U (2)
However, the inverse matrix of S cannot be directly obtained in the inverse problem of
EMT due to the ill-condition. The image reconstruction algorithm can also be seen as
a process of approximating the inverse matrix of S, so the imaging accuracy is limited to
some extent [33].
The Landweber iterative algorithm has good imaging accuracy, which is widely applied to
image reconstruction for EMT. The Landweber iterative algorithm transforms the
original problem into an optimisation problem, which can be expressed as Equation (3).
min f Gị ẳ 1 kSG Uk2 (3)
2
Equation (3) can be converted to finding the minimum value of equation (4).
4 P. HUANG ET AL.
Figure 1. The sketch map of the proposed PID-controlled iterative Landweber method.
f Gị ẳ 1 SG UịTSG Uị ẳ 1 GTSTSG 2GTSTU ỵ UTUị (4)
2 2
Therefore, the Landweber algorithm takes the negative direction of the gradient as the
optimisation search direction, and the iterative formula can be expressed as,
�
G0 ¼ STU (5)
Gkỵ1 ẳ Gk À αkSTðSGk À UÞ
3. Fuzzy PID-controlled iterative Landweber method
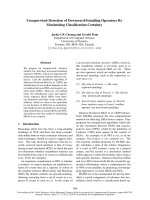
Figure 1 illustrates the sketch map of the proposed fuzzy PID-controlled iterative
Landweber method for image reconstruction in EMT. The mutual inductances of coils
are measured, and the matrix form of the discretized boundary map (Dirichlet-to-
Neumann map) is established. The measured signal is compared with the feedback signal
and is further fed into the fuzzy controller, which can be used to adjust the parameters of
PID to yield an input for the Landweber method. The Landweber method reconstructs
the image based on the measured mutual inductances. Subsequently, the reconstructed
image is normalised to obtain a feedback Dirichlet-to Neumann map for comparison
with the measured signal. The iteration termination is determined by the difference
between the reconstructed conductivity distribution of the current iteration and the
previous one. When the difference of the reconstructed conductivity distribution is less
than the threshold, the reconstructed conductivity distribution can be the output. The
closed-loop structure can ensure the convergence of the iterations, and the proposed
robust method can be achieved for conductivity distribution.
3.1 Fuzzy PID controller
The proposed reconstruct algorithm adopts fuzzy PID controller to reduce diver
gence between the reconstructed image and the measured Dirichlet-to-Neumann
image. The fuzzy PID control utilises fuzzy logic to optimise the parameters of the
PID controller in real time based on certain fuzzy rules. The fuzzy PID controller
NONDESTRUCTIVE TESTING AND EVALUATION 5
can overcome the disadvantage of traditional PID parameters that cannot be
adjusted in real time. Specifically, the deviation is input into the controller and is
fuzzificated into the fuzzy set using the membership function. Fuzzy reasoning is
applied by following fuzzy rules to yield a fuzzy set of output. Finally, it is
defuzzified to update the PID coefficients. The three parameters of the PID con
troller are updated during each iteration. The input and output of the fuzzy PID
controller can be expressed as,
qNNiị ẳ KpiịẵpNNiị pNNi 1ị ỵ KIiịpNNiị (6)
ỵ KDiịẵpNNiị 2pNNi 1ị ỵ pNNi 2ị
where i is the number of iterations. KpðiÞ, KIðiÞ and KDðiÞ denote the proportional,
integral and derivative parameters of PID controller in ith iteration. pN�NðiÞ is the
difference between the measured mutual inductance matrix Mmeasure and the feedback
mutual inductance matrix Mfb, which is the input of the fuzzy PID controller.
qNNiị ẳ qNNiị qN�Nði À 1Þ is the output of the fuzzy PID controller.
The input of fuzzy PID controller are e1ðiÞ and e2ðiÞ, which are related with pNNiị and
can be expressed as,
e1iị ẳ kpN�NðiÞk2 (7)
e2iị ẳ e1iị 2e1i 1ị þ e1ði À 2Þ (8)
In fact, the Gaussian membership function has the characteristics of continuity and
smoothness, which can improve the accuracy of the membership function and make the
output of the fuzzy controller more accurate. Meanwhile, the Gaussian membership
function can effectively solve ambiguity and uncertainty, such as noise interference.
Hence, the Gaussian membership function is adopted, and the Gaussian membership
values for these two inputs are,
� �2
À e1À a1ðhÞ
1i; hị ẳ e 1hị (9)
� �2
À e2À a2ðhÞ (10)
2 hị
2i; hị ẳ e
where μ1ði; hÞ and μ2ði; hÞ are the membership function of the two fuzzy PID controller
inputs e1ðiÞ and e2ðiÞ in the hth fuzzy value. a1ðhÞ and a2ðhÞ are the central value of the
hth Gaussian curve of e1ðiÞ and e2ðiÞ. Besides that, σ1ðhÞ and σ2ðhÞ are the standard
deviations of the hth Gaussian curve.
The fuzzy rules are adopted to adjust the parameters of PID controller, i.e. Kp, KI and KD.
Firstly, the range of input of fuzzy controller (e1ðiÞ and e2ðiÞ) and PID parameters can be
estimated by FEM (Finite Element Method) numerical solution. The fuzzy sets should be
able to cover the entire range of inputs and outputs. Furthermore, the number of rules
can be determined to cover all possible input conditions. A large number of fuzzy rules
can lead to overfitting, while a small number of rules may reduce the control accuracy.
Finally, according to the performance of the system, the parameters of fuzzy control
6 P. HUANG ET AL.
rules, such as membership function parameters, need to be adjusted using FEM numer
ical solution.
Assuming that the hth fuzzy value contains a total of m combinations, the membership
degree of the hth fuzzy value is
Xm
outi; hị ẳ 1i; hjịị2i; hðjÞÞ
j¼1 (11)
� �2 � �2
Pm À e1À a1ðhÞ À e2À a2ðhÞ
e σ 1 ðhÞ e
σ 2 ðhÞ
j¼1
where μoutði; hÞ is the membership value of output parameters, and μ1ði; hðjÞÞ and
μ2ði; hðjÞÞ denote the membership value of e1ðiÞ and e2ðiÞ in the hðjÞ fuzzy value.
The centroid method is used for defuzzification, which can be expressed as,
Xn , Xn
outiị ẳ outi; hÞλðhÞ μoutði; hÞ (12)
h¼1 h¼1
where n is the number of fuzzy values and λðhÞ is the hth fuzzy value of output. The
μoutðiÞ is the output of the fuzzy controller in the ith iteration. Hence, KpðiÞ, KIðiÞ and
KDðiÞ of PID controller in the ith iteration can be calculated as,
8 Pn � Pn
>
>>> KPðiÞ ¼ μPoutði; hÞλPðhÞ μoutði; hÞ
>>>< h¼1 Pn � h¼1
KIiị ẳ Iouti; hịIhị Pn μoutði; hÞ (13)
>>> h¼1 �h¼1
>>>
Pn Pn
>: KDiị ẳ Douti; hịDhị μoutði; hÞ
h¼1 hẳ1
where Pouti; hị, Iouti; hÞ and μDoutði; hÞ are the hth membership values of PID con
troller parameters KpðiÞ, KIðiÞ and KDðiÞ in the ith iteration. λPðhÞ, λIðhÞ and λDðhÞ are
the corresponding fuzzy values.
3.2 Iterative Landweber method based on a fuzzy PID controller in the closed-loop
control
The Dirichlet-to-Neumann map can be expressed as a mutual inductance matrix mea
sured on the coil Mmeasure when the conductivity distribution of sensing region is σðzÞ.
�
M @ΩðzÞ� measure : φðzÞj@Ω ! σðzÞ �� (14)
@n @
where z ẳ x ỵ yi is the coordinate of point ðx; yÞ. @Ω is the boundary of sensing region,
and n is the unit normal vector of region boundary.
Apart from that, M0 denotes the mutual inductance matrix of coil when the conductivity
of sensing region Ω is conductivity of metal samples. The difference signal
ΔM ¼ Mmeasure À M0, i.e. variation of mutual inductance matrices, is the input of the
NONDESTRUCTIVE TESTING AND EVALUATION 7
reconstruction algorithm. In addition, the Dirichlet-to-Neumann map can be calculated
by the finite element model.
Since the reconstructed image of metallic samples with defects can be regarded as binary
image, if only step function is used to achieve binarization, it will lead to closed-loop
instability. Considering that the output of sigmoid function ranges from 0 to 1 and the
sigmoid function has the characteristic of smooth output, it can be applied to binariza
tion of the reconstructed conductivity distribution. The sigmoid function can be writư
ten as,
GBiị ẳ 1ỵe 1 (15)
À aðGN ðiÞÀ 0:5Þ
where GBðiÞ and GNðiÞ are the reconstructed conductivity distribution before and after
normalisation. a is the coefficient of the sigmoid function.
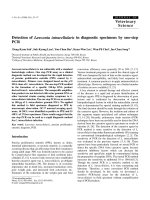
Figure 2 depicts the flow chart of the proposed closed-loop PID reconstruction
algorithm, and specific details are as follows:
(1) Mutual inductance matrices of metal samples M0 and measured field Mmeasure are
obtained by EMT sensor. Furthermore, the difference signal ΔM ¼ Mmeasure À M0
is calculated, which is the input of the proposed method. Meanwhile, the para
meters of fuzzy PID controller are initialised.
(2) The ith feedback mutual inductance matrices Mfb can be calculated according to
ith reconstructed conductivity distribution using the Dirichlet-to-Neumann map.
The corresponding mutual inductance variation ΔM0 is obtained by subtracting
M0 from Mfb. Above all, the ith mutual inductance difference matrix pN�NðiÞ
between the ΔM and ΔM0 is acquired, which is input to the fuzzy PID controller
and outputs ΔqN�NðiÞ based on Equation (6).
(3) The Landweber algorithm is applied to reconstruct conductivity distribution, and
the conductivity distribution GBðiÞ can be normalised by the sigmoid function.
The iterations can be terminated until the k GBðiÞ À GBði À 1Þ k2 is smaller than
threshold T, and the final reconstructed conductivity distribution GBðiÞ is output.
4. Simulation and discussion
In this section, the simulations are carried out to determine the parameters and
evaluate the proposed method. As shown in Figure 3, the EMT sensor adopts nine
planar coils, which are arranged in a structure of 3 × 3. The sensor is located
above the copper samples with defects. The air region surrounds the sample and
the sensor to ensure the boundary conditions. The parameters of sensor array are
listed in Table 1. The materials of samples are adopted as copper in simulations.
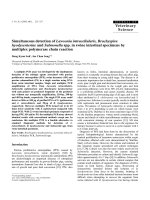
As shown in Figure 4, four typical different defect distributions are involved to
verify the performance of the proposed reconstruction method. Specifically, four
typical conductivity distributions are single central defect, single non-central
defect, two edge defects and four edge defects. The thickness of the samples is
5 mm, and the depth of defect is 2 mm. In addition, the red region in Figure 4 is
copper with 58 MS/m. The blue region is defect, and the conductivity of defect is
8 P. HUANG ET AL.
Figure 2. The flow chart of the proposed closed-loop PID reconstruction algorithm.
0.1 S/m. The conductivity of copper is 58 MS/m, and the conductivity of defect
(air) is close to 0 MS/m. Hence, the conductivity of defects is about 10 orders of
magnitude smaller than that of copper. In other words, as long as the conductiv
ity of the defect is set small enough, the impact on the reconstruction results is
negligible. The position and number of defects are different, which includes single
central defect, single non-central defects, two defects, and four defects. In order
to evaluate the quality of the reconstructed image, the correlation coefficient
(Cor) is applied and defined as,
NONDESTRUCTIVE TESTING AND EVALUATION 9
Figure 3. The planer EMT sensor in FEM.
Table 1. The dimension of the coil in the EMT
sensor.
Inner and outer radii of the coil 3 mm/5 mm
Height of the coil 5 mm
Spacing between coils 10 mm
Lift-off 1 mm
Figure 4. Four typical conductivity distributions.
iẳ1 Pn GRiị GRịGTiị GTị
Cor ẳ qffiffiffiffiffiffiffiffiffiffiffiffiffiffiffiffiffiffiffiffiffiffiffiffiffiffiffiffiffiffiffiffiffiffiffiffiffiffiffiffiffiffiffiffiffiffiffiffiffiffiffiffiffiffiffiffiffiffiffiffiffiffiffiffiffiffiffiffiffiffiffiffiffiffiffiffiffiffifi (16)
Pn � 2 Pn 2
iẳ1 GRiị GRị iẳ1 GTiị GTÞ
where GR represents the grey value of the reconstructed image and GT is the actual
grey value of the image. n denotes the number of pixels in the image. In addition, G�R and
G�T are the average grey values of GR and GT, respectively.
The correlation coefficient ranges from 0 to 1. The closer the correlation coeffi
cient of the reconstructed image is to 1, the better the quality of the reconstruc
tion image. If the correlation coefficient is much less than 1, the quality of
reconstruction will be worse.
10 P. HUANG ET AL.
4.1 Determination of parameters in fuzzy PID controller and smooth function
The reconstruction image deviation e1ðiÞ and cumulative deviation e2ðiÞ are used as
inputs of the fuzzy PID controller. The PID parameters KpðiÞ, KIðiÞ and KDðiÞ are the
outputs of the control system. The fuzzy inference method is used to adaptively adjust
PID parameters online to meet the error requirements of the reconstructed images.
Firstly, it can observe the dynamic characteristics of the system through closed-loop
operation or simulation and repeatedly debug the parameters to determine the PID
control parameters based on the impact of each parameter on the system until
a satisfactory response occurs. These parameters are set as the initial parameters of the
adaptive fuzzy PID controller. Since this range matches the input of the fuzzy controller,
the PID parameters can be quickly adjusted. The parameters of the algorithm can be
determined through extensive simulation testing. e1 and e2 belongs to ½À 0:12; 0:12�, Kp is
with ½À 1; 1�, KI belongs to ½À 1; 1�, Kd belongs to ½À 0:1; 0:1�.
Due to the simple operation and low memory consumption, Gaussian membership
functions are chosen as membership functions for input and output variables. Taking the
distribution of four defects as an example, we determine the number of fuzzy subsets
through FEM numerical simulation. Figure 5 illustrates the reconstructed results of four
defects with different numbers of fuzzy subsets. When the number of fuzzy subsets is five,
the reconstructed result converges after approximately 40 iterations and the accuracy is
relatively low. As the number of fuzzy subsets increases, the accuracy of imaging
gradually improves. However, the larger the number of fuzzy subsets, the larger the
computation. In addition, it can also easily lead to overfitting. When the number of fuzzy
subsets is seven, the distribution of the four defects can be seen more accurately and the
computation amount is relatively small. Here, a total of seven fuzzy subsets were selected
as Gaussian membership functions, namely NB, NM, NS, ZO, PS, PM and PB. Moreover,
the letters N, B, M, S, ZO and P denote negative, big, small, zero and positive, respec
tively. For instance, since the range of e1 is ½À 0:12; 0:12�, the fuzzy values of NB, NM, NS,
ZO, PS, PM and PB are −0.12, −0.08, −0.04, 0, 0.04, 0.08 and and 0.12, respectively.
Besides that, the Mamdani fuzzy inference model is used in the fuzzy inference of the
system, and the centroid method is applied for the defuzzification of the fuzzy PID
controller.
In fact, the parameter a of sigmoid function is also analysed, which is related to
the effect of smooth segmentation. Figure 6 shows the sigmoid function with
different values a. As can be seen from Figure 6, the larger the parameter a, the
steeper the sigmoid function. Due to the difference in segmentation functions, the
Figure 5. The reconstructed results of four defects with different numbers of fuzzy subsets. (a) 5 fuzzy
subsets, (b) 7 fuzzy subsets, (b) 9 fuzzy subsets and (b) 11 fuzzy subsets.
NONDESTRUCTIVE TESTING AND EVALUATION 11
Figure 6. The sigmoid function with different values of a.
Figure 7. The image reconstruction results of the proposed method with different values of a.
image reconstruction results of the proposed method with different a are depicted
in Figure 7. It can be observed that the increased slope improves reconstruction
image quality in the centre region. As shown in Figure 8, the correlation coeffi
cient of the reconstruction image Cor firstly increases and then decreases with the
increase in coefficient a. When coefficient a equals 40, the correlation coefficient
of the reconstructed image reaches its maximum, i.e. 0.9. When a = 80, it is easy
to cause oscillation in the reconstructed image, resulting in a position shift and
a decrease in the correlation coefficient of the reconstructed image. Hence, in the
subsequent algorithm validation, the selection of coefficient a is selected as 40 for
the segmentation function.
If the smooth segmentation is not introduced, severe oscillations appear, and it
makes the closed loop unstable. In this case, it is necessary to choose the
appropriate algorithm parameters to ensure the stability of the closed-loop struc
ture. When the appropriate parameters are adopted, the reconstructed result of
the single central defect without the smooth segmentation is shown in Figure 9.
The reconstructed area is correct, but the edges are not smooth. Moreover, the
correlation coefficient is only 0.7981, which is lower than the results with the
smooth segmentation.
12 P. HUANG ET AL.
Figure 8. The correlation coefficient of the reconstruction image with different values of a.
Figure 9. The reconstructed result of the single central defect without the smooth segmentation. (a)
Three views and (b) vertical view.
4.2 Image reconstruction using simulation data
In order to evaluate the proposed reconstruction method, three other typical algorithms,
i.e. LBP, Landweber and L1 regularization method, are also used for comparison. The
maximum iteration number of Landweber and L1 regularization is set to 500, and the
�T
factor is calculated as 2 S S. Meanwhile, the termination criterion of the proposed
method and other iterative algorithms (Landweber and L1 regularization) is
kΔGBðiÞk < 0:05. The reconstructed images of different conductivity distributions are
shown in Figure 10, and the corresponding correlation coefficients of reconstructed
images are listed in Table 2.
NONDESTRUCTIVE TESTING AND EVALUATION 13
Figure 10. The reconstructed images of four distributions using different algorithms in simulation.
Table 2. The correlation coefficient of reconstruction images using different algorithms in simulation.
Algorithms Single central defect Single non-central defect Two edge defects Four edge defects
LBP 0.2764 0.6470 0.4710 0.3853
L1 regularization method 0.8399 0.8256 0.6623 0.3963
Landweber 0.8848 0.7991 0.8236 0.3979
Proposed method 0.9037 0.8382 0.8528 0.7443
The advantage of LBP is fast computation speed, but it cannot reconstruct clear contour
boundaries. Besides that, it is not possible to accurately obtain good reconstruction results
for central defects due to the uneven distribution of sensitivity fields. The quality of
reconstructed images using Landweber and L1 regularisation algorithms has significantly
improved, especially in the distribution of central defects, edge defects and two central
defects. The correlation coefficients are large than 0.8. As shown in Figure 11, the middle
position of the imaging region has a higher sensitivity. Hence, the defect region will gather
toward the center as the number of iterations increases, forming artefacts in the middle
region for center four defects reconstruction. Compared with other reconstruction meth
ods, the reconstructed results using the fuzzy PID-controlled iterative Landweber method
have clear contour boundaries. Correspondingly, there is also a small increase in the
correlation coefficient of the reconstructed image obtained by the proposed method.
More importantly, fuzzy PID-controlled iterative Landweber method can achieve an
accurate imaging of four defects and eliminate artefacts. The reason for the phenomenon
is that the closed-loop structure weakens the impact of high sensitivity in the central region
by adjusting the mutual inductance data of the reconstructed conductivity distribution.
14 P. HUANG ET AL.
Figure 11. Sensitivity distribution of EMT sensors.
5. Experiment
5.1 Experiment setup
In order to verify the proposed method, the experiment is also carried out using the EMT
system. Specifically, the EMT system shown in Figure 12 mainly consists of a host PC,
multi-channel eddy current equipment, 9-coil sensor array, and metal samples with
defects. The EMT measurement equipment uses digital excitation signals and digital
signal demodulation in FPGA to improve data speed and signal-to-noise ratio, which can
meet the requirement of real-time measurements. Meanwhile, the measurement speed of
the equipment can reach 131 frames/s and the signal-to-noise ratio (SNR) can be reach
65 dB for stable measurement.
In our previous research, the parameters of nine-coil sensor array are optimised to
improve the uniformity of the sensitive field by orthogonal tests and response surface
methodology [34]. Specifically, the inner and outer radii of coils are 3 mm and 5 mm. The
Figure 12. EMT experiment setup.
NONDESTRUCTIVE TESTING AND EVALUATION 15
lift-off and height of coil are 1 mm and 5 mm, and the distance between adjacent coils is
10 mm. Moreover, the turns of coils are 200, and the excitation current is set as 6A. The
copper plates with different defect distributions are manufactured to verify the proposed
method. Consistent with the defect distribution in the simulation, the four typical defect
distributions are single central defect, single non-central defect, two edge defects and four
edge defects. The thickness of the samples is 5 mm, and the depth of defect is 2 mm.
5.2 Image reconstruction using experiment data
Experiments are carried out using EMT system and 9-coil sensor array. In the proposed
reconstruction algorithm, the coefficient a of segment function is set to 40, which is
estimated by multiple simulation tests. The termination criterion of the iterative algo
rithm is also kΔGBðiÞk < 0:05, and the maximum iteration number is 500. The factor of
�T
Landweber and L1 regulation method is calculated as 2 S S.
As depicted in Figure 13, four metal samples with different defect distributions are
reconstructed by different methods. Similar to the results of reconstruction using simu
lation data, the LBP method only can roughly describe the contour of defects and has
a low imaging accuracy. Moreover, the central defect cannot be distinguished well. For
simple distributions, such as single defect distributions (i) and (ii) and double defect (iii),
the L1 regularization and Landweber can obtain the location and size of defects, only
slightly unclear at the edges of the defect. The fuzzy PID-controlled iterative Landweber
method improves the contour of defect imaging. Compared with the traditional
Landweber, the reconstruction results of the proposed method contain fewer artefacts
in distribution (iv). Table 3 lists the correlation coefficients of the reconstructed images
Figure 13. The reconstructed images of four distributions using different algorithms in the
experiment.
16 P. HUANG ET AL.
Table 3. The correlation coefficient of reconstruction images using different algorithms in the
experiment.
Algorithms Single central defect Single non-central defect Two edge defects Four edge defects
LBP 0.2715 0.6507 0.4310 0.3752
L1 regularization method 0.7939 0.7896 0.7223 0.3913
Landweber 0.8109 0.7901 0.7326 0.3929
Proposed method 0.8188 0.8145 0.8091 0.7354
using different methods. The average correlation coefficient of the proposed method is
0.792. For simple defect distribution, the imaging quality of the proposed method is
slightly higher than that of the imaging method. For complex defect distributions (four
defects), the results of other imaging methods contain central region artefacts. The
closed-loop structure can eliminate artefacts and obtain more accurate imaging results.
Compared to the traditional Landweber algorithm, the proposed method can reconstruct
the distribution of four defects well, and the imaging results have improved by 87.2%
using the proposed method. Taking the distribution of four defects as an example, the
image reconstruction quality and parameter changing trend of the proposed method is
further analyzed. As shown in Figure 14, the three parameters of the PID controller
gradually decrease and eventually reach 0 during the iteration process. Correspondingly,
the correlation coefficient of the reconstructed image gradually increases in a zigzag
pattern. When the number of iterations reaches about 20, the change in correlation
coefficient is very weak and the reconstruction result reaches stability and converges. The
above phenomenon can be explained as the closed-loop negative feedback structure
continuously eliminating residuals. Fuzzy control adjusts the three parameters of PID
based on the magnitude of the differential signal. As the number of iterations increases,
the three parameters of PID control eventually converge to 0 and the reconstruction
result ultimately reaches stability. In addition, the initial values and fuzzy rules of PID
control for different defect reconstructions are the same and the reconstruction results
for both simple and complex defect distributions ha been improved, which indicate that
the proposed method has robustness.
Figure 14. The image reconstruction quality and parameters’ changing trend: (a) parameters of PID
controller and (b) correlation coefficient.
NONDESTRUCTIVE TESTING AND EVALUATION 17
In fact, the fuzzy PID-controlled iterative Landweber method needs to calculate the
positive problem, i.e. Dirichlet-to-Neumann map. The process requires a certain amount
of time, thereby reducing the speed of computation. In future research, we will focus on
fast computation of forward problems to make the proposed reconstruction algorithm
more applicable.
Conclusion
This paper proposed an image reconstruction algorithm for defect detection in EMT. The
method mainly consists of fuzzy PID controller, Landweber method, smooth segmenta
tion and Dirichlet-to-Neumann map, which can effectively improve the quality of image
reconstruction. Specifically, the differential signal between the measurement signal of coil
array and feedback signal is applied as the input of the fuzzy PID controller. The fuzzy
controller can automatically adjust the three parameters of the PID controller and
accelerate convergence rate of closed-loop structure. Subsequently, the Landweber algo
rithm invert the output signal of the PID controller into reconstructed conductivity
distribution. Furthermore, the Dirichlet-to-Neumann map is used to calculate feedback
signal. Both numerical simulations and experiments are used to evaluate the proposed
method. Compared with the traditional image reconstruction algorithm, artefacts can be
effectively reduced, and the correlation coefficient of four defect distribution can be
improved to 87.2% using the proposed method. Besides that, the proposed method is
suitable for both simple and complex defect distribution, which demonstrates that the
method has robustness.
Disclosure statement
No potential conflict of interest was reported by the author(s).
Funding
This work was supported by the Fundamental Research Funds for the Central Universities [KG12-
1124-01]; National Natural Science Foundation of China [62271022]; Academic Excellence
Foundation of BUAA for Ph.D. Students.
References
[1] Rahman MSU, Hassan OS, Mustapha AA, et al. Inspection of thick composites:
a comparative study between microwaves, X-ray computed tomography and ultrasonic
testing. Case Stud Nondestr Test Eval. 2023. doi:10.1080/10589759.2023.2287071
[2] Guo P, Wang C, Li Y. Defect classification using phase lag information of EC-GMR output.
Case Stud Nondestr Test Eval. 2014;29(3):229–242. doi: 10.1080/10589759.2014.914209
[3] Poorarbabi A, Ghasemi M, Azhdary Moghaddam M. Concrete compressive strength pre
diction using neural networks based on non-destructive tests and a self-calibrated response
surface methodology. J Nondestruct Eval. 2020;39(4):78. doi: 10.1007/s10921-020-00718-w
[4] Yuan F, Yu Y, Wang W. Pulsed eddy current array design and electromagnetic imaging for
defects detection in metallic materials. Case Stud Nondestr Test Eval. 2022;37(1):81–99. doi:
10.1080/10589759.2021.1909012
18 P. HUANG ET AL.
[5] Li E, Kang Y, Tang J, et al. A new micro magnetic bridge probe in magnetic flux leakage for
detecting micro-cracks. J Nondestruct Eval. 2018;37(3):46. doi: 10.1007/s10921-018-0499-8
[6] Yang B, Li X. Nondestructive testing of moisture separator reheater tubing system using hall
sensor array. Case Stud Nondestr Test Eval. 2010;25(1):3–12. doi: 10.1080/
10589750802613347
[7] Sun K, Tao Y, Tao X, et al. Pulsed remote eddy current field array technique for non
destructive inspection of ferromagnetic tube. J Nondestruct Eval. 2018;41(1):27. doi: 10.
1007/s10921-022-00858-1
[8] Huong Pham M, Peyton A. A model for the forward problem in magnetic induction
tomography using boundary integral equations. IEEE Trans Magn. 2008;44
(10):2262–2267. doi: 10.1109/TMAG.2008.2003142
[9] Cui Z, Chen Y, Wang H. Huaxiang Wang. A dual-modality integrated sensor for electrical
capacitance tomography and electromagnetic tomography. IEEE Sens J. 2019;19
(21):10016–10026. doi: 10.1109/JSEN.2019.2927629
[10] Soleimani M, Lionheart WRB, Pyeton AJ. Image reconstruction for high-contrast conduc
tivity imaging in mutual induction tomography for industrial applications. IEEE Trans
Instrum Meas. 2007;56(5):2024–2032. doi: 10.1109/TIM.2007.895598
[11] Chen Z, Salas-Avila JR, Tao Y, et al. A novel clustering-based filter for impulsive noise
reduction in electromagnetic tomography (EMT). AIP Adv. 2020;10(10):105118. doi: 10.
1063/5.0018699
[12] Zhao Q, Chen G, Hao J, et al. Numerical approach for the sensitivity of a high-frequency
magnetic induction tomography system based on boundary elements and perturbation
method. Meas Sci Technol. 2013;24(7):074004. doi: 10.1088/0957-0233/24/7/074004
[13] Zhen X, Huang J, Jiang Y, et al. An image reconstruction algorithm for a 12-electrode
capacitively coupled electrical resistance tomography system under 2-electrode excitation
strategy. IEEE Trans Instrum Meas. 2021;70:4505911. doi: 10.1109/TIM.2021.3098388
[14] Wang J, Wang X. Application of particle filtering algorithm in image reconstruction of
EMT. Meas Sci Technol. 2015;26(7):075303. doi: 10.1088/0957-0233/26/7/075303
[15] Zhiyi S, Ventrea S, Udpa L, et al. Monotonicity based imaging method for time-domain
eddy current problems. Inverse Problems. 2017;33(12):125007. doi: 10.1088/1361-6420/
aa909a
[16] Liu X, Wang Y. Ying Wang. An improved conjugate gradient image reconstruction algo
rithm for electromagnetic tomography. Sens Imaging. 2022;23(1):5. doi: 10.1007/s11220-
021-00374-y
[17] Liu Z, Yang G, Nan H, et al. Landweber iterative algorithm based on regularization in
electromagnetic tomography for multiphase flow measurement. Flow Meas Instrum.
2012;27(SI):53–58. doi: 10.1016/j.flowmeasinst.2012.04.011
[18] Liu X, Liu Z, Yue Y. Simulation research of impact of number of coils in EMT sensors on
reconstructed images quality. Sens Imaging. 2019;27(20):27. doi: 10.1007/s11220-019-0250-
2
[19] Huo J, Yin W, Zhao Q, et al. Preconditioning of projected SIRT algorithm for electromag
netic tomography. Flow Meas Instrum. 2013;29:39–44. doi: 10.1016/j.flowmeasinst.2012.10.
007
[20] Zhang R, Fang H, Zhang Q, et al. In situ damage monitoring of CFRPs by electromagnetic
tomography with the compatible multitemplate supervised descent method. IEEE Trans
Instrum Meas. 2023;72:4501912. doi: 10.1109/TIM.2023.3242001
[21] Liu Z, Li W, Xue F, et al. Electromagnetic tomography rail defect inspection. IEEE Trans
Magn. 2015;51(10):6201907. doi: 10.1109/TMAG.2015.2430283
[22] Liu X, Liu Z, Yong L, et al. Research on Direct 3D Electromagnetic Tomography Technique.
IEEE Sens J. 2020;20(9):4558–4767. doi: 10.1109/JSEN.2020.2966274
[23] Xiao J, Liu Z, Zhao P, et al. Deep learning image reconstruction simulation for electro
magnetic tomography. IEEE Sens J. 2018;18(8):3290–3298. doi: 10.1109/JSEN.2018.2809485
NONDESTRUCTIVE TESTING AND EVALUATION 19
[24] Wang Q, Li K, Zhang R, et al. Sparse defects detection and 3D imaging base on electro
magnetic tomography and total variation algorithm. Rev Sci Instrum. 2019;90:124703. doi:
10.1063/1.5120118
[25] Ma L, Soleimani M. Hidden defect identification in carbon fiber reinforced polymer plates
using magnetic induction tomography. Meas Sci Technol. 2014;25(5):055404. doi: 10.1088/
0957-0233/25/5/055404
[26] Ma L, Hunt A, Soleimani M. Experimental evaluation of conductive flow imaging using
magnetic induction tomography. Int J Multiphase Flow. 2015;72:198–209. doi: 10.1016/j.
ijmultiphaseflow.2015.02.013
[27] Soleimani M. Improving the temporal resolution of magnetic induction tomography for
molten metal flow visualization. IEEE Trans Instrum Meas. 2010;59(3):553–557. doi: 10.
1109/TIM.2009.2024704
[28] Teniou S, Meribout M, AI-Wahedi K, et al. A near-infrared-based magnetic induction
tomography solution to improve the image reconstruction accuracy in opaque
environments. IEEE Trans Magn. 2013;49(4):1361–1366. doi: 10.1109/TMAG.2012.2232301
[29] Wang C, Song Y, Zhang X, et al. A solution to TMR-EMT blind spots based on biaxial TMR.
IEEE Trans Instrum Meas. 2023;72:1–10. doi: 10.1109/TIM.2023.3250300
[30] Guo Q, Jiamin Y, Wang C, et al. An Ill-conditioned optimization method and relaxation
strategy of Landweber for EMT system based on TMR. IEEE Trans Instrum Meas.
2021;70:4502409. doi: 10.1109/TIM.2020.3044756
[31] Wang C, Ye S, Zhao X, et al. A solution to TMR-EMT blind spots based on biaxial TMR.
IEEE Trans Instrum Meas. 2023;72:1–10. doi: 10.1109/TIM.2023.3250300
[32] Tamburrinoa A, Calvanob F, Ventrea S, et al. Non-iterative imaging method for experi
mental data inversion in eddy current tomography. NDT&E Int. 2012;47:26–34. doi: 10.
1016/j.ndteint.2011.11.013
[33] Zheng J, Peng L. A deep learning compensated back projection for image reconstruction of
electrical capacitance tomography. IEEE Sens J. 2020;20(9):4879–4890. doi: 10.1109/JSEN.
2020.2965731
[34] Huang P, Huang X, Peng G, et al. Online defect detection on metallic plates using electro
magnetic tomography. accepted in Insight, 2023.