Removal of malachite green from wastewater using date seeds as natural adsorbent isotherms kinetics thermodynamic and batch adsorption process des
Bạn đang xem bản rút gọn của tài liệu. Xem và tải ngay bản đầy đủ của tài liệu tại đây (5.15 MB, 16 trang )
<span class="text_page_counter">Trang 1</span><div class="page_container" data-page="1">
<small>Full Terms & Conditions of access and use can be found at</small>
<b>process design</b>
<b>Faisal Hassan Sorour, N. M. Aboeleneen, N. M. Abd El-Monem, Yara A.Ammar & R. A. Mansour</b>
<b>To cite this article: Faisal Hassan Sorour, N. M. Aboeleneen, N. M. Abd El-Monem, Yara</b>
A. Ammar & R. A. Mansour (26 Feb 2024): Removal of malachite green from wastewater using date seeds as natural adsorbent; isotherms, kinetics, Thermodynamic, and batch adsorption process design, International Journal of Phytoremediation, DOI: 10.1080/15226514.2024.2316315
<b>To link to this article: online: 26 Feb 2024.</small>
<small>Submit your article to this journal </small>
<small>Article views: 102</small>
<small>View related articles </small>
<small>View Crossmark data</small>
</div><span class="text_page_counter">Trang 2</span><div class="page_container" data-page="2"><b>Removal of malachite green from wastewater using date seeds as natural adsorbent; isotherms, kinetics, Thermodynamic, and batch adsorption process design</b>
Faisal Hassan Sorour<small>a</small> , N. M. Aboeleneen<small>b</small>, N. M. Abd El-Monem<small>c</small>, Yara A. Ammar<small>c</small>, and R. A. Mansour<small>b</small>
<small>aChemical engineering department, Canal high Institute for engineering and technology, Suez, egypt; bChemical engineering department, higher Institute of engineering and technology, new damietta, egypt; cChemical engineering department, faculty of engineering, Cairo university, Cairo, egypt</small>
<small>This research explores the feasibility of using date seeds (DS), an agricultural waste, for the adsorption of malachite green (MG) dye from synthesized wastewater. The characterization of the DS before and after adsorption was accomplished by FTIR, SEM, BET, and EDX measurements. Batch adsorption experiments were investigated for MG dye adsorption from aqueous solution onto the DS. The effect of different parameters such as solution pH, adsorbent dose, contact time, temperature, and the initial dye concentration were studied. The optimum pH, adsorbent dose, temperature, and contact time for the dye removal were found to be 5, 0.1 g, 25 °C, and 30 min, respectively. The equilibrium studies for the data with Langmuir, Freundlich, and Temkin isotherms showed that Freundlich isotherm is the best model to describe the adsorption of MG onto the DS particles which has a heterogeneous surface. It was found that the adsorption process follows a pseudo-second-order kinetic model which revealed that the intra-particle diffusion stage is the </small>
<i><small>rate-controlling stage for the process. The thermodynamic parameters ΔG, ΔS, and ΔH suggest the </small></i>
<small>possibility of chemisorption and physisorption simultaneously and indicate the exothermic and </small>
<i><small>spontaneous characters of the adsorption of MG dye on DS with negative values of ΔH and ΔG.</small></i>
<b><small>NOVELTY STATEMENT</small></b>
<small>This study used agriculture waste (date seeds) which is proved to be an environmentally friendly and low-cost adsorbent. The date seeds were shown to be a promising adsorbent, demonstrating high surface area and well-developed porosity. The prepared adsorbent will have a great impact on wastewater treatment technology and possible applications at a large scale. Thus, widespread and great progress in this area can be expected in the future.</small>
The deterioration of the dyes present in wastewater may greatly influence the quality of water and human health
<i>(Sarma et al. </i>2019). About 10% of dyes used in the textile industry are lost during the dyeing system, and 2% are directly discharged as aqueous effluents into the environ-ment without adequate treatenviron-ment. These compounds retain their structural integrity and color under exposure to soil, sunlight, bacteria, and sweat, and exhibit high resistance to microbial degradation in the wastewater treatment process
<i>(Castillo-Suárez et al. </i> 2023). Cationic dyes are frequently employed in biological staining techniques as well as used as colorants in a variety of industrial processes that produce textiles such as cotton, silk, wool, leather, paper, cosmetics, plastics, and pharmaceuticals. The majority of these dyes have good visibility, stability, and resistance to biological, chemical, and photochemical degradation. In addition,
because of their synthetic origin and complicated aromatic structure, they are frequently poisonous and carcinogenic. Dyes cause dermatitis, vomiting, jaundice, nausea, mutations, allergies, and heart defects in addition to being harmful to both people and microorganisms so, the aquatic systems may sustain damage if these dyes are released into the water at different rates. Therefore, dyes must be removed before industrial wastewater is released into water bodies (Jawad,
<i>Mamat, et al. </i>2017<i>; Jawad, Abdulhameed, Wilson, et al. </i>2021). Malachite green (MG) is a basic dye (also called basic green 4) that has been normally used in the textile field to dye silk and leather and also in paper coloring (Zhao and Wei 2020<i>; Moumen et al. </i>2022). It has a molecular weight of 364.9 g mol<small>−1</small> with a chemical structure as shown in Figure 1. In addition, MG is also utilized as an antiseptic, fungicide, and antibacterial in the aquaculture sector to
<i>manage fish diseases and parasites (Lin et al. </i>2016). Malachite
<small>© 2024 taylor & francis Group, llC</small>
<b><small>CONTACT </small></b><small>faisal hassan Sorour Chemical engineering department, Canal high Institute for engineering and technology, Suez, egypt.</small>
<small>adsorption; date seeds; isotherms; kinetics; malachite green; thermodynamic</small>
</div><span class="text_page_counter">Trang 3</span><div class="page_container" data-page="3">cially small fry and it is discharged into water resources without being treated properly, obstructing the life-cycle of aquatic animals and plants by preventing the penetration of sunlight. They cause a reduction of dissolved oxygen because of a conjoint increase in the biological oxygen demand (BOD) to sustain aquatic life. The products developed after the deterioration of MG are dangerous having carcinogenic
<i>potential (Zhang et al. </i>2022). However, due to its effect as a tumor-enhancing substance, the utilization of this dye as a controversial antimicrobial has been forbidden in aquatic ecosystems (Lin and Lee 2016). Therefore, the removal of MG from water effluents is vital to save aquatic ecosystems from pollution.
Several chemical, biological, and physical treatment tech-niques have been applied for dye removal such as advanced oxidation, adsorption, membrane filtration, combined chem-ical and biochemchem-ical processes, aerobic, and anaerobic
<i>digestion (Abdel-Hamid et al. </i> 2019<i>; Fouad et al. </i> 2020;
<i>El-Mehalmey et al. </i>2020). Bioremediation, photodegrada-tion, ion exchange, adsorpphotodegrada-tion, Fenton chemical oxidaphotodegrada-tion, electrochemical degradation, and anaerobic microbial treat-ment are some of the techniques for treating wastewater contaminated with dyes in polluted water (Jawad and Abdulhameed 2020).
Among the treating methods, the adsorption process has the advantages of being highly efficient, simple, and applied widely (Kamdod and Kumar 2022). Adsorption stands out among these techniques because of its ease of use, Simple operating design, economic feasibility, resistance to contam-inants, environmental friendliness low cost, availability, sus-tainability, and large adsorption capacity which make it one of the most ecologically friendly methods for color removal
<i>(Jawad et al. </i>2019<i>; Jawad, Abdulhameed, Hanafiah, et al. </i>
2021). For the removal of some harmful dyes such as azo
<i>dye (Soodmand et al. </i>2022<i>) acid blue 25 (Bichave et al. </i>
2023<i>), methyl orange (Peng et al. </i>2019), rhodamine B (Li
<i>et al. </i>2022<i>), methylene blue (Jia et al. </i>2020), Safranin-O
<i>(Pakdel et al. </i>2022<i>), direct yellow-brown (He et al. </i>2021),
<i>xylenol orange (Xu et al. </i>2022), and malachite green (Swan and Zaini 2019) there are many adsorbents have been listed
<i>(Hynes et al. </i> 2020). MG was previously removed using many adsorbents as shown in Table 1.
The continuous search for new eco-friendly adsorbents with higher efficiency and lower cost is a demanding need in the water treatment industry. Date seeds are a by-product
of date manufacture that have been used as animal food for many years (Aydeniz-Güneşer 2022). Date seeds contain about 52 % dietary fiber, 11 % fats, 6 % proteins, 1.5 % ash, and a considerable quantity of phenolic compounds
<i>(Abu-Thabit et al. </i>2020<i>; Yahmed et al. </i>2021). DS may be a low-cost source of dietary fiber and antioxidants (Bijami
<i>et al. </i> 2020). Some studies have been executed for the removal of dyes with date pits such as methylene blue
<i>(Mansour et al. </i>2018<i>), Remazol (Surkatti et al. </i>2021), acid
<i>black 26, acid blue 7, and acid green 25 (Brahmi et al. </i>2019). This work aims to use a low-cost eco-friendly sorbent, date seeds (DS), for the adsorption of MG dye from an aqueous solution. Evaluation of its performance in the adsorption of MG from aqueous solutions. Factors affecting MG adsorption on DS, such as contact time, the dye’s initial concentration, pH, temperature, and adsorbent dosage are systematically investigated. Thermodynamic, kinetics, and isotherms studies are carried out. Also, a stirred bath adsorber will be designed, an adsorption mechanism was suggested, and suitable disposal for spent adsorbent was mentioned.
<b>Experimental work</b>
Malachite green was purchased from Sigma-Aldrich while HCl and NaOH were purchased from Biotech Egypt. 0.1 M NaOH was prepared by dissolving 4 gm of NaOH in 100 ml double distilled water and 0.1 M HCl produced by dilution of 23.4 ml HCL in 250 ml double distilled water.
<i><b>Adsorbent Characterization</b></i>
FTIR spectra of raw DS and spent DS adsorbent were car-ried out using a JASCO FT/IR-4100 Spectrophotometer in the frequency range of 200–4,000 cm<small>−1</small>. The surface texture of the fresh and spent DS adsorbent was visualized by using
<small>2022</small>
</div><span class="text_page_counter">Trang 4</span><div class="page_container" data-page="4">scanning electron microscopy (SEM) and the qualitative composition of elements of DS before and after MG adsorp-tion was found by the Energy Dispersive X-ray analysis (EDX) (JEOL JSM 6510 lv, Japan). The pH at point zero charge (pH<sub>PZC</sub>) can be determined using the solid addition method by adding 45 ml of NaCl solution of 0.01 M to a series of 100 ml conical flasks. Then the pHi values of the solution from pH 2 to 12 using ether 0.1 N HCl or NaOH. The total volume of the solution in each flask was made up to 50 ml by adding the NaCl solution. 0.15 g of DS is added to the flask, then shaken and allowed to contact for 48 h
<i>with intermittent shaking (Sorour et al. </i>2023).
<i><b>Preparation of date seeds</b></i>
The seeds were collected from Damietta city (Egypt). Splitting of the seeds from date fruits was performed manu-ally, and then the adhering dirt was removed by washing with normal tap water followed by distilled water. The washed seeds are then dried at 130°C for 4 h in an oven
<i>(Mansour et al. </i>2018). The dried seeds were crushed and then sieved to obtain the fine seed powder (200 mesh) to pass> 75 µm.
<i><b>Experimental procedure</b></i>
A dye stock solution of concentration 1,000 mg l<small>−1</small> (1 g MG in 1,000 ml of double distilled water) was prepared and sub-sequently diluted to the required concentrations from 10 to 100 mg l<small>−1</small>. The action of some variables such as solution pH (2–10) and sorbent dosage (0.05–0.3 g DS/l) on the adsorp-tion of MG onto DS was studied through batch laboratory experiments. The initial pH of the dye solution was adapted using 0.1 M HCl or 0.1 M NaOH solutions. A shaking water bath (Wisd laboratory instruments, DAHAN Scientific Co., ltd, 30, Korea) was used to manage the temperature and shaking speed during adsorption. After each adsorption experiment, the residual MG solution was separated and the
<i>absorbance of the filtrate was calculated at λ</i><sub>max</sub> (618 nm). The (UV/VIS) Spectrophotometer (T80 PG instruments Ltd UV/VIS Spectrophotometer, U.K) was used to measure the dye concentrations. Then the amount of dye uptake by the adsorbent is calculated as:
where q<sub>e</sub> is the mass of MG dye taken by DS adsorbent
<i>(mg/g), and C</i><sub>i</sub><i> and C</i><sub>e</sub> are dye concentrations at primal and equilibrium situations (mg l<small>−1</small>). v is the solution volume (l) and m is the mass of the adsorbent (g) (Jawad, Mohd
<i>Firdaus Hum, et al. </i>2022). Also, the dye removal efficiency
<i>where C</i><sub>i</sub><i> and C</i><sub>f</sub> are the original and end dye concentration (mg l<small>−1</small><i>) (Sorkhabi et al. </i>2021).
<b>Results and discussion</b>
Identifying the specs of fresh and spent adsorbent is a vital method to understand the mechanism the dye removal. FTIR spectra help to identify the main functional groups of
<i>the adsorbent (Aghdasinia et al. </i>2021), while the specific surface area of porous date seeds can be computed by the N<sub>2</sub><i>–BET equation (Ali et al. </i>2020). Scanning electron micros-copy (SEM) gives the details on the texture and sheds light
<i>on the mechanism of the water treatment (Buema et al. </i>2021).
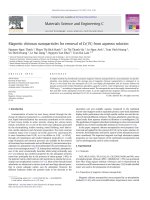
<i><b>Scanning electron microscopy (SEM)</b></i>
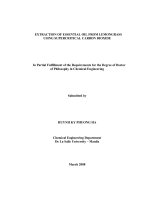
The surface morphology of the raw and spent DS adsorbent was examined using scanning electron microscopy (SEM). Morphological characteristics of the raw and spent DS adsorbent are illustrated in Figure 2a,b. Figure 2a shows the diversity of the raw DS surface which favors the adsorption of MG dye molecules. There is a change in the surface mor-phology of the DS before and after the adsorption of MG. A rugged surface containing many pores and groove-like morphology is noted with heterogeneous cavities that are distributed across the DS surface. This morphology is very much desirable for capturing aromatic dyes such as MG. The spent DS surface shows a morphological change due to the adsorption of MG dye molecules on the adsorbent sur-face. A change in the topography of the DS and the appear-ance of reduced pore structure and smoother surface features is due to the adsorption of MG. That was observed by the presence of heterogeneous bulky particles on the spent sor-bent surface (see Figure 2b<i>) (Jawad, Sabar, et al. </i> 2017;
<i>Al-Saad et al. </i>2019).
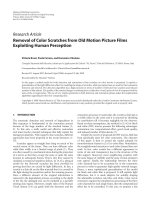
<i><b>The Energy Dispersive X-ray analysis (EDX)</b></i>
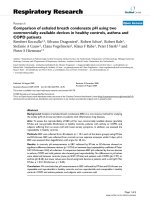
The Energy Dispersive X-ray analysis (EDX) of the DS sor-bent before and after sorption presents another proof for the adsorption of MG molecules on the DS surface which illus-trates that the surfaces of the sorbent contain various ele-ments such as carbon, oxygen, copper, potassium, calcium, and zinc. Figure 3a,b shows the composition that is present in DS before and after adsorption. The composition of raw DS was found to be (wt. %) C (57.66), O (39.81), Cu (1.53) and Zn (0.99). After adsorption, the composition was found to be: C (63.91), O (33.54), Cu (1.22), K (0.42), Ca (0.18), and Zn (0.73). Reduction in oxygen percentage refers to the interactions of dye molecules and oxygen ions indicating surface adsorption. Rising the carbon concentration indicates the adhesion of carbon on the DS surface (El-Azazy
<i>et al. </i>2020).
<i><b>BET analysis</b></i>
The adsorption capacity of an adsorbent is related to its spe-cific surface area (SSA). Conventionally, BET nitrogen gas
</div><span class="text_page_counter">Trang 5</span><div class="page_container" data-page="5"><b><small>Figure 3.</small></b><small> edX images for: (a) raw date seeds; (b) date seeds with malachite green dye.</small>
adsorption techniques have often been used for determining the SSA of solids at 77°k and 760 mmHg as shown in Table 2. It is assumed that the DS surface is fully coated by dye molecules when the adsorption isotherm is established. The BET-specific surface area of DS, as identified by N<sub>2</sub> gas adsorption, was enhanced from 0.03 m<small>2</small> g<small>−1</small> (raw DS) to 1.1324 m<small>2</small> g<small>−1</small> (washed DS by distilled water). The sample was degassed at 60 °C before the measurements. Expanding the surface area of DS as compared with raw DS shows pore structure promotions. This area can supply more surface-active sites, leading to an enhancement of adsorption performance
<i>(Jawad, Ramlah, et al. </i>2017<i>; Hassan et al. </i>2020).
<i><b>FT-IR analysis</b></i>
Figure 4 describes the FT-IR spectrum of DS before and after adsorption. The FT-IR spectrum of DS showed differ-ent bands at 3,374, 2,924.63, 1,746, 1,621, 1,154 cm<small>–1</small> assigned to O–H, –CH aliphatic, –COOH, C = O, –C–O–C– (Aniagor
<i>et al. </i>2021). The existence of the bands at 938, and 806 cm<small>-1</small>
is designated to the vibration of aromatic substitution
<i>(Hassan et al. </i>2020). The FT-IR spectrum of DS compared with that of DS-MG, showed bands at 3,381 and 2,328 cm<small>–1</small>
attributed to O–H and –CH aliphatic. The observed shifts of the bands to higher wavelengths as well as the appearance of new bands at 667 cm<small>–1</small> and 3,779 cm<small>–1</small> and the disappear-ance of little bands such as 1,321, 1,032, 1,011, 535, and 482 cm<small>–1</small> are taken as a strong substantiation for the
<i>adsorption process of MG dye (Jawad, Bardhan, et al. </i>2020;
<i>Ilić et al. </i>2022).
<i><b>Point of zero charge</b></i>
The pH values of the solutions were measured and the difference between the initial and final pH values is plot-ted against the pH<sub>i</sub>. The point of intersection of the resulting curve at which the difference between the initial and final pH values gave the pH<sub>PZC</sub>. Cations adsorption is favored at pH > pH<sub>PZC</sub> such as in MG, while anions adsorption is favored at pH < pH<sub>PZC</sub>. The plot of change in solution pH versus initial pH showed that the zero value of the pH change is at pHi of 5.42 (Mahmoudi
<i>et al. </i>2014).
<b><small>Figure 2.</small></b><small> Sem images for: (a) raw date seeds; (b) spent date seeds.</small>
<b><small>Table 2.</small></b><small> Brunauer-emmett-teller data for date pits.</small>
</div><span class="text_page_counter">Trang 6</span><div class="page_container" data-page="6"><i><b>Effect of various factors on adsorptionEffect of contact time</b></i>
The adsorption efficiency of DS was investigated by con-ducting batch sorption experiments at contact time from 5 min to 40 min at 25ºC temperature, 240 rpm, 0.1 g DS, and natural pH. As shown in Figure 5, an increase in the dye’s removal ability is observed when contact time is increased. A high rate of MG removal was seen at the initiation of adsorption to 30 min. After 30 min, the rate of MG removal decreases. This can be attributed to the availability of a large surface area of the adsorbent. Equilibrium was reached after 30 min indicating that the adsorption sites were well exposed
<i>(Shaikhiev et al. </i> 2021). The rate of adsorption decreased with time due to a decrease in the concentration gradient
<i>(Sorour et al. </i>2023).
<i><b>Effect of initial concentration of dye solution</b></i>
The effect of the original dye concentration was researched in the range (10–100 ppm) at temperatures 25ºC, 240 rpm, 0.1 g DS, natural pH, and 30 min contacting time. As shown in Figure 6, it is found that the MG removal % decreases
as the initial concentration of MG solutions increases because the driving force is higher and the resistance to mass transfer is lower. This is due to the reduction in active sites of the adsorbent surface with increasing concentration of MG dye. At high MG concentrations, the occupation of all free dynamic sites causes a higher adsorption capacity (Bingül 2022).
<i><b>Effect of solution pH</b></i>
The effect of hydrogen ion concentration on the adsorption of MG was examined in the pH range of 2 to 10. Figure 7 shows that the percentage of MG removal from aqueous solution increases with increasing solution pH from 2 to 5. A higher pH (up to 10) caused a decrement in MG removal percentage. The maximum removal percentage was recorded at a pH of around 5. At a strongly acidic medium (below pH = 5), the competition between the positively charged dye molecules and the hydrogen ions decreases the value of the dye removal percentage. At pH values higher than 5, MG removal also decreases due to the decrease of electrostatic
<i>attraction between MG and DS (Joshi et al. </i>2021).
<b><small>Figure 4.</small></b><small> ftIr spectra of dS before adsorption (a) and after adsorption of mG (b).</small>
</div><span class="text_page_counter">Trang 7</span><div class="page_container" data-page="7"><b><small>Figure 6.</small></b><small> effect of initial concentration of mG dye on dS (Conditions: 50 ml solution, 240 rpm, 0.1 g dS, natural ph, and 25°C).</small>
<b><small>Figure 7.</small></b><small> effect of ph on adsorption of mG dye on dS (Conditions: 50 ml solution, 240 rpm, 50 mg/l mG, 25°C, and 0.1 g of dS).</small>
<i><b>Effect of adsorbent dosage</b></i>
Determining the optimal dosage of DS adsorbent in the adsorption process is related to the cost of the application
<i>Jawad, Abd Malek, et al. </i>2022). To evaluate the effect of DS dose on dye removal, experiments with different DS dosages (from 0.05 g to 0.3 g) at 25 °C were performed. In Figure 8, it was noted that the percent removal of MG increased with
the adsorbent dose. This is the result of increased surface area and active sites. The increase ceases at a dose higher than 0.1 g of DS in 50 ml of MG dye solution due to reach-ing equilibrium, therefore 0.1 g of raw DS was taken as the optimal dose. Enhancing the dose of the sorbent provides a greater number of active sites that can adsorb MG and
<i>therefore increases the range of adsorption (Atef et al. </i>2023).
<b><small>Figure 5.</small></b><small> effect of contact time on adsorption of mG onto dS. (Conditions: 50 ml solution, 240 rpm, 0.1 g dS, natural ph, and 25 °C).</small>
</div><span class="text_page_counter">Trang 8</span><div class="page_container" data-page="8"><i><b>Effect of temperature</b></i>
The effect of adsorption temperature (ranging from 25 °C to 75 °C) was examined. It was found that the maximum mass of MG dye removal by using DS as an adsorbent was achieved at 25 °C. The batch experiments were implemented for different initial dye concentrations 10, 20, 30, 40, and 50 mg/l at a constant DS dose of 0.1 g and at an optimal pH = 5. Figure 9 shows that the decrement in the percentage of dye removal which is observed upon raising the temperature
<i>suggests an exothermic nature of the process (Bonetto et al. </i>
2021). The rate of uptake of dye decreased with increasing temperature, this may be due to increasing the solubility of dye when temperature increases.
<i><b>Equilibrium isotherms</b></i>
Designing an adsorption system requires an assessment of the adsorption characteristics. Adsorption isotherm charac-terizes the adsorbent and adsorbate interactions and helps
<i>predict the highest adsorption capacity (Dhaif-Allah et al. </i>
2020). Figure 10 shows the relationship between qe and C<sub>e</sub> for the adsorption isotherms of MG dye on DS. The exper-imental data for adsorption isotherm were obtained by measuring the equilibrium adsorption amount of MG at different initial concentrations (10–50 mg/L) at 30 min, 240 rpm, 298 K, 0.1 g DS, and pH 5. The equilibrium adsorption rises significantly with the increase in initial concentration. It appears that the basic type of isotherm is
<i>H-behavior based on Giles classification (Tu et al. </i>2019) and the adsorption extent (at 25 ± 1 °C) is around 40.24 mg/g for MG dye.
Empirical results were fitted with three isotherm models namely: Langmuir, Freundlich, and Temkin. The correlation
<i>coefficient (R</i><small>2</small>), which is determined by fitting adsorption equilibrium data to these models, is used to select the proper model that describes best the adsorption process.
The Langmuir model assumes that, in an adsorption pro-cess, the homogeneous surface of the adsorbent is enveloped
<i>with a monolayer of the solute (Rajoriya et al. </i>2021). The mathematical model of Langmuir isotherm is provided by Equation (3):
<b><small>Figure 8.</small></b><small> effect of dS dosage on mG dye removal (Conditions: 50 ml solution, 240 rpm, 50 mg/l BG, ph 5, and 25°C).</small>
<b><small>Figure 9.</small></b><small> effect of temperature on adsorption of mG dye onto dS (Conditions: 50 ml solution, 240 rpm, 50 mg/l mG, ph 5, and 0.1 g of dS).</small>
</div><span class="text_page_counter">Trang 9</span><div class="page_container" data-page="9">The q<sub>e</sub><i> is the equilibrium loading in (mg/g); C</i><sub>e</sub> is the equilibrium concentration in (mg/L); q<sub>max</sub> is the maximum adsorption capacity (mg/g) and K<sub>l</sub> is the adsorption equilib-rium constant (L/mg). Figure 11 shows a straight-line
<i>rela-tionship between C</i><sub>e</sub><i> and C</i><sub>e</sub>/q<sub>e</sub>. The slope is 1/q<sub>max</sub> and an intercept equals 1/ (q<sub>max</sub> K<sub>l</sub><i>) (Oskui et al. </i>2019).
The Freundlich isotherm model stipulates a heteroge-neous adsorbent surface covered with multiple layers of the solute. The Freundlich model is shown in the equation;
Heterogeneous adsorbent surface covered with multilayer of the solute. The Freundlich model is given Equation (4)
<i>(Mansour et al. </i>2021; Jawad and Surip 2022); ln q ln K
n<sup>ln C</sup>
K<sub>F</sub> is the Freundlich isotherm constant (L/mg) stands for the bonding energy, 1/n is known as adsorption intensity (heterogeneity factor) and n refers to the deviation from adsorption linearity. Freundlich parameters are defined from
<i>ln q</i><sub>e</sub><i> versus ln C</i><sub>e</sub> plot as shown in Figure 12. The Freundlich
<i>exponent (n) has a decisive effect on the profile of the </i>
adsorption isotherm. In water treatment, it aims to obtain very low equilibrium concentrations which stands for the maximum permitted adsorbate concentration in the treated
<i>water. Values of (n) describe how well MG can be adsorbed by DS. Where: The smaller the Freundlich exponent (n), the </i>
better the MG can be adsorbed. Linear adsorption is found
<i>at n = 1. Chemisorption takes place if n < 1. When the </i>
Freundlich exponent exceeds 1, the adsorption tends to
<i>phy-sisorption process (Mansour et al. </i>2020). In the adsorption process of MG dye solution on fine DS particles, the
<i>Freundlich exponent (n) is 2.25 which refers to the </i>
phy-sisorption process.
Temkin isotherm (Figure 13) describes the adsorbent- adsorbate species interaction. The model supposes that the heat of sorption of adsorbate species in the layer would
<i>decrease linearly with coverage (Maryanti et al. </i>2020; Jawad,
<i>Abd Malek, et al. </i>2022). The Temkin model can be expressed as given in equation 5:
q<sub>e</sub>=q ln C<sub>m</sub> <sub>e</sub>+q ln K<sub>m</sub> <sub>t</sub>, (5)
<i>K</i><sub>t</sub><i> is the Temkin constant (L/mg), and q</i><sub>m</sub> is the constant relevant to the heat of sorption (J/ mol). As shown in Figure 13<i>, the values of q</i><sub>m</sub><i> and k</i><sub>t</sub> can be determined by
<b><small>Figure 10.</small></b><small> Influence of initial concentrations on the adsorption capacity of dS.</small>
<b><small>Figure 11.</small></b><small> langmuir isotherm of mG dye solution adsorption using dS fine </small>
<small>particles.</small>
</div><span class="text_page_counter">Trang 10</span><div class="page_container" data-page="10"><i>the calculation slope and intercept of the linear plot of q</i><small>e</small>
<i>versus ln C</i><small>e</small>.
The corresponding typical parameters for all three iso-therm models are given in Table 3. The correlation coeffi-cient from the three models indicates that the Freundlich model is a better fit for experimental data than the other models. This means that the adsorption is multilayer and takes place on heterogeneous surfaces.
<i><b>Kinetic study</b></i>
Adsorption kinetics involves studying the rate of chemical reactions, which represents an essential parameter for
<i>choos-ing a proper adsorbent (Qi et al. </i>2021). Pseudo-first-order and pseudo-second-order kinetic models were implemented to research MG dye solution adsorption on DS particles. Equation (6) represents the integrated form of a pseudo-first-order model. The kinetic model of pseudo-second order is given by Equation (7)<i> (Jawad et al. </i> 2018; Ali
<i>q</i><sub>e</sub> is the equilibrium adsorption capacity (mg/g), k<sub>1</sub> is the rate constant of the pseudo-first-order adsorption (min<small>−1</small>),
<i>and q</i><sub>t</sub> is the MG dye amount adsorbed at time t (g/mg min). k<sub>2</sub> is the pseudo-second-order adsorption rate constant kinetics models that were studied to fit the experimental results (Aghdasinia and Asiabi 2018<i>; Ghosh et al. </i> 2021). Figure 14 indicates the ln (q<sub>e</sub>–q<sub>t</sub>) vs time. Factors of kinetic models were determined from the slope and intercept, and are outlined in Table 4 with initial MG dye concentrations in the range of 10–50 mg/L. Chemical kinetics are important parameters to calculate the rate of adsorption in terms of rate constants. It is worth mentioning that the experimental
<i>q</i><sub>e</sub><i> results do not meet the calculated q</i><sub>e</sub>. This shows that the sorption kinetics of MG dye on DS fine particles do not
<i>follow pseudo–first–order kinetic model (Jawad, Sahu, et al. </i>
2022). Figure 15 shows a plot t/qt versus t for different ini-tial dye concentrations. k<sub>2</sub> is measured from the intercept and the slope of the plots between t/qt vs. t. Experimental results follow the second-order kinetics model and it points to the chemisorption that took place throughout the adsorp-tion process. From Table 4, the values of K<sub>2</sub> decrease with increasing initial concentration of MG due to the high com-petition for the adsorption sites at high concentration which leads to higher sorption rates. Transport of MG ions from the boundary film to the external surface of the DS (surface diffusion) and transfer of MG ions from the surface to the intra-particle active sites (pore diffusion) is the rate-controlling step.
<b><small>Table 4.</small></b><small> adsorption rate constants, adsorption capacities, and correlation coef-ficient of pseudo-first-order and pseudo-second-order kinetic models at differ-ent initial mG dye concdiffer-entrations.</small>
<small>modelPseudo first-order kineticsPseudo second-order kinetics</small>
<b><small>Table 3.</small></b><small> equation parameters and correlation coefficients for different adsorp-tion isotherms at different initial concentraadsorp-tions (10–50 mg/l), 30 min, 240 rpm, </small>
</div>