Final report research on the effect of brand ambassador on cosmetic purchase intention in ho chi minh city
Bạn đang xem bản rút gọn của tài liệu. Xem và tải ngay bản đầy đủ của tài liệu tại đây (4.06 MB, 98 trang )
<span class="text_page_counter">Trang 1</span><div class="page_container" data-page="1">
<b>MINISTRY OF EDUCATION AND TRAININGHO CHI MINH CITY UNIVERSITY OF</b>
<b>TECHNOLOGY AND EDUCATION</b>
<b>FINAL REPORT</b>
<b>Research on The Effect of Brand Ambassador onCosmetic Purchase Intention in Ho Chi Minh City</b>
<b>Course Code: PLSK320605EClass Code: 212PLSK320605E_01CLC</b>
<b>Student Performance: Group 1Lecturer: Ph.D.TRUONG THI HOA</b>
Ho Chi Minh City, June in 2022
</div><span class="text_page_counter">Trang 2</span><div class="page_container" data-page="2"><b>LIST OF MEMBERS PARTICIPANTING IN THE REPORT</b>
SEMESTER II, SCHOOL YEAR: 2021-2022
</div><span class="text_page_counter">Trang 3</span><div class="page_container" data-page="3"><b>6</b> H+ Th9 Thu HuyFn 20124185
- Make questionnaire- Create table survey
</div><span class="text_page_counter">Trang 5</span><div class="page_container" data-page="5"><b>Table of Contents</b>
<b>TABLE OF ABBREVIATIONS...i</b>
<b>LIST OF TABLES...ii</b>
<b>LIST OF FIGURES...ivCHAPTER 1: RESEARCH OVERVIEW...1</b>
<b>1.1. Reason to choose the research topic...1</b>
<b>2.1.3. Theory of Consumer Behavior...5</b>
<b>2.1.4. Theory on the impact of brand ambassadors on consumer behavior...5</b>
<b>2.2. Related Studies Matrix...6</b>
<b>3.2. The process of building the scale, and designing the survey form...12</b>
<b>3.2.1. The process of building the scale...13</b>
</div><span class="text_page_counter">Trang 6</span><div class="page_container" data-page="6"><b>3.2.2. Design of questionnaires and surveys...16</b>
<b>3.3. Sampling process and data collection...16</b>
<b>3.3.1. Sample selection process...16</b>
<b>3.3.2. Data collection process...17</b>
<b>3.4. Quantitative analysis...17</b>
<b>3.4.1. Summary of the quantitative analysis process...17</b>
<b>3.4.2 Check the difference between statistical groups (Descriptive Statistics)...18</b>
<b>3.4.3. Quantitative analytical methods...18</b>
<b>CHAPTER 4: RESEARCH CONCLUSIONS...22</b>
<b>4.1. Descriptive Statistics...22</b>
<b>4.1.1. Frequancy table and descriptive statistics...22</b>
<b>4.1.2. CROSS TABULATION TABLES...24</b>
<b>4.2.6. Negative Information Scale...35</b>
<b>4.2.7. Purchase Intention Scale...36</b>
<b>4.3 EXPLORATORY FACTOR ANALYSIS EFA...37</b>
<b>4.3.1 Exploratory Factor Analysis EFA with Independent variables...37</b>
<b>4.3.2. Exploratory Factor Analysis EFA with Dependent variable...42</b>
<b>4.4. TEST MODELS AND RESEARCH HYPOTHESES...45</b>
</div><span class="text_page_counter">Trang 7</span><div class="page_container" data-page="7"><b>Appendix 1: QUESTIONNAIRE...63Appendix 2: DESCRIPTIVE STATISTICS...69Appendix 3: TESTING RELIABILITY OF MEASUREMENT SCALES (CRONBACH’S ALPHA)...72Appendix 4: EXPLORATORY FACTOR ANALYSIS (EFA)...76Appendix 5: TEST MODELS AND RESEARCH HYPOTHESES...82</b>
</div><span class="text_page_counter">Trang 8</span><div class="page_container" data-page="8">P a g e<b> | i</b>
<b>TABLE OF ABBREVIATIONS</b>
2e-WOMElectronic Word of Mouth3V.I.P.Very Important Person4EFAExploratory Factor Analysis5KMOKaiser– Meyer– Olkin6VIFVariance Inflation Factor7D-WDurbin-Watson Value
</div><span class="text_page_counter">Trang 9</span><div class="page_container" data-page="9">P a g e<b> | ii</b>
<b>LIST OF TABLES</b>
<b>Table 3.2.1 - Table of ScalesTable 4.1.1.1 - Frequency tablesTable 4.1.1.2 - Descriptive Statistics</b>
<b>Table 4.1.2.1 - Thu nhap*Hoc van Crosstabulation</b>
<b>Table 4.1.2.2 - Hoc van*Nghe nghiep*Gioi tinh CrosstabulationTable 4.1.2.3 - Custom Tables</b>
<b>Table 4.2.1 - Results of assessment of Reliability ScaleTable 4.2.2 - Results of assessment of Attraction ScaleTable 4.2.3 - Results of assessment of Specialization ScaleTable 4.2.4 - Results of assessment of Specialization ScaleTable 4.2.5 - Results of assessment of Specialization ScaleTable 4.2.6 - Results of assessment of Negative Information ScaleTable 4.2.7 - Results of assessment of Purchase Intention ScaleTable 4.3.1.1 - KMO and Bartlett test results for independent variablesTable 4.3.1.2 – Total Variance Explained</b>
<b>Table 4.3.1.3 - The first exploratory factor analysis results</b>
<b>Table 4.3.1.4 - KMO and Bartlett’s Test result for independent variables for the final</b>
<b>Table 4.3.1.5 – Total Variance Explained</b>
<b>Table 4.3.1.6 - Final exploratory factor analysis results</b>
<b>Table 4.3.2.1 - KMO and Bartlett’s Test - scale of entrepreneurship intention of students</b>
<b>Table 4.3.2.2 – Total Variance ExplainedTable 4.3.2.3 – Component MatrixTable 4.4.1 - Correlation analysis resultsTable 4.4.2.1 - Variables Entered/Removed</b>
<b><small>a</small></b><b>Table 4.4.2.2 - Explanatory Level of the Model</b>
</div><span class="text_page_counter">Trang 10</span><div class="page_container" data-page="10">P a g e<b> | iii</b>
<b>Table 4.4.2.3 - Model Fit: Analysis of Variance ANOVATable 4.4.2.4 - Table Residuals Statistics</b>
<b><small>a</small></b><b>Table 4.4.2.5 - Table Model Summary</b>
<b><small>b</small></b><b>Table 4.4.2.6 - Statistical analysis of regression coefficients</b>
</div><span class="text_page_counter">Trang 11</span><div class="page_container" data-page="11">P a g e<b> | iv</b>
<b>LIST OF FIGURES</b>
<b>Figure 2.3 - Research ModelFigure 3.1 – 12-step Research ProcessFigure 4.1.3 - Pie Chart Percent of tuoiFigure 4.4.2.1 – 4.4.2.4 - Scatter charts</b>
<b>Figure 4.4.2.5 - Histogram of the normalized residualsFigure 4.4.2.6 - Histogram</b>
<b>Figure 4.4.2.7 - Scatterplot: Regression Standardized Residual</b>
</div><span class="text_page_counter">Trang 86</span><div class="page_container" data-page="86">P a g e<b> | 75</b>
<b> PURCHASE INTENTION SCALE</b>
</div><span class="text_page_counter">Trang 88</span><div class="page_container" data-page="88">P a g e<b> | 77</b>
</div><span class="text_page_counter">Trang 89</span><div class="page_container" data-page="89">P a g e<b> | 78</b>
<b>Part 2</b>
<b>Total Variance Explained</b>
<b>Rotated Component Matrix</b>
<b><small>a</small></b></div><span class="text_page_counter">Trang 90</span><div class="page_container" data-page="90">P a g e<b> | 79</b>
<b>o Exploratory Factor Analysis EFA with Dependent variable.</b>
</div><span class="text_page_counter">Trang 91</span><div class="page_container" data-page="91">P a g e<b> | 80</b>
<b>Appendix 5 : TEST MODELS AND RESEARCH HYPOTHESES</b>
</div><span class="text_page_counter">Trang 92</span><div class="page_container" data-page="92">P a g e<b> | 81</b>
<b> Regression Analysis</b>
</div><span class="text_page_counter">Trang 93</span><div class="page_container" data-page="93">P a g e<b> | 82</b>
Hypothesis
CHECK THE VIOLATION OF ASSUMPTIONSASSUMPTION 1: CHECK SCATTERPLOT
</div><span class="text_page_counter">Trang 94</span><div class="page_container" data-page="94">P a g e<b> | 83</b>
</div><span class="text_page_counter">Trang 95</span><div class="page_container" data-page="95">P a g e<b> | 84</b>
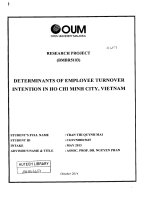
<b>ASSUMPTION 2: RESIDUALS ARE NORMALLY DISTRIBUTED</b>
</div><span class="text_page_counter">Trang 96</span><div class="page_container" data-page="96">P a g e<b> | 85</b>
</div><span class="text_page_counter">Trang 97</span><div class="page_container" data-page="97">P a g e<b> | 86</b>
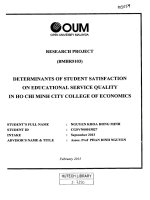
<b>ASSUMPTION 3: DURBIN-WATSON VALUE</b>
<b>ASSUMPTION 4: NO OR LITTLE MULTICOLLINEARITY: THE</b>
INDEPENDENT VARIABLES ARE NOT HIGHLY CORRELATED WITH EACH OTHER [COV(XI,XJ) =0]
<b>ASSUMPTION 5: VIOLATION OF ASSUMPTIONS</b>
</div><span class="text_page_counter">Trang 98</span><div class="page_container" data-page="98">P a g e<b> | 87</b>
</div>