- Trang chủ >>
- Y - Dược >>
- Y học công cộng
tăng acid uric máu và nguy cơ bệnh nội khoa
Bạn đang xem bản rút gọn của tài liệu. Xem và tải ngay bản đầy đủ của tài liệu tại đây (5.63 MB, 28 trang )
Tang acid uric mau
và nguy cơ bệnh nội khoa
TS BS Cao Thanh Ngọc
Khoa Nội cơ xương khớp, BV ĐHYD TPHCM
(ALTHE FOUR INDUSTRIAL REVOLUTIONS178018001850 1900 1950 2000
FIRST (1784) SECOND (1870) THIRD (1969) FOURTH (NOW)
Mechanical production, Mass production, electri- Automated production, Artificial intelligence, big
railroads, and steam cal power, andthe advent electronics, and data, robotics, and more
computers
power of the assembly line tocome
All contents and images used on this slide deck is for educational purposes only.
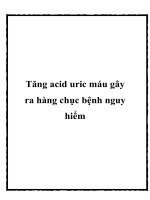
Overproduction (10%) Risk factors Underexcretion (90%)
Dietary purine lamb) * Male Urinary excreti,on
* Meat (beef, pork, tuna)
* Seafood (shrimps, * Age Diuretics
* Beer * Obesity * Renal failure
Endogenous purine synthesis Urinary reabsorption
* Malignancy * Alcohol
* Tumor lysis syndrome * Genetic defects
Purine salvage ccc
* HGPRT deficiency
* PRPS deficiency URIC ACID CRYSTALS
Purine breakdown Hyperuriceamia
* Glycogen storage disease
| |
GiT excretion Renal excretion
Gaafar Ragab J Adv Res. 2017 Sep; 8(5): 495-511.
Tang acid uric mau
¢ Tang acid uric mau: > 7mg/dl (420umol/L)
(Ngưỡng hòa tan của urate: > 6,8 mg/dl (408umol/L)
°Ö Nguyên nhân tang acid uric mau:
— Tang tao acid uric
— Giảm đào thải acid uric (nhiều)
¢ Tăng acid uric máu là nguy cơ của nhiều bệnh
nội khoa:
— Bénh tim mach: THA, BMV, RLLP, rung nhi
— Nội tiết: hội cheng chuyén hda, béo phi, DTD, khang
insulin
— Bénh than man
— Cac bénh khac: viém gan C, vay nén...
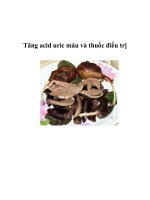
Xanthine Purine Factors that cause hyperuricemia:
oxidoreductase + Decreased kidney function
Hypoxanthine, + Diuretic use
Intracellular + Increased renal vascular resistance
adverse action .
+ Insulin resistance
of uric acid Xanthine |: Others
Stimulation of RAAS “ Uricacid
Stimulation of chemokines Hyperuricemia Untoward
Endothelial rae
clinical
effects of
uric acid
dysfunction
Coronary artery disease
Chronic kidney disease
Activation of NADPH oxidase aa
Reduction in NO bioavailability
Heart failure
Activation of vasoconstrictive mediators
Stroke
Gout
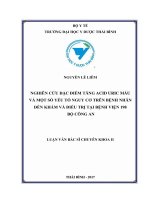
Tang acid uric và gout
>
8 2 8 —@— Men 50
Gout Prevalence(per 1000 patiens) —@— Women 40
N ©
— _©
<24 25-34 35-44 45-54 55-64 65-74 75-84 285 © <5.0 5059 6069 7079 280
Age group (years) Serum Urate (mg/dl)
Roddy E, Doherty M (2010): Epidemiology of gout. Arthritis Research & Therapy
Tăng acid uric và tăng huyết áp
Hyperuricemia and Cardiovascular Disease
Alberto Palazzuoli, MD, PhD,' Helen Hashemi, MD,? Lauren C. Jameson, Peter A. McCullough, MD, MPH?^5
¬ ‘Cardiology Unit, Department of Internal Medicine, University of Siena, Italy; *Baylor University Medical Center,
Dallas, TX; “Southern Methodist University, Dallas, TX; “Baylor Heart and Vascular Hospital, Dallas, TX; “Baylor
Heart and Vascular Institute, Dallas, TX
[Rev Cardiovasc Med. 2077;18/(4):134-145 doi: 10.3909/ricm0889]
A 13% increase in the risk of an incidence of hypertension was in a study on rats: hyperuricemia
reported per 1 mg/dL increase in serum UA level. causes glomerular hypertension
and hypertension with no cutpoint of hyperuricemia induces the vaso- and thickening of vascular walls,
or threshold. This correlation was which leads to obliteration of lumen
more prominent in young individu- constriction, a causal factor associ- of the preglomerular vessel, which
als and women.” Potential mecha- in turn results in arterial hyperten-
nisms linking hyperuricemia and ated with hypertension. UA is also sion.** This is significant due to the
the development of hypertension reported as an independent risk fac-
tor for a decrease in renal function- role that glomerular hemodynamic
ing and end-stage renal disease.*”* modifications play in the genesis
and advancement of renal disease.**
Vol. 18 No. 4 * 2017 = Reviews in Cardiovascular Medicine s 137
Tăng acid uric và nguy cơ bệnh mạch vành
Study ID RR (95% Cl)
1.28 (0.88, 1.88)
Goldberg et al (1995) 1.70 (0.80, 3.30)
Liese et al (1999) 0.73 (0.52, 1.02)
1.25 (0.78, 2.02)
Culleton et al-M (1999) 1.02 (0.69, 1.51)
1.18 (0.62, 2.26)
Culleton et al-F (1999) 1.19 (0.98, 1.45)
1.51 (0.61, 3.72)
Moriarity et al-M (2000) 2.07 (0.72, 5.94)
1.08 (0.90, 1.31)
Moriarity et al-F (2000) 1.00 (0.75, 1.33)
1.37 (1.01, 1.84)
Puddu et al (2001) 1.73 (1.27, 2.36)
1.11 (1.08, 1.15)
Chien et al-M (2005) 2.30 (1.08, 4.89)
1.10 (0.77, 1.57)
Chien et al-F (2005)
Wheeler et al-M (2005) 0.90 (0.70, 1.30)
Wheeler et al-F (2005)
1.06 (O.97, 1.16)
Bos et al-M (2006)
1.13 (1.05, 1.21)
Bos et al-F (2006)
Krishnan et al (2006)
Baba et al (2007)
Meisinger et al (2008)
Kavousi et al (2012)
Storhaug et al (2013) =
Overall (l-squared=37.8%,P=0.053) 1°
0.2 . won 6
Normouricemia Hyperuricemia
Scientific Reports volume6, Article number: 19520 (2016)
Tăng acid uric và
nguy cơ tử vong do bệnh mạch vành
Study ID RR (95% Cl)
1.18 (0.78, 1.78)
Females (1989) — ''
1.62 (1.16, 2.26)
Levine et al-Age45-54 (1989) p = 0.030) —=—- —— 1.30 (1.17, 1.45)
tư 1.05 (0.93, 1.18)
Levine et al-Age55-64 62.7%, <— 1.24 (1.22, 1.27)
Fang et al (2000)
Baibas et al (2005) 1.22 (1.12, 1.34)
Holme et al (2009) 1.17 (1.06, 1.28)
Subtotal (l-squared = 1.03 (0.92, 1.15)
Males p = 0.179) = == B 1.14 (1.12, 1.16)
Fang et al (2000)
1.13 (1.07, 1.19)
Baibas et al (2005)
1.10 (1.06, 1.14)
Holme et al (2009) 1.06 (0.94, 1.19)
1.10 (1.06, 1.14)
Subtotal (Il-squared = 41.8%, 1.15 (1.09, 1.21)
Combined p = 0.556) =| '
p = 0.000) —_=--
Chen et al (2009)
Zalawadiya et al (2014) Oo
Subtotal (l-squared = 0.0%, >
Overall (I-squared = 87.1%,
0.T5 1 2T
Normouricemia Hyperuricemia
Scientific Reports volume6, Article number: 19520 (2016)
Tang acid uric va rung nhi
Study = RR (95% Cl) %
|
ID | 1.21 (1.11, 1.33) Weight
Kim (2015) l 2.65 (1.05, 6.69) 28.88
| 1.98 (1.34, 2.92)
Chuang (2014) 3.51
Nymes (2014) —^—— 1.19 (1.09, 1.29) 13.01
|
Chao (2013) 3.51 (1.50, 8.20) 29.15
= | 1.74 (1.39, 2.17)
Valbusa (2013) 1.49 (1.24, 1.79) 4.09
Tamariz (2011) | 21.36
Overall (I-scquare = 79.0%, p = 0.000) ———— 100.00
|
—=—
I
>
NOTE: Weights are from random effects analysis 1 T
8.2
T
.122
Current Medical Research and Opinion, (2017) 33:sup3, 21-25
Tang acid uric và suy tim
6 0.30— HR (95% Cl) =
= == 0.25-—| 1.30 (1.05—1.60); P=0.015
+ 0.20 Hyperuricemia
® 0.15- Z
L= „ Normal
= 0.10- ““. serum uric acid
= 0.05-
0.00— 2| 4| 6| Ỉ8 10 12 | |
|
0
Follow up (years)
Number of participants at risk by serum uric acid level
Normal 1181 1123 1040 937 719 615
High 1181 1099 997 8/76 696 587
Int J Cardiol. 2010 Jul 23;142(3):279-87
Tăng acid uric và tử vong do suy tim
Heart Failure
A Graded Relationship Between
Serum Urate and Survival
HXaplan-Wleier Survival Curves FEisk Fcalloas vs SUA
10`0 lệ^= an, |
BO _ SUA “8.72 mũ/dL xa»:
"“m———D_
mei Me.
ke
sa.
> BÚ
ST.
Pr SUA 10.1-13.44 mg/dL
1ù
UAE ee eTae
Eì 4 6 _ a
Time, years es
baaa a eee eR to bd “+
Anker 6t al. Circulation, 2003;107:1991-1997.
Tăng acid uric và rồi loạn lipid mau
BioMed Research International in
Volume 2015, Article ID 127596, 7 pages
Research Article
Relationship between Hyperuricemia and Lipid Profiles
US Adults
Tao-Chun Peng,! Chung-Ching Wang,! Tung-Wei Kao,!-2 James Yi-Hsin
Chan,)? Ya-Hui Yang,* Yaw-Wen Chang,!2 and Wei-Liang Chen!-+-3
Background. Although the link between hyperuricemia and metabolic syndrome had been recognized, the
association of the dyslipidemia among individuals with hyperuricemia remains not comprehensively assessed.
Methods. Using NHANES III study, we examined the relation between serum lipid profiles and different serum
uric acid levels, including serum total cholesterol, LDL cholesterol, triglycerides, HDL cholesterol,
apolipoprotein-B, lipoprotein (a), apolipoprotein AI, ratio of triglycerides to HDL cholesterol, and ratio of
apolipoprotein-B to AI. Results. After adjusting for potential confounders, average differences (95% confidence
interval) comparing the top to the bottom (reference) serum uric acid were 0.29 (0.19, 0.39) mmol/L for total
cholesterol, 0.33 (0.26, 0.41) mmol/L for triglycerides, 0.14 (0.01, 0.27) mmol/L for LDL cholesterol, —0.08
(—0.11, —0.035) mmol/L for HDL, and 0.09 (0.05, 0.12) g/L for serum apolipoprotein-B. Notably, ratios of
triglycerides to HDL cholesterol and apolipoprotein-B to AI were also linearly associated with uric acid levels
P for trend RRO eats eae Lhis study suggested that serum LDL cholesterol, triglycerides, total
cholesterol, apolipoprotein-B levels, ratio of triglycerides to HDL cholesterol, and ratio of apolipoprotein-B to
0...2. 02.22...is. 10V .4...0( (203V .s i30 arr, whereas serum HDL cholesterol levels are significantly
inversely associated. In the clinical practice, the more comprehensive strategic management to deal with
dyslipidemia and hyperuricemia deserves further investigation.
Tăng acid uric và hội chứng chun hóa
° 23% dân số Mỹ mắc HCCHÍ
Các yếu tơ của hơi chứng chun hóa
- Tăng nồng độ insulin lưu - RLCH lipid
hanh/tang dé khang insulin - Tăng huyết áp
- ĐTĐ2/ELDNĐ - Tang acid uric máu
- Beo phi vung bung - Tăng xơ vữa ĐM
° 86% bệnh nhân gout mắc HCCH2
"| Ford et al. Jama. 2002;287:356-359
2. Vazquez-Mellado et al. J Clin Rneu. 2004;10(3): 105-109
Tăng acid uric và hội chứng chuyên hóa
100 - Revised NCEP/ATP Oo Women Original NCEP/ATP
n90 - | O Men | || |
|
80 - |
Prevalence, % T
60 + - |
50 ¬ o H
40 4 T H
30 - p f
H H
20 + c h
10 -
¬ =
0
F R
T T T T T T T T 1
<6 6-79 8-9.9 210 <6 6-7.9 8-9.9 210
The American Uric Acid Levels (mg/dL) (10.1016/j.amjmed.2006.06.040)
Journal of Medicine 2007 120, 442-447DOI:
Tang acid uric va dai thao dwong
Study _——— RR (95% Cl) — %
ID Weight
ae 1.50 (0.90, 2.50)
Perry(men) (1995) —s— 5.39
1,24 (0.90, 1.71)
Taniguchi(men) (2001) ——— 1,68 (1.22,231) 13.66
Dehghan (2008) 1400
—#— 1.40 (1.02, 1.82)
Chien (2008) —> 14.07
= 1.72 (1,21, 2.44)
Bhole(orignal) (2010) 1.74 (1.24, 2.36) 11.44
Bhole(offspring) (2010) -—t—=) 1.57 (1.24, 1.99) 13.59
Wang (2011) 278(1.35,571) 25.15
Viazzi (2011) © 1.56 (1.39, 1.76) 271
Overall (J-s=q0.u0%a, pr=e0.d571) 100.00
I175 |5.71
4
Serum uric acid and risk of incident type 2 diabetes. Fix-effects model analysis for the overall RR (1.56, 95% Cl =
1.39-1.76) of incident type 2 diabetes for the highest compared with the lowest category of serum uric acid level.
No evidence of heterogeneity across studies was found (| 2 = 0.0%, P = 0.571). The square sizes are
proportional to the weight of each study in the meta-analysis; the horizontal lines represent 95% CIs;
Lv Qin (2013), "High Serum Uric Acid and Increased Risk of Type 2 Diabetes: A
Systemic Review and Meta-Analysis of Prospective Cohort Studies", pp. e56864.
Tang acid uric và đái tháo đường
Changes of hyperuricemia Total Diabetes (n,%) RR (95% CI)
Males 5998 316(5.27) 1.00
No hyperuricemia 1.37 (1.10-1.71)
Remittent hyperuricemia 1022 96(9.39) :R- 1.40 (1.07-1.82)
Incident hyperuricemia 1.76 (1.46-2.13)
Persistent hyperuricemia 683 60(8.78) _R-
Females
No hyperuricemia 1148 153(13.33) Hi
Remittent hyperuricemia 5898 151(2.56) 1.00
Incident hyperuricemia 264 19(7.20) ff 1.12 (0.68-1.83)
Persistent hyperuricemia
Age <50 years 192 18(9.38) ———¬ 1.75 (1.09-2.81)
No hyperuricemia
Remittent hyperuricemia 198 28(14.14) —R¬ 1.63 (1.07-2.49)
Incident hyperuricemia 8728 240(2.75) 1.00
Persistent hyperuricemia
Age =50 years R35 60(7.19) " 1.35 (1.02-1.79)
No hyperuricemia 610 42(6.89) _RE—: 1.47 (1.06-2.04)
Remittent hyperuricemia 808 104(12.87) ¬" 2.10 (1.65-2.67)
Incident hyperuricemia
3168 227(7.17) 1.00
Persistent hyperuricemia
451 55(12.20) _ 1É “ô 1.37 (1.03-1.82)
265 36(13.58) _ § “4 1.52 (1.10-2.10)
538 77(14.31) + 1.49 (1.16-1.92)
0.5 lS 2.5
Journal of Diabetes Research Volume 2018, Article ID 6905720
Tang acid uric va tang creatinin
serum Urate Is a Strong Correlate
for Developing High Serum Creatinine
Data collected from 6403 Japanese subjects
Fs Pr,
=
ty =< Giher than sex,
Aa serum urate Wwas the
most significant
bal
La
oy l a cdrrelate for
+ = develonlna hlqh
scr
cu=
a
—
aie
o
Se eS ct | 8.0
£ẽrLuim urate, mgfciL
A high level of SCr is a predictor of ESRD
lseki et al. Hypertens Res. 2007;24(6):691-607.
Tăng acid uric và bệnh thận mạn
Risk of renal failure increases
with hyperuricemia
: *P< 01 vs Moderate
Relative risk of 7
renal failure 6
5
Moderate Slightly high High
4
(5.0-6.4) (6.5-8.4) (8.5)
3
2
1
0
Low
(0.3-4.9)
Serum urate level (mg/dL)
Tăng acid uric và béo phi
9007 eGFR >60 : per 1.73 m 2 *p<0.05, **p<0.01, ***p<0.001
50“
6007 mL/min
450“
20% Hypertension 4.0% ~ Diabetes mellitus
*x** * *x**
q)
© 3.5% +
a ——
3 30%
Seum uric acid (umol/L)
Total Men Women e 2.5% + ¬
IÑ Normouricemia
@ 2.0% - Men Women [] Hyperuricemia
2 15% |
2 1.0%
E
5 0.5%
0.0% -
Total
Dyslipidemia Chronic kidney disease Overweight/obesity
® 35% ... _ —. ® 25% see x khát ® 14% ++* +. *.*
= 30% = 12% — —]
oO © 20% œ
25% 5 10% —L
“2= 20% [] =2 15% =E 8% P|
sg 1 Z$ 0 Es 6%
—+% +— Ề =." P _ -
Undt55 5% - Ổ 5% Ổ 2% + ñ
0% - r 0% +
0% 1
Total Men Women Men Women Total Men Women
Total
Nurshad Ali. PLoS One. 2018; 13(11): e0206850
Masanari Kuwabara. Hypertension. 2017;69:1036-1044