Bioprocess Engineering Principles / Pauline M. Doran (Phần 2)
Bạn đang xem bản rút gọn của tài liệu. Xem và tải ngay bản đầy đủ của tài liệu tại đây (38.44 MB, 227 trang )
<span class="text_page_counter">Trang 1</span><div class="page_container" data-page="1">
know Fick's lawin terms of the diffusion coefficient, 2g: be able to describe in simple terms the mathematical analogy between mass, heat and momentum transfer; know the empirical equation for rate of mass transfer in terms of the masr-transfer coefficient and concentration-difference driving force,
(¥) know the importance of the critical oxygen concentration; (vi) be able to identify which steps are most likely to present
major resistances to oxygen mass transfer from bubbles tocells;
understand how oxygen mass-transfer and É,z can limit the biomass density in fermenters;
understand the mechanisms of gas dispersion and coales-cencein stirred fermenters and the importance of bubble size in determining gas hold-up and k, 4;
know how cemperature, total pressure, oxygen partial pressure and presence of dissolved and suspended material in the medium affect oxygen solubility and rates of oxygen mass transfer in fermenters; and know the techniques and limitations of steady-state and dynamic methods for experimental determination of k,.4 for oxygen transfer.
9.1 Rate-controlling processes in fermentation
Serratia marcescens bacteria are used for production of threo-nine. The maximum specific oxygen uptake rate of S.
‘marcescens in batch culture is 5 mmol O, g~! h~!, The
bac-teria are grown in a stirred fermenter to a cell density of
40g1—}; bya under these circumstances is 0.15 s1, At the
fermenter operating temperature and pressure, the solubility
of oxygen in the culture liquid is 8 x 10~3 kg m~3, Is the rate
of cell metabolism limited by mass-transfer, or dependent solely on metabolic kinetics?
9.2 k,arequired to maintain critical oxygen
A genetically-engineered strain of yeast is cultured in a bio-reactor at 30°C for production of heterologous protein. The oxygen requirement is 80 mmol I~! h~Ì; the critical oxygen concentration is 0.004 mM. The solubility of oxygen in the fermentation broth is estimated to be 10% lower than in water due to solute effects.
(a) What is the minimum mass-transfer coefficient necessary to sustain this culture if the reactor is sparged with air at
(b) What mass-transfer coefficient is required if pure oxygen
is used instead of air?
9.3 Single-point k, a determination using the oxygen-balance method
A 200-litre stirred fermenter contains a batch culture of Bacillus subtilis bacteria at 28°C. Air at 20°C is pumped into the vessel at a rate of 1 vvm; (vvm stands for volume of gas per volume of liquid per minute). The average pressure in the fer-menter is 1 atm. The volumetric flow rate of off-gas from the
fermenter is measured as 189 | min” '. The exit gas stream is
analysed for oxygen and is found to contain 20.1% O,. The dissolved-oxygen concentration in the broth is measured using an oxygen electrode as 52% air saturation. The solubility of oxygen in the fermentation broth at 28°C and 1 atm air press-ure is 7.8 x 1073 kg mTM>.
(@) Calculate the oxygen transfer rate.
(b) Determine the value of &, 2 for the system.
(©) The oxygen analyser used to measure the exit gas composi-tion has been incorrectly calibrated. If the oxygen content has been overestimated by 10%, what error is associated with the result for ka?
The stirred fermenter used for this culture has an operating
volume of 20 mỔ and a liquid height of 3.5 m. Air at 25°C is
sparged into the bottom of the vessel at a rate of 25 m? mịn 1, Oxygen tension in the fermenter is measured using polaro-graphic electrodes located at the top and bottom of the vessel. Ac the top the reading is 50% air saturation; the reading at che bottom is 65%. The gas flow rate leaving the fermenter is
measured with a rotary gas meter and is found to be 407 Ì s~!.
</div><span class="text_page_counter">Trang 2</span><div class="page_container" data-page="2">(@) Calculate the pressure at the sparger. (Static pressure p,
due to the height of liquid is given by the equation: p, = p gh, where p is liquid density, gis gravitational accelera-tion, and his liquid height.)
(b) Estimate the solubility of oxygen in the fermentation
broth at 35°C and | atm air pressure using the correlation of Eq. (9.45).
(©) Estimate the solubility of oxygen at the bottom of the tank.
(4) Calculate the logarichmic-mean concentration driving
force, (Cty — Cu); (©) Whatis the oxygen transfer rate? (Ð_ Determine the value of ky ⁄.
(g) What is the maximum cell concentration that can be sup-ported in this fermenter if the oxygen demand of the organism is 7.4 mmol g~! h7?
9.5 Dynamic &,measurement
The dynamic method is used to measure #z in a fermenter operated at 30°C. Data for dissolved-oxygen concentration as a function of time during the re-oxygenation step is as follows:
Time(s) Cay (% air saturation)
9.6 Measurement of &, aas a function of
stirrer speed: the oxygen-balance method of Mukhopadhyay and Ghose
Combining Eqs (9.37) and (9.48) gives:
: 1 TPAG\_ (fSPAs
(cụ Cw) gr, || = le na ) |:
(9P6.1) Let us make the following assumptions.
(i) the volumetric flow rate of exit gas is equal to that of the
inlet, le. (F),= (Fy), = Fasand
Gi) inlet and outlet gases have the same density, Le.
()- (
where pis total gas pressure.
Applying these assumptions, Eq. (9P6.1) can be written as:
where yg is the mole fraction of oxygen in the gas. Rearranging gives an expression for Cay:
Cue E>
A4 aRTV,
<sup>[Ong ~ OAo),] </sup>In Eq. (9P6.3) the only variables are Cay and (yac)„; Chi Pr Fy kya RT, Vị and (yac)jate assumed to be constant. Accordingly, a linear plot of Cg, versus [ (Jaq); ~ (zAc),Ì should give a straight line with slope
haRTV, and intercept Ch.
Data collected during fermentation of Pseudomonas ovalis B1486 at varying stirrer speeds are given by Mukhopadhyay and Ghose [36]. The fermenter volume was 3 litres. Air flow into the vessel was maintained at 1 wm (vm means volume of gas pet volume of liquid per minute). The air pressure was 3 atm and the temperature 29°C. The following data were measured.
</div><span class="text_page_counter">Trang 3</span><div class="page_container" data-page="3">Fermentation Agitator speed
(a) Determine k, for each stirrer speed.
(b) What is the solubility of oxygen in the fermentation broth?
(©) By considering Eq. (9.39) and Eq. (9P6.2) together,
cal-culate the maximum cellular oxygen uptake rate at each stirrer speed.
1. Treybal, R.E. (1968) Mass- Transfer Operations, 2nd edn, McGraw-Hill, Tokyo.
2. Sherwood, T.K., R.L. Pigford and C.R. Wilke (1975) Mass Transfer, McGraw-Hill, New York.
3. Perry, R.H., D.W. Green and J.O. Maloney (Eds) (1984) Chemical Engineers' Handbook, 6th edn, McGraw-Hill, New York.
4. Coulson, J.M. and J.F. Richardson (1977) Chemical Engineering, vol. 1, 3rd edn, Chapters 8 and 10, Pergamon Press, Oxford.
5. Brauer, H. (1985) Analogy of momentum, heat and mass transfer, In: H.-J. Rehm and G. Reed (Eds), Biotechnology, vol. 2, pp. 153-157, VCH, Weinheim. 6. Bailey, J.E. and D.F. Ollis (1986) Biochemical
Engineering Fundamentals, 2nd edn, McGraw-Hill, New York.
7. Johnson, M.J. (1946) Metabolism of penicillin-produc-ing molds. Ann. N.Y. Acad. Sci. 48, 57-66.
8. Andrew, S.P.§. (1982) Gas-liquid mass transfer in microbiological reactors. Trans. IChE. 60, 3-13. 9. Heijnen, JJ„ K. vant Riet and AJ. Wolthuis (1980)
Influence of very small bubbles on the dynamic #„4 <small>20.</small>
measurement in viscous gas-liquid systems. Biotechnol. Bioeng. 22, 1945-1956.
). Westerterp, K.R., L.L. van Dierendonck and J.A. de Kraa
(1963) Interfacial areas in agitated gas-liquid contactors.
Chem. Eng. Sci. 18, 157-176.
. Kawase, Y. and M. Moo-Young (1990) The effect of ancifoam agents on mass transfer in bioreactors. Bioprocess Eng. 5, 169-173.
. Prins, A. and K. van't Riet (1987) Proteins and surface effects in fermentation: foam, antifoam and mass trans-fer. Trends in Biotechnol. 5, 296-301.
. Lee, Y.H. and G.T. Tsao (1979) Dissolved oxygen elec-trodes. Adv. Biochem. Eng. 13, 35-86.
|. Atkinson, B. and F. Mavituna (1991) Biochemical Engincering and Biotechnology Handbook, 2nd edn, Chapter 18, Macmillan, Basingstoke.
. Truesdale, G.A., A.L. Downing and G.F. Lowden (1955) The solubility of oxygen in pure water and
sea-water. J. Appl. Chem. 5, 53-62.
. Battino, R. and H.L. Clever (1966) The solubility of gases in liquids. Chem. Rev. 66, 395-463.
. Stephen, H. and T. Stephen (Eds) (1963) Solubilities of Inorganic and Organic Compounds, vol. 1, pp. 87-88, Pergamon Press, Oxford.
. International Critical Tables (1926) McGraw-Hill, New York.
. Hikita, H., S. Asai and Y. Azuma (1978) Solubility and diffusivity of oxygen in aqueous sucrose solutions. Can. J. Chem. Eng. 56, 371-374.
Schumpe, A., I. Adler and W.-D. Deckwer (1978)
</div><span class="text_page_counter">Trang 4</span><div class="page_container" data-page="4">Schumpe, A. and W.-D. Deckwer (1979) Estimation of ©, and CO, solubilities in fermentation media. Biotechnol. Bioeng. 21, 1075-1078.
Baburin, LA., J.E. Shvinka and U.E, Viesturs (1981) Equilibrium oxygen concentration in fermentation fluids, Eur. J.Appl. Microbiol. Biotechnol. 13, 15-18. Quicker, G., A. Schumpe, B. Kénig and W.-D. Deckwer
(1981) Comparison of measured and calculated oxygen
solubilities in fermentation media. Biotechnol. Bioeng. 23, 635-650.
Ju, L-K, CS. Ho and RF, Baddour (1988) Simultaneous measurements of oxygen diffusion coeffi-cients and solubilities in fermentation media with polarographic oxygen electrodes. Biotechnol. Bioeng. 31, 995-1005.
Oosterhuis, N.M.G. and N.W.F. Kossen (1983) Oxygen transfer in a production scale bioreactor. Chem. Eng. Res. Des. 61, 308-312.
van't Riet, K. (1979) Review of measuring methods and results in nonviscous gas-liquid mass transfer in stirred vessels. Ind. Eng. Chem. Process Des. Dev. 18, 357-364. Brooks, J.D., D.G. Maclennan, J.P. Barford and RJ. Hall (1982) Design of laboratory continuous-culture equipment for accurate gaseous metabolism measure-ments. Biotechnol, Bioeng. 24, 847-856.
‘Wernau, W.C. and C.R. Wilke (1973) New method for evaluation of dissolved oxygen probe response for Ka determination. Biotechnol. Bioeng. 15, 571-578. Dunn, LJ. and A. Einsele (1975) Oxygen transfer coeffi-cients by the dynamic method. J. Appl. Chem. Biotechnol. 25, 707-720.
Linek, V. and V. Vacek (1976) Oxygen electrode response lag induced by liquid film resistance against oxy-gen transfer. Biotechnol. Bioeng. 18, 1537-1555.
31. Linek, V. and V. Vacek (1977) Dynamic measurement of the volumetric mass transfer coefficient in agitated vessels: effect of the start-up period on the response of an oxygen electrode. Biotechnol. Bioeng. 19, 983-1008. 32, Dang, N.D.P., D.A. Karrer and IJ. Dunn (1977)
Oxygen transfer coefficients by dynamic model moment analysis. Biotechnol. Bioeng. 19, 853-865.
33. Philichi, T.L. and M.K. Stenstrom (1989) Effects of dis-solved oxygen probe lag on oxygen transfer parameter estimation. J. Water Poll.Contr. Fed. 61, 83-86. 34. Merchuk, J.C., S. Yona, M.H. Siegel and A. Ben Zvi
(1990) On the first-order approximation to the response
of dissolved oxygen electrodes for dynamic K, a estima-tion. Biotechnol. Bioeng. 35, 1161-1163.
35. vantt Riet, K. and J. Tramper (1991) Basic Bioreactor Design, Chapter 11, Marcel Dekker, New York. 36. Mulhopadhyay, S.N. and T.K. Ghose (1976) A simple
dynamic method of k, determination in laboratory fer-menter. J, Ferment. Technol, 54, 406-419.
Suggestions for Further Reading Mass-transfer theory (see also refs 1, 2 and 4)
McCabe, W.L. and J.C, Smith (1976) Unit Operations of Chemical Engineering, 3rd edn, Section 4, McGraw-Hill, Tokyo.
Oxygen transfer in fermenters
Bell, G.H. and M. Gallo (1971) Effect of impurities on oxy-gen transfer. Process Biochem. 6 (April), 33-35. van't Riet, K. (1983) Mass transfer in fermentation. Trends in
Biotechnol. 1, 113-119.
</div><span class="text_page_counter">Trang 5</span><div class="page_container" data-page="5">Unit Operations
Bioprocesses treat raw materials and generate useful products. Individual operations or steps within the process that change or separate components are called unit operations. Although the specific objectives of bioprocesses vary from factory to factory, each processing scheme can be viewed as a series of component operations which appear again and again in different systems. For example, most bioprocesses involve one or more of the following unit operations: centrifugation, chromatography, cooling, crystallisation, dialysis, distillation, drying, evaporation, filtration, heating, humidification, membrane separation, milling, mixing, precipitation, solids handling, solvent extraction. A particular sequence of unit operations usedfor manufacture of enzymes is shown in the flow sheet of Figure 10.1. Although the same operations are involved in other processes, the order in which they are carried out, the conditions used and the actual materials handled account for the differences in final results. Engineering principles for design of unit operations are independent of specific industries or applications.
In a typical fermentation process, raw materials are altered most significantly by reactions occurring in the fermenter. However physical changes before and after fermentation are also important to prepare the substrates for reaction and to extract and purify the desired product from the culture broth. “The term ‘unic operation’ usually refers to the physical steps in processes; chemical or biochemical transformations are the subject of reaction engineering which is considered in detail in Chapters 11-13.
Fermentation broths are complex mixtures of components containing products in dilute solution. In bioprocessing, any treatment of the culture broth after fermentation is known as downstream processing. The purpose of downstream processing is to concentrate and purify the product for sale; in most cases this requires only physical modification. Although each recov-ery scheme will be different, downstream processing follows a general sequence of steps.
(Cell removal. A common first step in product recovery is removal of cells from the fermentation liquor. This is necessary if the biomass itself is the desired product, e.g. bakers’ yeast, or if the product is contained within the cells. Removal of cells can also assist recovery of product from the liquid phase. Filtration and centrifugation are typical unit operations for cell removal.
ii) Primary isolation. A wide variety of techniques is available for primary isolation of fermentation products from cells or cell-free broth. The method used depends on the phys-ical and chemphys-ical properties of the product and
surrounding material. The aim of primary isolation is to remove components with properties significantly differ-ent from those of the product. Typically, processes for primary isolation treat large volumes of material and are relatively non-selective; however significant increases in product quality and concentration can be accomplished. Unit operations such as adsorption, liquid extraction and precipitation are used for primary isolation. Purification. Processes for purification are highly selective and separate the product from impurities with similar properties. Typical unit operations are chromatography, ultrafiltration and fractional precipitation.
Final isolation. The final purity required depends on the product application. Crystallisation, followed by centri-fugation or filtration and drying, are typical operations used for high-quality products such as pharmaceuticals. (iii)
A ypical profile of product quality through the various stages of downstream processing is given in Table 10.1.
Downstream processing can account for a substantial part of the total production cost of a fermentation product. For example, the ratio of fermentation cost to cost of product recovery is approximately 60:40 for antibiotics such as penicil-lin. For newer antibiotics this ratio is reversed; product recovery is more costly than fermentation, Many modern products of biotechnology such as recombinant proteins and monoclonal antibodies require expensive downstream process-ing which accounts for 80-90% of process costs [1]. Startprocess-ing product levels before recovery have a strong influence on cost;
</div><span class="text_page_counter">Trang 6</span><div class="page_container" data-page="6">Figure 10.1 ‘Unit operations used in manufacture of enzymes, (From B. Atkinson and F. Mavituna, 1991, Biochemical Engineering and Biotechnology Handbook, 2nd edn, Macmillan, Basingstoke; and W.T.. Faith, C.E. Neubeck and E.T. Reese, 1971, Production and applications of enzymes, Adv. Biochem. Eng. 1,77-111.)
<small>‘Animal Tove</small>
Concentrated Standardised
<small>gu products Spetaty tems) tr produc</small>
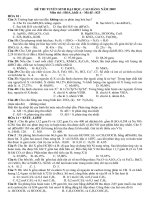
purification is more expensive when the concentration of product in the biomass or fermentation broth is low. As illus-trated in Figure 10.2, the higher the starting concentration the “ cheaper is the final product, Each downstream-processing step involves some product loss; these losses can be substantial for multi-step procedures, For example, if 80% of the product is retained at each purification step, after a five-step process the overall product recovery is only about one-third. If the starting
with higher attendant losses and costs. This situation can be improved by either enhancing product synthesis during fer-mentation or developing better downstream-processing techniques which minimise product loss.
There is an extensive literature on downstream processing, much oft dealing with recent advances. To thoroughly cover all unit operations used in bioprocessing is beyond the scope of this book; at least one entire separate volume would be required.
</div><span class="text_page_counter">Trang 7</span><div class="page_container" data-page="7">Table 10.1 Typical profile of product quality during downstream processing
(From P.A. Belter, E.L. Cussler and W.-S. Hu, 1988, Bioseparations: Downstream Processing For Biotechnology, John Wiley, New York)
Step Typical
unit operation Harvest broth -Cell removal Filtration Primary isolation Extraction
Purification Chromatography
Final isolation Crystallisation
engineering principles of a small selection of unit operations commonly applied for recovery of fermentation products. Information about other equally-important unit operations can be found in references listed at the end of the chapter.
10.1 Filtration
In filtration, solid particles are separated from a fluid-solid mixture by forcing the fluid through a filter medium or filter cloth which retains the particles. Solids are deposited on the fil-ter and, as the deposit or filfil-ter cake increases in depth, pose a resistance to further filtration. Filtration can be performed using either vacuum or positive-pressure equipment. The pressure difference exerted across the filter to separate fluid from the solids is called the filtration pressure drop.
Ease of filtration depends on the properties of the solid and fluid; filtration of crystalline, incompressible solids in low-viscosity liquids is relatively straightforward. In contrast, fermentation broths can be difficult to filter because of the small size and gelatinous nature of the cells and the viscous non-Newronian behaviour of the broth. Most microbial filter cakes are compressible i.e. the porosity of the cake declines as pressure drop across the filter increases. This can be a major problem causing reduced filtration rates and greater loss of product. Filtration of fermentation broths is usually carried out under non-aseptic conditions; the process must therefore be efficient and reliable to avoid undue contamination and degradation of labile products.
filtration. Diatomaceous earth, also known as kieselguhr, is the fused skeletal remains of diatoms. Packed beds of granu-lated kieselguhr have very high porosity; only about 15% of the total volume of packed kieselguhr is solid, the rest is empty space. Such high porosity facilitates liquid flow around the particles and improves rate of filtration through the bed.
Filter aids are applied in two ways. As shown in Figure 10.3, filter aid can be used as a pre-coat on the filter medium to prevent blockage or ‘blinding’ of the filter by solids which would otherwise wedge themselves into the pores of the cloth. Filter aid can also be added to the fermentation broth to increase the porosity of the cake as it forms. This is only rec-ommended when the fermentation product is extracellular; for intracellular products requiring further processing of the cells, severe handling problems can arise ifthe cake is contami-nated with filter aid. Filter aid adds to the cost of filtration; the minimum quantity needed to achieve the desired result must be established experimentally. Kieselguhr absorbs liquid; therefore, if the fermentation product is in the liquid phase, some will be lost. Another disadvantage is that as filtration race increases with the assistance of filter aid, filtrate clarity is reduced. Disposal of waste cell material is more difficult if it contains kieselguhr; for example, biomass cannot be used as animal feed unless the filter aid is removed.
Fermentation broths can be pre-treated to improve filtra-tion characteristics. Heating to denature proteins enhances the filrerability of mycelial broths such as in penicillin production. Alternatively, electrolytes may be added to promote coagula-tion of colloids into larger, denser particles which are easier to filter. Ease of filtration is also affected by the duration of the fermentation; this affects the composition and viscosity of the
</div><span class="text_page_counter">Trang 8</span><div class="page_container" data-page="8">Figure 10.2 Relationship between selling price and concentration before downstream processing for several fermentation products. (From J.L. Dwyer, 1984, Scaling up bio-product separation with high performance liquid chromatography, Bio/Technology 2, 957-964; and J. van Brunt, 1988, How big is big enough? Bio/Technology 6, 479-485.)
<small>.- geo Tate pssminogen ativan (97)</small>
H proteases Pr — — = — Hepatitis B vaccine (1986)
Selling price (US$ kg ”')Pre-coat of Figue 10.3. Use of filter aid in filtration of fermentation
Filter cake filter aid ma
<small>of removed</small>
<small>solids and 1 H</small>
Bi để 10.1.2 Filtration Equipment
_— Plate filters are suitable for filtration of small fermentation
- batches; this type of filter gradually accumulates biomass and > must be periodically opened and cleared of filter cake. Larger > processes require continuous filters. Rotary-drum vacuum fil-> ters, such as that shown in Figure 10.4, are the most - = widely-used filtration devices in the fermentation industry. A
Diséetion horizontal drum 0.5~3 m in diameter is covered with filter
of flow of —#m Filtrate ỉ a
neni cà. cloth and rotated slowly at 0.1-2 rpm. The cloth is partially
broth cảm immersed in an agitated reservoir containing material to be
fil-ae tered. As a section of drum enters the liquid, a vacuum is
> applied from the interior of the drum. A cake forms on the face
> of the cloth while liquid is drawn through internal pipes to a
> ®\ collection tank. As the drum rotates out of the reservoir, the _— a surface of the filter is sprayed with wash liquid which is drawn
; through the cloth and collected in a separate holding tank.
Ae nike After washing, the cake is dewatered by continued application fermentation cloth of the vacuum. The vacuum is turned off as the drum reaches
broth the discharge zone where the cake is removed by means of a
</div><span class="text_page_counter">Trang 9</span><div class="page_container" data-page="9">Figure 10.4 Continuous rotary-drum vacuum filter. (From 1 Ap G.G. Brown, A.S. Foust, D.L. Katz, R. Schneidewind, R.R. A
White, W.P. Wood, G.M. Brown, L.E. Brownell, J.J. “r# (4 ) Tm
Martin, G.B. Williams, J.T. Banchero and J.L. York, 1950, (10.1) Unit Operations, John Wiley, New York.)
<small>Cake saturatedwith wash liquor</small>
<small>Cake saturated</small> <sub>Cake forming</sub>
<small>with filtrate</small> <sub>device</sub><sup>‘Stirring</sup>
stage to help dislodge the filter cake from the cloth. After the cake is removed, the drum re-enters the reservoir for another fileration cycle.
10.1.3 Filtration Theory
Filtration theory is used to estimate rate of filtration. For agiven pressure drop across the filter, rate of filtration is greatest just as filtering begins. This is because resistance to filtration is at a minimum when there are no deposited solids. Orientation of particles in the initial cake deposit is very important and can sig-nificantly influence the structure and permeability of the whole filter bed. Excessive pressure drop and high initial rates of iltra-tion can result in plugging of the filter cloth and very high subsequent resistance to flow. Flow resistance due to the filter cloth can be considered constant if particles do not penetrate the material; resistance due to the cake increases with thickness.
Rate of filtration is usually measured as the rate at which liquid filtrate is collected. Filtration rate depends on the area of the filter cloth, the viscosity of the uid, the pressure difference across the filter, and the resistance to filtration offered by the cloth and deposited filter cake, Atany instant during filtration, rate of filtration is given by the equation:
where Ais filter area, Vis volume of filtrate, tis filtration time, Apis pressure drop across the filter, 4; is filtrate viscosity, M_ is the total mass of solids in the cake, avis the average specific cake resistance and rạn is the filter medium resistance. r_ includes the effect of the filter cloth and any particles wedged in it during the initial stages of filtration. œ has dimensions LM~}; r,, has
dimensions L~!. 4¥i/,, is the filtrate flow rate or volumetric rate
of filtration. Area A represents the capital cost of the filter; the bigger the area required to achieve a given filtration rate, the larger is the equipment and related investment. ais a measure of the resistance of the filter cake to flow; its value depends on the shape and size of the particles, the size of the interstitial spaces between them, and the mechanical stability of the cake. Resistance due to the filter medium is often negligible com-pared with cake resistance.
If the filter cake is incompressible, the specific cake resistance at does not vary with pressure drop across the filter. However, cakes from fermentation broths are seldom incompressible; as these cakes compress, filtration rates decline. For a compressible cake, œ can be related empirically to A pas follows:
a =a’ (Ap)’
(10.2) where sis cake compressibility and a is a constant dependent largely on the size and morphology of particles in the cake. The value of z is zero for rigid incompressible solids; for highly compressible material sis close to unity. ais also related to the average properties of particles in the cake as follows:
2e c?,
(10.3) where K,,isa factor depending on the shape of the particles, ais the specific surface area of the particles, €is porosity of the cake and p, is density of the particles. aand €are defined as follows:
_ surface area of a single particle _
~ ~volume ofasingle particle `
(10.4) total volume of the cake — volume of solids in the cake
total volume of the cake
</div><span class="text_page_counter">Trang 10</span><div class="page_container" data-page="10">For compressible cakes, both € and Ấ, depend on filtration pressure drop.
Tris useful to consider methods for improving rate of filtra-tion for a given batch of material. Various strategies can be deduced from the relationship between variables in Eq. (10.1).
(i) Increase the filter area A, When all other parameters
remain constant, rate of filtration is improved if 4 is increased. However, this requires installation of larger fil-tration equipment and greater capital cost.
Increase thefiltration pressure drop A p. The problem with this approach for compressible cakes is that a increases with Ap as indicated in Eq. (10.2); higher ø results in lower filtration rate. In practice, pressure drops are usual-ly kept below 0.5 atm to minimise cake resistance. Improving filtration rate by increasing the pressure drop can only be achieved by reducing s the compressibility of the cake. Addition of filter aid in the broth can reduce sto
<small>some extent.</small>
(iii) Reduce she cake mass M,. This is achieved in continuous
rotary filtration by reducing the thickness of cake depos-ited per revolution of the drum, and ensuring that the scraper leaves minimal cake residue on the filter cloth. Reduce the liquid viscosity mẹ: Material to be filtered is sometimes diluted if the starting viscosity is very high. Reduce she specific cake resistance a. From Eq. (10.3), poss-ible methods of reducing a for compressposs-ible cakes are as follows:
(a) Increase the porosity €. Cake porosity usually
decreases as cells are filtered. Application of filter aid reduces this effect.
Reduce the shape factor of the particles K,, In the case~ of mycelial broths, it may be possible to change the morphology of the cells by manipulating fermenta-tion condifermenta-tions.
Reduce the specific surface area of the particles a. Increasing the average size of the particles and mini-mising variation in particle size reduce the value of a. Changes in fermentation conditions and broth pre-treatment are used to achieve these effects.
Integration of Eq. (10.1) allows us to calculate the time required to filter a given volume of material. Before carrying out the integration, let us substitute an expression for mass of solids in the cake as a function of filtrate volume:
MẸ= cV;
(10.6) where cis the mass of solids deposited per volume of filtrate
filtered. Substituting Eq. (10.6) into Eq. (10.1), the expression for rate of filtration becomes:
(10.7) A filter can be operated in two different ways. If the pressure drop across the filter is kept constant, the filtration rate will become progressively smaller as resistance due to the cake increases. On the other hand, in constant-rate filtration the flow rate is maintained by gradually increasing the pressure drop. Filtrations are most commonly carried out at constant pressure. When this is the case, Eq. (10.7) can be integrated directly because V; and tare the only variables; for a given fil-tration device and material to be filtered, each of the remaining Ac the beginning of filtration z= 0 and V;=0; this is the initial condition for integration. Separating variables and placing constants outside the integral signs gives:
4 far-( 2) yan + (#2) Jax.
<sub>AAp Ap</sub>Thus, for constant-pressure filtration, Eq. (10.10) can be used to calculate either filtrate volume V; or filtration time # pro-vided all the constants are known. ở and r.,, for a particular filtration must be evaluated beforehand. For experimental determination of wand r,,, Eq. (10.10) is rearranged by divid-ing both sides of the equation by AV;:
<small>t a.</small>
= > (fam) Yr (
ve 2A? Ap(10.11)
</div><span class="text_page_counter">Trang 11</span><div class="page_container" data-page="11">+ K, and K, are constant during constant-pressure filtration. Eq, (10.12) is therefore an equation of a straight line when f//, (10.12) _ is plotted against V¿. The slope K, depends on the filtration pressure drop and properties of the cake; the intercept Ấ2 also
ease depends on pressure drop but is independent of cake
proper-ties. œ is calculated from the slope; r,, is determined from the intercept. Eq. (10.12) is valid for compressible cakes; however K, becomes a more complex function of Ap than is directly apparent from Eq. (10.13) because of the dependence of aon
Eq. (10.11) is the basic filtration equation for industrial-scale equipment such as the rotary-drum vacuum filter shown in Figure 10.4; rates of filtration during cake formation and
K,= Hin, washing determine the size of the filter required for the
pro-cess. Simple modifications to Eq. (10.11) give equations (10.14) whichare directly applicable to rotary-drum filters [2]. (10.13)
Example 10.1 Filtration of mycelial broth
‘A30-ml sample of broth from a penicillin fermentation is filtered in the laboratory on a 3 cm? filter at a pressure drop of 5 psi. The filtration time is 4.5 min. Previous studies have shown that filter cake of Penicillium chryrogenum is significantly compress-ible with s = 0.5. If 500 litres broth from a pilot-scale fermenter must be filtered in 1 hour, what size filter is required if the pressure drop is:
</div><span class="text_page_counter">Trang 12</span><div class="page_container" data-page="12">(b) When Ap=5 psi:
(0.201 cm ~? (psi) min) . (5 psi)®3~! ÌU2 1000 cm?
2(1h).
(1h) TE
= 1.37 104 cm?= 1.37 m.
Halving the pressure drop increases the area required by only 20% because at 5 psi the cake is less compressed and more porous than at 10 psi
Example 10.1 underlines the importance of laboratory testing in design of fileration systems. Experiments are required to evaluate properties of the cake such as compressibility and specific resistance; these parameters cannot be calculated from theory. Experimental observations are also necessary to evalu-ate a wide range of other important filtration characteristics. These include filtrate clarity, ease of washing, dryness of the final cake, ease of cake removal, and effects of filter aids and broth pre-treatment. It is essential that any laboratory tests be conducted with the same materials as the large-scale process. Variables such as temperature, age of the broth, and presence of contaminants and cell debris have significant effects on fil-tration characteristics.
In general, fungal mycelia are filtered relatively easily because mycelial filter cake has sufficiently large porosity. Yeast and bacteria are much more difficult to handle because of their small size. Alternative filtration methods which elimi-nate the filter cake are becoming more accepted for bacterial and yeast separations, Microfileration is achieved by develop-ing large cross-flow fluid velocities across the filter surface while the velocity normal to the surface is relatively small. Build-up of filter cake and problems of high cake resistance are therefore prevented. Microfiltration is not covered in this texts
10.2 Centrifugation
Centrifugation is used to separate materials of different den-sity when a force greater than gravity is desired, In Figure 10.5 Separation of solids in a tubular-bowl
</div><span class="text_page_counter">Trang 13</span><div class="page_container" data-page="13">bioprocessing, centrifugation is used to remove cells from fer-mentation broth, to eliminate cell debris, to collect precipitates, and to prepare fermentation media such as in clarification of molasses or production of wort for brewing. Equipment for centrifugation is more expensive than for filtra-tion; however centrifugation is often effective when the particles are very small and difficult to filter. Centrifugation of fermentation broth produces a thick, concentrated cell sludge or cream containing more liquid than filter cake.
Steam-sterilisable centrifuges are applied when either the cells or fermentation liquid is recycled to the fermenter or when product contamination must be prevented. Industrial centrifuges generate large amounts of heat due to friction; itis therefore necessary to have good ventilation and cooling. Aerosols created by fast-spinning centrifuges have been known to cause infections and allergic reactions in factory workers so that isolation cabinets are required for certain applications.
Centrifugation is most effective when the particles to be separated are large, the liquid viscosity is low, and the density difference between particles and fluid is great. Ít is also assisted by large centrifuge radius and high rotational speed. In centri-fugation of biological solids such as cells, the particles are very small, the viscosity of the medium can be relatively high, and the particle density is very similar to the suspending fluid. ‘These disadvantages are easily overcome in the laboratory with small centrifuges operated at high speed. However, problems arise in industrial centrifugation when large quantities of material must be treated. Centrifuge capacity cannot be increased by simply increasing the size of the equipment with-out limit; mechanical stress in centrifuges increases in
proportion to (radius)? so that safe operating speeds are
sub-stantially lower in large equipment. The need for continuous throughput of material in industrial applications also restricts practical operating speeds. To overcome these difficulties, a Figure 10.6 Disc-stack bowl centrifuge with continuous discharge of solids.
<small>Heavy-liquid discharge</small>
<small>Clean-in-place nozzle</small>
</div><span class="text_page_counter">Trang 14</span><div class="page_container" data-page="14">Figure 10.7 Mechanism of solids separation in a disc-stack bowl centrifuge. (From C.J. Geankoplis, 1983, Transport Processes and Unit Operations, 2nd edn, Allyn and Bacon,
range of centrifuges has been developed for bioprocessing. ‘Types of centrifuge commonly used in industrial operations are described below.
10.2.1 Centrifuge Equipment
Centrifuge equipment is classified according to internal structure, The subular-bowl centrifuge has the simplest configuration and is widely employed in the food and pharma-ceutical industries. Feed enters under pressure through a nozzle at the bottom, is accelerated to rotor speed, and moves upwards through the cylindrical bowl. As the bowl rotates, particles travelling upward are spun out and collide with the walls of the bowl as illustrated schematically in Figure 10.5. Solids are removed from the liquid if they move with sufficient velocity to reach the wall of the bowl within the residence time of liquid in the machine. As the feed rate is increased the liquid layer moving up the wall of the centrifuge becomes thicker; this reduces performance of the centrifuge by increasing the distance a particle must travel to reach the wall. Liquid from the feed spills over a weir at the top of the bowl; solids which have collided with the walls are collected separately. When the
tion of the liquid-overflow weir, separation efficiency declines rapidly. This limits the capacity of the centrifuge. Tubular centrifuges are applied mainly for difficult separations requir-ing high centrifugal forces. Solids in tubular centrifuges are accelerated by forces between 13 000 and 16 000 times the force of gravity.
Atype of narrow tubular-bowÌ centrifuge is the ultracentri-_fage. This device is used for recovery of fine precipitates from high-density solutions, for breaking down emulsions, and for separation of colloidal particles such as ribosomes and
mito-chondria. It produces centrifugal forces 105-105 times the
force of gravity. The bowl is usually air-driven and operated at low pressure or in an atmosphere of nitrogen to reduce generation of frictional heat. The main commercial applica-tion of ultracentrifuges has been in producapplica-tion of vaccines to separate viral particles from cell debris. Ultracentrifugation has also been tested for removal of very fine cell debris in isola-tion of enzymes, and for ribosome removal in purificaisola-tion of RNA polymerase. A typical ultracentrifuge operates discon-tinuously so its processing capacity is restricted by the need to empty the bowl manually. Continuous ultracentrifuges are available commercially; however safe operating speeds with these machines are not as high as in batch equipment.
An alternative to the tubular centrifuge is the dise-stack bowl centrifuge. Disc-stack centrifuges are common in bio-processing. There are many types of disc centrifuge; the principal difference between them is the method used to dis-charge the accumulated solid. In simple disc centrifuges, solids must be removed periodically by hand. Continuous or inter-mittent discharge of solids is possible in a variety of disc cen-trifuges without reducing the bowl speed. Some cencen-trifuges are equipped with peripheral nozzles for continuous solids removal; others have valves for intermittent discharge. ‘Another method is to concentrate the solids in the periphery of the bowl and then discharge them at the top of the centrifuge using a paring device; the equipment configuration for this mode of operation is shown in Figure 10.6. A disadvantage of centrifuges with automatic discharge of solids is that the solids must remain sufficiently wet to flow through the machine. Extra nozzles may be provided for cleaning the bow! should blockages of the system occur.
Disc-stack centrifuges contain conical sheets of metal called discs which are stacked one on top of the other with clearances as small as 0.3 mm. The discs rotate with the bow! and their function is to split the liquid into thin layers. As shown in Figure 10.7, feed is released near the bottom of the centrifuge and travels upwards through matching holes in the discs, Between the discs, heavy components of the feed are thrown outward under the influence of centrifugal forces as
</div><span class="text_page_counter">Trang 15</span><div class="page_container" data-page="15">lighter liquid is displaced towards the centre of the bowl. As they are flung out, the solids strike the undersides of the discs and slide down to the bottom edge of the bowl. At the same time, the lighter liquid flows in and over the upper surfaces of the discs to be discharged from the top of the bowl. Heavier liquid containing solids can be discharged either at the top of the centrifuge or through nozzles around the periphery of the bowl. Disc-stack centrifuges used in bioprocessing typically develop forces of 5000-15 000 times gravity. As a guide, the minimum density difference between solid and liquid for suc-cessful separation in a disc-stack centrifuge is approximately
0.01-0.03 kg m~3; in practical operations at appropriate low
rates the minimum particle diameter separated is about 0.5 wm [5].
10.2.2 Centrifugation Theory
The particle velocity achieved in a particular centrifuge com-pared with the settling velocity which would occur under the influence of gravity characterises the effectiveness of centrifu-gation. The terminal velocity during gravity settling of a small spherical particle in dilute suspension is given by Stoke's law:
«= UI pr,
18h P
(10.15) where 1, is the sedimentation velocity under gravity, pp is density of the particle, pris density of the liquid, ø is viscosity of the liquid, D, is particle diameter and g is gravitational where u, is particle velocity in the centrifuge, œ is angular velocity of the bowl in units of rad s”Ì and ris radius of the centrifuge drum, The ratio of velocity in the centrifuge to velocity under gravity is called the centrifuge effector g-number, and is usually denoted Z, Therefore:
gravity, and is often expressed as so many g-forces. Industrial centrifuges have Z factors from 300 to 16 000; for small laboratory centrifuges Z may be up to 500 000 [6].
Sedimentation occurs in a centrifuge as particles moving away from the centre of rotation collide with the walls of the centrifuge bowl. Increasing the velocity of motion will improve the rate of sedimentation. From Eq, (10.16), particle velocity in a given centrifuge can be increased by: (increasing the centrifuge speed os (ii) increasing the particle diameter Dy;
(iii) increasing the density difference between particle and liquid, p, ~ øp and
(iv) decreasing the viscosity of the suspending fluid, ø. However, whether the particles reach the walls of the bow! also depends on the time of exposure to the centrifugal force. In batch centrifuges such as those used in the laboratory, centri-fuge time is increased by running the equipment longer. In continuous-flow devices such as the disc-stack centrifuge, the residence time is increased by decreasing the feed flow rate.
Performance of centrifuges of different size can be com-pared using a parameter called the sigmafactor. Physically, Z represents the cross-sectional area of a gravity settler with the same sedimentation characteristics as the centrifuge. For con-tinuous centrifuges, Š is related to the feed rate of material as follows:
(10.18) where Qis the volumetric feed rate and u, is the terminal
velocity of the particles in a gravitational field. If two
centri-fuges perform with equal effectiveness:
x 5
‘ (10.19)
where subscripts 1 and 2 denote the two centrifuges. Eq. (10.19) can be used to scale-up centrifuge equipment. Equations for evaluating E depend on the centrifuge design. Fora disc-stack bowl centrifuge [7]:
24ø?(N— 1
<small>v.. mg ¢ ) (3-93)</small>
3g tan
</div><span class="text_page_counter">Trang 16</span><div class="page_container" data-page="16">where wis angular velocity in rad s~!, Nis number of discs in
the stack, r, is outer radius of the disc, r, is inner radius of the disc, gis gravitational acceleration, and 6ïs the half-cone angle of the disc. For a tubular-bowl centrifuge, the following equa-tion is accurate to within 4% [8, 9]:
Tob (373 +r?)
(10.21) where bis length of the bowl, r; is radius of the liquid surface and r, is radius of the inner wall of the bowl. Because r, and 7, in a tubular-bowl centrifuge are about equal, Eq. (10.21) can be approximated as:
(10.22) where ris an average radius roughly equal to either r, or r2.
The above equations for È are based on ideal operating conditions. Because different types of centrifuge deviate to varying degrees from ideal operation, Eq. (10.19) cannot generally be used to compare different centrifuge configura-tions. Performance of any centrifuge can deviate from theoretical prediction due to factors such as particle shape and size distribution, aggregation of particles, non-uniform flow distribution in the centrifuge and interaction between par-ticles during sedimentation. Experimental tests must be per-formed to account for these factors.
Example 10.2 Cell recovery in a disc-stack centrifuge
A continuous disc-stack centrifuge is operated at 5000 rpm for separation of bakers’ yeast. Ata feed rate of 60 Ï min=!, 50% of
the cells are recovered. At constant centrifuge speed, solids recovery is inversely proportional to flow rate. (a) What flow rate is required to achieve 90% cell recovery if the centrifuge speed is maintained at 5000 rpm?
(b) What operating speed is required to achieve 90% recovery at a feed rate of 60 Ï min” l2
(a) Ifsolids recovery is inversely proportional to feed rate, the flow rate required is:
(b) Eq. (10.19) relates operating characteristics of centrifuges achieving the same separation. From (a), 90% recovery is achieved
at Q, = 33.3 | min”! and ø¡ = 5000 rpm. Q, =60 Ì min
Downstream processing of fermentation broths usually begins
next step depends on location of the desired product. For sub-stances such as ethanol, citric acid and antibiotics which are excreted from cells, product is recovered from the cell-free
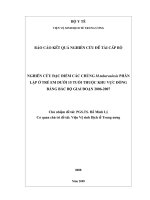
</div><span class="text_page_counter">Trang 17</span><div class="page_container" data-page="17">Figure 10.8 Cell disruption in a high-pressure homogeniser.
For products such as enzymes and recombinant proteins which remain in the biomass, cell disruption must be carried out to release the desired material, A variety of methods is available to disrupt cells. Mechanical options include grinding with abrasives, high-speed agitation, high-pressure pumping and ultrasound. Non-mechanical methods such as osmotic shock, freezing and thawing, enzymic digestion of cell walls, and treatment with solvents and detergents can also be applied
‘A widely-used technique for cell disruption is high-pressure homogenisation. Shear forces generated in this treatment are Figure 10.9 An ideal stage.
sufficient to completely disrupt many types of cell. A common apparatus for homogenisation of cells is the Manton~Gaulin homogeniser. As indicated in Figure 10.8, this high-pressure pump incorporates an adjustable valve with restricted orifice through which cells are forced at pressures up to 550 atm. The homogeniser is of general applicability for cell disruption, although the homogenising valve can become blocked when used with highly filamentous organisms.
The following equation relates disruption of cells to operat-ing conditions in the Manton~Gaulin homogeniser [10]:
(10.23) In Eq, (10.23), R,, is the maximum amount of protein avail-able for release, Ris the amount of protein released after V passes through the homogeniser, Ais a temperature-dependent rate constant, and pis the operating pressure. The exponent a is a measure of the resistance of the cells to disruption, For Saccharomyces cerevisiae yeast, œ has been determined as 2.9 [10]; however the exponent for a particular organism depends to some extent on growth conditions [11]. The strong depen-dence of protein release on pressure suggests that high-pressure operation is beneficial; complete disruption in a single pass may be possible if the pressure is sufficiently high. Reduction in the number of passes through the homogeniser is generally preferable because multiple passes produce fine cell debris which can cause problems in subsequent clarification
</div><span class="text_page_counter">Trang 18</span><div class="page_container" data-page="18">Release of protein is markedly dependent on temperature; protein recovery increases at elevated temperatures up to 50°C. However, cooling to 0-4°C is recommended during operation of homogenisers to minimise protein denaturation. Procedures for scale-up of homogenisers are not well developed. Methods which work well in the laboratory may give variable results when used at a larger scale.
10.4 The Ideal-Stage Concept
So far, we have considered only the initial steps of downstream processing: cell isolation and disruption. An important group of unit operations used for primary isolation of fermentation products relies on mass transfer to achieve separation of com-ponents between phases. Equipment for these separations sometimes consists of a series of stages in which the phases make intimate contact so that material can be transferred between them. Even if the equipment itself is not constructed in discrete stages, mass transfer can be considered to occur in stages. The effectiveness of each stage in accomplishing mass transfer depends on many factors, including equipment design, physical properties of the phases, and equilibrium rela-tionships.
Consider the simple mixer-settler device of Figure 10.9 for extraction of component A from one liquid phase to another. The mass-transfer principles of liquid-liquid extraction have already been described in Chapter 9; unit operations for extraction are also discussed in the next section. Here, we will use the mixer-settler to explain the general concept of ideal stages. Two immiscible liquids enter the mixing vessel with volumetric flow rates Z¡¡ and Z;si these streams contain A at concentrations Cạ¡ and Ca; respectively. The two liquid phases are vigorously mixed together and A is transferred from ‘one phase to the other. The mixture then passes to a settler where phase separation is allowed to occur under the influence of gravity. The flow rate of light liquid out of the settler is Z„¡; the flow rate of heavy liquid is 7„;. Concentrations of A in these streams are Cy, and CẠ, ›, respectively.
Operation of the mixer-settler relies on the liquids entering not being in equilibrium as far as concentration of A is con-cerned, ie. C,,, and Cạ¡; are not equilibrium concentrations. This means that there exists a driving force in the mixer for change of concentration as A is transferred from one liquid to the other. Depending on the ability of the mixer to promote mass transfer between the liquids and the effectiveness of the settler in allowing phase separation, when the liquids leave the system they will have been brought closer to equilibrium. If the mixer-settler were an ideal stage the two streams leaving it
result from additional contact between the phases; C,,, and Cho would be equilibrium concentrations and the device would be operating at maximum efficiency. In reality, stages are not ideal; the change in concentration achieved in a real stage is always less than in an ideal stage so that extra stages are necessary to achieve the desired separation. The relative per-formance of an actual stage compared with that of an ideal stage is expressed as the stage efficiency.
“The concept of ideal stages is used in design calculations for several unit operations. The importanc elements in analysis of these operations are material balances, energy balances ifappli-cable, and the equilibrium relationships between phases. Application of these principles is illustrated in the following sections.
10.5 Aqueous Two-Phase Liquid Extraction
Liquid extraction is used to isolate many pharmaceutical prod-ucts from animal and plant sources. In liquid extraction of fermentation products, components dissolved in liquid are recovered by transfer into an appropriate solvent, Extraction of penicillin from aqueous broth using solvents such as butyl acetate, amyl acetate or methyl isobutyl ketone, and isolation of erythromycin using pentyl or amyl acetate are examples. Solvent extraction techniques are also applied for recovery of steroids, purification of vitamin B,, from microbial sources, and isolation of alkaloids such as morphine and codeine from raw plant material. The simplest equipment for liquid extrac-tion is the separating funnel used for laboratory-scale product recovery. Liquids forming two distinct phases are shaken together in the separating funnel; solute in dilute solution in one solvent transfers to the other solvent to form a more con-centrated solution. The two phases are then allowed to separate and the heavy phase is withdrawn from the bottom of the funnel. The phase containing the solute in concentrated form is processed further to purify the product. Whatever apparatus is used for extraction, it is important that contact between the liquid phases is maximised by vigorous mixing and turbulence to facilitate solute transfer.
Extraction with organic solvents is a major separation tech-nique in bioprocessing, particularly for recovery of antibiotics. However, organic solvents are unsuitable for isolation of pro-teins and other sensitive biopolymers. Techniques are being developed for aqueous two-phase extraction of these mole-cules, Aqueous solvents which form two distinct phases provide favourable conditions for separation of proteins, cell fragments and organelles with protection of their biological activity. Two-phase aqueous systems are produced when
</div><span class="text_page_counter">Trang 19</span><div class="page_container" data-page="19">parti-Table 10.2 Examples of aqueous two-phase systems (From M.R. Kula, 1985, Liquid-liquid extraction of biopoly-‘mers, In: M. Moo-Young, Ed, Comprehensive Biotechnology, vol. 2, pp. 451-471, Pergamon Press, Oxford)
water above certain concentrations. The liquid partitions into two phases, each containing 85-99% water. Some compo-nents used to form aqueous two-phase systems are listed in Table 10.2. When added to these mixtures, biomolecules and cell fragments partition berween the phases; by selecting appropriate conditions, cell fragments can be confined to one phase as the protein of interest partitions into the other phase. Aqueous two-phase separations are of special interest for extraction of enzymes and recombinant proteins from cell debris produced by cell disruption. After partitioning, product is removed from the extracting phase using other unit opera-tions such as precipitation or crystallisation.
The extent of differential partitioning between phases depends on the equilibrium relationship for the system. The partition coefficient Kis defined as:
K= Câu
(10.24) where C,, is the equilibrium concentration of component A in the upper phase and Cis the equilibrium concentration of Ain the lower phase. If K> 1, component A favours the upper phase;
if K< 1, Ais concentrated in the lower phase. In many aqueous systems is constant over a wide range of concentrations pro-vided the molecular properties of the phases are not changed. Partitioning is influenced by the size, electric charge and hydro-phobicity of the particles or solute molecules; biospecific affinity for one of the polymers may also play a role in some systems. Surface free energy of the phase components and ionic composi-tion of the liquids are of paramount importance in determining separation; Kis related to both these parameters. Partitioning is also affected by other and sometimes interdependent factors so. that itis impossible to predict partition coefficients from molec-ular properties. For single-stage extraction of enzymes, partition coefficients > 3 are normally required [5].
Even when the partition coefficient is low, good product recovery ot yield can be achieved by using a large volume of the phase preferred by the solute. Yield of A in the upper phase,
Y,,, is defined as: where V, is volume of the upper phase, Ví is volume of the lower phase, Vy is the original volume of solution containing the product and Cag is the original product concentration in that liquid. In the lower phase, yield Y; is defined as: The maximum possible yield for an ideal extraction stage can be evaluated using Eqs (10.25) and (10.26) and the equilib-rium partition coefficient, K. Dividing both numerator and denominator of Eq. (10.25) by CA, and recognising that, at
equilibrium, CA/c,, is equal to Vy:
(10.27) Similarly, dividing the numerator and denominator of Eq.
(10.26) by Cy gives:
</div><span class="text_page_counter">Trang 20</span><div class="page_container" data-page="20">Example 10.3 Enzyme recovery using aqueous extraction
‘Aqueous two-phase extraction is used to recover a-amylase from solution. A polyethylene glycol-dextran mixture is added and the solution separates into two phases. The partition coefficient is 4.2. Calculate the maximum possible enzyme recovery when: (@) the volume ratio of upper to lower phases is 5.0; and
()_ thevolume ratio of upper to lower phases is 0.5. Solution:
{As the partition coefficient is greater than 1, enzyme prefers the upper phase. Yield at equilibrium is therefore calculated for the upper phase. Dividing both numerator and denominator of Eq, (10.27) by V, gives:
Increasing the relative volume of the extracting phase enhances recovery. Another parameter used to characterise two-phase partition-ing is the concentration factor or purification factor, ð,, defined as the ratio of product concentration in the preferred phase to the initial product concentration:
6, ie (when product partitions to the upper phase).
Aqueous extraction in polyethylene glycol-salt mixtures is an effective technique for separating proteins from cell debris. In this system, debris partitions to the lower phase while most of the target proteins are recovered from the upper phase. Extraction can be carried out in a single-stage operation such as that depicted in Figure 10.9 using a polymer mixture which provides a suitable partition coefficient. Equilibrium is approached in extraction operations but rarely reached; for industrial application it is important to consider the time taken for mass transfer and the ease of mechanical separation of the phases. The rate of approach to equilibrium depends on the surface area available for exchange between the phases; this
</div><span class="text_page_counter">Trang 21</span><div class="page_container" data-page="21">sometimes a problem because of the low interfacial tension between aqueous phases; very rapid large-scale extractions can be achieved by combining mixed vessels with centrifugal sep-arators. In many cases, recovery and concentration of product with yields exceeding 90% can be achieved using a single extraction step [5]. When single-stage extraction does not give sufficient recovery, repeated extractions can be carried out in a chain or cascade of contacting and separation units.
10.6 Adsorption
Adsorption is a surface phenomenon whereby components ofa gas or liquid are concentrated on the surface of solid particles or at fluid interfaces. Adsorption is the result of electrostatic, van der Waals, reactive or other binding forces between individual atoms, ions or molecules. Four types of adsorption can be dis-tinguished: exchange, physical, chemical and non-specific.
Adsorption serves the same function as extraction in isolat-ing products from dilute fermentation liquors, Several different adsorption operations are used in bioprocessing, particularly for medical and pharmaceutical products. lon-exchange adsorption is established practice for recovery of amino acids, proteins, antibiotics and vitamins. Adsorption onto activated charcoal is a method of long standing for purification of citric acid; adsorption of organic chemicals onto charcoal or porous polymeric adsorbents is common in wastewater treatment. ‘Adsorption operations generally have higher selectivity but smaller capacity than extraction. Scale-up procedures for adsorption are less well defined than for extraction; therefore, more experimental data are required for design. Handling of solids in industrial processing is also somewhat more difficult compared with the liquids used in extraction. However, despite these disadvantages, adsorption is gaining increasing applica-tion primarily because ofits suitability for protein isolation.
In adsorption operations, the substance being concentrated on the surface is called the adsorbate; the material to which the adsorbate binds is the adsorbent, The ideal adsorbent material has a high surface area per unit volume; this can be achieved if the solid contains a network of fine internal pores which pro-vide an extremely large internal surface area. Carbons and synthetic resins based on styrene, divinylbenzene or acryla-mide polymers are commonly used for adsorption of biological molecules. Commercially available adsorbents are porous granular or gel resins with void volumes of 30-50% and pore diameters generally less than 0.01 mm. As an ‘example, the total surface area in particles of activated carbon
ranges from 450 to 1800 m? g~!. Notall of this area is
neces-sarily available for adsorption; adsorbate molecules only have
Figure 10.10 Adsorption isotherms.
A typical adsorption operation consists of the following stages: a contacting or adsorption step which loads solute onto the adsorptive resin, a washing step to remove residual unadsorbed material, desorption or elution of adsorbate with a suitable sol-vent, washing to remove residual eluant, and regeneration of the adsorption resin to its original condition, Because adsor-bate is bound to the resin by physical or ionic forces, conditions used for desorption must overcome these forces. Desorption is normally accomplished by feeding a stream of different ionic strength or pH; elution with organic solvent or reaction of the sorbed material may be necessary in some appli-cations. Eluant containing stripped solute in concentrated form is processed to recover the adsorbate; operations for final purification include spray drying, precipitation and crystallisa-tion, After elucrystallisa-tion, the adsorbent undergoes a regenerative treatment to remove any impurities and regain its original adsorptive capacity. Despite regeneration, performance of the
</div><span class="text_page_counter">Trang 22</span><div class="page_container" data-page="22">material is impossible. Accordingly, after a few regenerations the adsorbate is replaced.
10.6.2 Equilibrium Relationships For Adsorption
Like extraction, analysis of adsorption depends somewhat on equilibrium relationships which determine the extent to which material can be adsorbed onto a particular surface. ‘When an adsorbate and adsorbent are at equilibrium there is a defined distribution of solute between solid and fluid phases and no further net adsorption occurs. Adsorption equilib-rium data are available as adsorption isotherms. For adsorbate A, an isotherm gives the concentration of A in the adsorbed phase versus the concentration in the unadsorbed phase at a given temperature. Adsorption isotherms are useful for selecting the most appropriate adsorbent; they also play a crucial role in pre-dicting the performance of adsorption systems.
Several types of equilibrium isotherm have been developed to describe adsorption relationships. However, no single model is universally applicable; all involve assumptions which may or may not be valid in particular cases. One of the sim-plest adsorption isotherms that accurately describes certain practical systems is the Langmuir isotherm shown in Figure 10.10(a). The Langmuir isotherm can be expressed as follows:
= CAsm ÃA Ca
(10.30) In Eq, (10.30), C1 is the equilibrium concentration or loading
of Aon the adsorbent in units of, e.g. kg solute kgTM solid or kg solute m~ solid. Cas„„ is the maximum loading of adsorbate
corresponding to complete monolayer coverage of all available adsorption sites, C is the equilibrium concentration of solute
in the fluid phase in units of, e.g. kg m73, and K,, is a constant.
Because of the different units used for fluid- and solid-phase
concentrations, 2 usually has units such as m? kg—' solid.
Theoretically, Langmuir adsorption is applicable to systems where: (i) adsorbed molecules form no more than a monolayer on the surface; (i) each site for adsorption is equiv-alent in terms of adsorption energy; and (iii) there are no interactions between adjacent adsorbed molecules. In many experimental systems at least one of these conditions is not met. For example, many commercial adsorbents possess high-ly irregular surfaces so that adsorption is favoured at particular points or ‘strong sites’ on the surface. Accordingly, each site is not equivalent. In addition, interactions between adsorbed molecules exist for almost all real adsorption systems. Recognition of these and other factors has led to application of other adsorption isotherms.
OF particular interest because of its widespread use in liquid-solid systems is the Freundlich isotherm, described by the relationship:
Cas = Kp C1,
Kg and nare constants characteristic of the particular adsorp-tion system; the dimensions of Ky depend on the dimensions of Cys and C% and the value of x. [fadsorption is favourable » is > 1; if adsorption is unfavourable 7 is < 1. The form of the Freundlich isotherm is shown in Figure 10.10(b). Eq. (10.31) applies to adsorption of a wide variety of antibiotics, hormones and steroids.
‘There are many other forms of adsorption isotherm giving different CA; — C% curves [12]. Because the exact mech-anisms of adsorption are not well understood, adsorption equilibrium data must be determined experimentally.
Example 10.4 Antibody recovery by adsorption
Cell-free fermentation liquor contains 8 x 10~> mol I~! immunoglobulin G. It is proposed to recover at least 90% of this anti-body by adsorption on synthetic, non-polar resin. Experimental equilibrium data are correlated as follows:
Chg = 5.5x 1075 C4935
where CNs is mol solute adsorbed per cm? adsorbent and C1 is liquid-phase solute concentration in mol [~!. What minimum quantity of resin is required to treat 2 m? fermentation liquor in a single-stage mixed tank?
‘The quantity of resin required is minimum when eq rium occurs. If 90% of the antibiotic is adsorbed, the residual
</div><span class="text_page_counter">Trang 23</span><div class="page_container" data-page="23">The minimum quantity of resin required is 1.6 10° cm, or 0.16 mổ,
Figure 10.11 Movement of the adsorption zone and development of the breakthrough curve fora fixed-bed adsorber.
</div><span class="text_page_counter">Trang 24</span><div class="page_container" data-page="24">Figure 10.12 Relationship between the breakthrough curve, loss of solute in the effluent, and unused column
Various types of equipment have been developed for adsorp-tion operaadsorp-tions, including fixed beds, moving beds, fluidised beds and stirred-tank contactors. Of these, fixed-bed adsorbers are most commonly applied; the adsorption area available per unit volume is greater in fixed beds than in most other configu-rations. A fxed-bed adsorber is a vertical column or tube packed with adsorbent particles. Commercial adsorption oper-ations are mostly performed as unsteady-state processes; liquid containing solute is passed through the bed and the loading or amount of product retained in the column increases with time. Operation of a downflow fixed-bed adsorber is illustrated in Figure 10.11. Liquid solution containing adsorbate at
con-free of adsorbate. At first, adsorbent resin at the top of the col-umn takes up solute rapidly; solution passing through the column becomes depleted of solute and leaves the system with effluent concentration close to zero. As flow of solution con-tỉnues, the region of the bed where most adsorption occurs, the adsorption zone, moves down the column as the top resin becomes saturated with solute in equilibrium with liquid con-centration Cy, Movement of the adsorption zone usually occurs ata speed much lower than the velocity of fluid through the bed, and is called the adsorption wave. Eventually the lower edge of the adsorption zone reaches the bottom of the bed, the resin is almost completely saturated, and the concentration of solute in the effluent starts to rise appreciably; this is called the breakpoint. As the adsorption zone passes through the bottom of the bed, the resin can no longer adsorb solute and the efflu-ent concefflu-entration rises to the inlet value, C,,. At this time the bed is completely saturated with adsorbate and must be regenerated. The curve in Figure 10.11 showing effluent concentration as a function of time or volume of material pro-cessed is known as the breakthrough curve.
The shape of the breakthrough curve greatly influences design and operation of fixed-bed adsorbers. Figure 10.12 shows the portion of the breakthrough curve between times & and % when solute appears in the column effluent. The amount of solute lost in the effluent is given by the area under the breakthrough curve. As indicated in Figure 10.12(a), if adsorption continues until the entire bed is saturated and the effluent concentration equals C,,, a considerable amount of solute is wasted. To avoid this, adsorption operations are usu-ally stopped before the bed is completely saturated. As shown in Figure 10.12(b), if adsorption is halted at time t’ when the effluent concentration is CA, only a small amount of solute is wasted compared with the process of Figure 10.12(a). The dis-advantage is that some portion of the bed capacity is unused, as represented by the shaded area above the breakthrough curve. Because of the importance of the breakthrough curve in deter-mining schedules of operation, much effort has been given to its prediction and to analysis of factors affecting it. This is dis-cussed further in the next section.
10.6.4 Engineering Analysis of Fixed-Bed Adsorbers
In design of fixed-bed adsorbers, the quantity of resin and the time required for adsorption of a given quantity of solute must be estimated. Design procedures involve predicting the shape of the breakthrough curve and the time of appearance of the break-poine. The form of the breakthrough curve is influenced by factors such as feed rate, concentration of solute in the feed,
</div><span class="text_page_counter">Trang 25</span><div class="page_container" data-page="25">Figure 10.13 Fixed-bed adsorber for mass-balance analysis.
Performance of commercial adsorbers is usually controlled by adsorption rate, This in turn depends on mass-transfer processes within and outside the adsorbent particles. One approach to adsorber design is to conduct extensive pilot studies to examine
the bed. The total length of the bed is Z. At distance z from the top is a section of column around which we can perform an tunsteady-state mass balance. We will assume that this section is very thin so that z is approximately the same anywhere in the section, The system boundary is indicated in Figure 10.13 by dashed lines; four streams representing flow of material are shown to cross the boundary. The general mass-balance equa-tion given in Chapter 4 can be applied to solute A:
<small>through |__| through |, | generated| | consumed _ | accumulated</small>
system system within within [=] within boundaries) | boundaries} (system system system
Let us consider each term of Eq. (4.1) to see how it applies to solute A in the designated section of the column. First, because we assume there are no chemical reactions taking place and A can be neither generated nor consumed, the third and fourth terms of Eq, (4.1) are zero. On the left-hand side, this leaves only the input and output terms. What are the mechanisms for input of component A to the section of column? A is brought into the section largely as a result of liquid flow down the col-umn; this is indicated in Figure 10.13 by the solid arrow entering the section. Other mechanisms are related to local mixing and diffusion processes within the interstices or gaps between the resin particles. For example, some A may enter the section from the region just below it by countercurrent diffu-sion against the direction of flow; this is indicated in Figure 10.13 by the wiggly arrow entering the section from below. Let the effects of major system variables. However, the d and
cost of these experimental studies can be minimised by prior mathematical analysis of the process. Because fixed-bed adsorp-tion is an unsteady-state process and equaadsorp-tions for adsorpadsorp-tion isotherms are generally non-linear, the calculations involved in engineering analysis are relatively complex compared with many other unit operations, Non-homogeneous packing in adsorption beds and the difficulty of obtaining reproducible
us now consider movement of A out of the system. The mecha-nisms for removal of A are the same as for entry: Ais carried out of the section by liquid fow and by axial transfer along the length of the tube against the direction of flow. These processes are also indicated in Figure 10.13. The remaining term in Eq. (4.1) is accumulation of A. A will accumulate within the section due to adsorprion onto the interior and exterior surfaces of the adsorbent particles. A may also accumulate in liquid trapped results in apparently identical beds add to these problems. It is
beyond the scope of this book to consider design procedures in any depth as considerable effort and research is required to establish predictive models for adsorption systems. However, a simplified engineering analysis is presented below.
Let us consider the processes which cause changes in the liq-uid-phase concentration of adsorbate in a fixed-bed adsorber. ‘The aim of this analysis isto derive an equation for effluent con-centration as a function of time (the breakthrough curve). The technique used is the mass balance. Consider the column packed with adsorbent resin shown in Figure 10.13. Liquid
con-within the interstitial spaces or gaps b resin particles. When appropriate mathematical expressions for rates of flow, axial dispersion and accumulation are substituted into Eq. (4.1), the following equation is obtained:
</div><span class="text_page_counter">Trang 26</span><div class="page_container" data-page="26">In Eq. (10.32), Cy is the concentration of A in the liquid, zis bed depth, tis time and Cys is the average concentration of A in the solid phase. “2. is the effective axial dispersion coefficient for A in the column. In most packed beds ,, is substantially greater than the molecular diffusion coefficient; the value of Jy, incorporates the effects of axial mixing in the column as the solid particles interrupt smooth liquid flow. £ is the void fraction in the bed, defined as:
where V+ is the total volume of the column and V, is the vol-ume of the resin particles. ø is the interstitial liquid velocity, defined as:
where F, is the volumetric liquid flow rate and 4, is the cross-sectional area of the column. In Eq. (10.32), 3/;, denotes the partial differential with respect to time, #/,, denotes the partial differential with respect to distance, and 21/, ; denotes the second partial differential with respect to distance. Although Eq, (10.32) looks complicated, it is useful to recognise the physical meaning of its components. As indicated below each term of the equation, rates of axial dispersion, flow, and accu-mulation in the liquid and solid phases are represented; accumulation is equal to the sum of the net rates of axial diffu-sion and flow into the system.
There are four variables in Eq. (10.32): concentration of Ain the liquid, Cạ; concentration of A in the solid, Cac} dis-tance from the top of the column, z; and time, #. The other parameters can be considered constant. Cy and Cys vary with time of operation and depth in the column. Theoretically, with the aid of further information about the system, Eq. (10.32) can be solved to provide an equation for the effluent concentration as a function of time: the break-through curve. However, solution of Eq. (10.32) is generally very difficult. To assist the analysis, simplifying assumptions are often made. For example, it is normally assumed that dilute solutions are being processed; this results in nearly iso-thermal operation and eliminates the need for an accompanying energy balance for the system. In many cases the axial-diffusion term can be neglected; axial dispersion is
fluid content of the bed is small compared with the total vol-ume of feed, accumulation of A between the particles can also be neglected. With these simplifications, the first and third terms of Eq. (10.32) are eliminated and the design equation is reduced to:
aC, _ (l-e
E5 - ( =)
To progress further with this analysis, information about
*€asƒ „ is required. This term represents the rate of change of
solid-phase adsorbate concentration and depends on the over-all rate at which adsorption takes place. Overover-all rate of adsorption depends on two factors: the rate at which solute is transferred from liquid to solid by mass-transfer mechanisms, and the rate of the actual adsorption or attachment process. ‘The mass-transfer pathway for adsorbate is analogous to that described in Section 9.5.2 for oxygen transfer. There are up to five steps which can pose significant resistance to adsorption as indicated in Figure 10.14. They are:
(i) transfer from the bulk liquid to the liquid boundary layer surrounding the particle;
diffusion through the relatively stagnant liquid film sur-rounding the particle;
transfer through the liquid in the pores of the particle to internal surfaces;
(iv) the actual adsorption process; and
(¥) surface diffusion along the internal pore surfaces; i.e. migration of adsorbate molecules within the surface without prior desorption.
Normally only a small amount of adsorption occurs on the outer perimeter of the particle compared to within the pores; accordingly, external adsorption is not shown in Figure 10.14. Bulk transfer of solute is usually rapid because of mix-ing and convective flow of liquid passmix-ing over the solid; the effect of step (i) on overall adsorption rate can therefore be neglected. The adsorption step itself is sometimes very slow and can become the rate-limiting process; however in most cases adsorption occurs relatively quickly so that step (iv) is not rate-controlling. Step (ii) represents the major external resistance to mass transfer, while steps (iii) and (v) represent the major internal resistances. Any or all of these steps can control the overall rate of adsorption depending on the situa-tion, Rate-controlling steps are usually identified experimentally using a small column with packing identical to the industrial-scale system; mass-transfer coefficients can
</div><span class="text_page_counter">Trang 27</span><div class="page_container" data-page="27">Figure 10.14 Steps involved in adsorption of solute from liquid to porous adsorbent particle.
Unfortunately however, itis possible that the rate-controlling step changes as the process is scaled up, making rational design difficult.
Greatest simplification of Eq. (10.35) is obtained when the overall rate of mass transfer from liquid to internal surfaces is represented by a single equation. For example, by analogy with Eq. (9.34) or (9.35), we can write:
as _ Ka
3 Ole
<sup>(Q- CẠ)</sup>(10.36) where K, is the overall mass-transfer coefficient, a is the sur-face area of the solid per unit volume, C, is the liquid-phase concentration of A, and C1 is the liquid-phase concentration of A in equilibrium with Cac. The value of K, will depend on the properties of the liquid and the flow conditions; C4 can be related to Cas by the equilibrium isotherm. In the end, after the differential equations are simplified as much as possible and then integrated with appropriate boundary conditions (usually with a computer), the result is a relationship between
effluent concentration (Cy at 2 = Z) and time. The height of the column required to achieve a certain recovery of solute can also be evaluated.
As mentioned already in this section, there are many uncer-tainties associated with design and scale up of adsorption systems. The approach described here will give only an approximate indication of design and operating parameters. Other methods involving various simplifying assumptions can be employed [2]. The above analysis highlights the important role played by mass transfer in practical adsorption operations. Equilibrium is seldom achieved in commercial adsorption systems; performance is controlled by the overall rate of adsorption. Most parameters determining the economics of adsorption are those affecting mass transfer. Improvement in adsorber operation can be achieved by enhancing rates of diffusion and reducing mass-transfer resistance.
10.7 Chromatography
Chromatography is a separation procedure for resolving
</div><span class="text_page_counter">Trang 28</span><div class="page_container" data-page="28">mix-described in the previous section on adsorption apply also co chromatography. The basis of chromatography is differential migration, Le. the selective retardation of solute molecules dur-ing passage through a bed of resin particles. A schematic description of chromatography is given in Figure 10.15; this diagram shows separation of three solutes from a mixture injected into a column. As solvent flows through the column, the solutes travel at different speeds depending on their rela-tive affinities for the resin particles. As a result, they will be separated and appear for collection at the end of the column at different times. The pattern of solute peaks emerging from a chromatography column is called a chromatogram. The fluid carrying solutes through the column or used for elution is known as the mobile phase; the material which stays inside the column and effects the separation is called the stationary phase. In gas chromatography (GC), the mobile phase is a gas. Gas chromatography is used widely as an analytical tool for separ-ating relatively volacile components such as alcohols, ketones, aldehydes and many other organic and inorganic compounds. However, of greater relevance to bioprocessing is liquid chromatography, which can take a variety of forms. Liquid chromatography finds application both as a laboratory method for sample analysis and as a preparative technique for large-scale purification of biomolecules, In recent years there have been rapid developments in the technology of liquid chromatography aimed at isolation of recombinant products from genetically engineered organisms. Chromatography is a high-resolution technique and therefore suitable for recovery of high-purity therapeutics and pharmaceuticals. Chroma-tographic methods available for purification of proteins, peptides, amino acids, nucleic acids, alkaloids, vitamins, ster-oids and many other biological materials include adsorption
hn iphy, partition by, ion:
chrom-hy gel pchrom-hy and affinity c
‘These methods differ in đề principal miechaniein by which molecules are retarded in the chromatography column. (i) Adsorption chromatography. Biological molecules have
varying tendencies to adsorb onto polar adsorbents such as silica gel, alumina, diatomaceous earth and charcoal. Performance of the adsorbent relies strongly on the chemical composition of the surface, i.e, the types and concentrations of exposed atoms or groups. The order of elution of sample components depends primarily on molecule polarity. Because the mobile phase is in com-petition with solute for adsorption sites, solvent proper-ties are also important. Polarity scales for solvents are available to aid mobile-phas selection [13]. (i) Pa hy. Partition chroi hy relies
Figure 10.15 Chromatographic separation of components in a mixture, Three different solutes are shown schematically as circles, squares and triangles. (From P.A. Belter, E.L. Cussler and W.-S. Hu, 1988, Bioseparations: Downstream Processing For Biotechnology, John Wiley, New York.)
cible solvents. This is achieved by fixing one solvent (the stationary phase) to a support and passing the other solvent containing solute over it. The solvents make intimate con-tact allowing multiple extractions of solute to occur. Several methods are available to chemically bond the stationary sol-vent to supports such as silica [14]. When the stationary phase is more polar than the mobile phase, the technique is called normal-phase chromatography. When non-polar compounds are being separated it is usual to use stationary phase which is less polar than the mobile phase; this is called reverse-phase chromatography. A. common stationary phase for reverse-phase chromatography is hydrocarbon with 8 or 18 carbons bonded to silica gel; these materials are called Ce and Cy, packings, respectively. Solvent systems most frequently used are acetonitrile and water-methanol; aqueous buffers are also employed to suppress ionisation of sample components. Elution is generally in
</div><span class="text_page_counter">Trang 29</span><div class="page_container" data-page="29">(iii) Ion-exchange chromatography. The basis of separation in this procedure is electrostatic attraction between the solute and dense clusters of charged groups on the col-umn packing. Ion-exchange chromatography can give high resolution of macromolecules and is used commer-cially for fractionation of antibiotics and proteins. Column packings for low-molecular-weight compounds include silica, glass and polystyrene; carboxymethyl and diethylaminoethyl groups attached to cellulose, agarose or dextran provide suitable resins for protein chromatog-raphy. Solutes are eluted by changing the pH or ionic strength of the liquid phase; salt gradients are the most common way of eluting proteins from ion exchangers. Practical aspects of protein ion-exchange chromatog-taphy are described in greater detail elsewhere [15]. Gel chromatography. This technique is also known as molecular-sieve chromatography, exclusion chromatog: raphy, gel filtration and gel-permeation chromatography. Molecules in solution are separated in a column packed with gel particles of defined porosity. Gels most often used are cross-linked dextrans, agaroses and polyacryl-amide gels. The speed with which components travel through the column depends on their effective molecular size. Large molecules are completely excluded from the gel matrix and move rapidly through the column to appear first in the chromatogram. Small molecules are able to penetrate the pores of the packing, traverse the column very slowly, and appear last in the chromato-gram. Molecules of intermediate size enter the pores but spend less time there than the small solutes. Gel filtration can be used for separation of proteins and lipophilic com-pounds. Large-scale gel-filtration columns are operated with upward-flow elution.
Affinity chromatography. This separation technique exploits the binding specificity of biomolecules. Enzymes, hormones, receptors, antibodies, antigens, binding proteins, lectins, nucleic acids, vitamins, whole cells and other components capable of specific and revers-ible binding are amenable to highly selective affinity purification. Column packing is prepared by linking a binding molecule called a /igand to an insoluble support; when sample is passed through the column, only solutes with appreciable affinity for the ligand are retained. The ligand must be attached to the support in such a way that its binding properties are not seriously affected; mole-cules called spacer arms are often used to set the ligand away from the support and make it more accessible to the solute. Many ready-made support-ligand preparations (iv)
range of proteins. Conditions for elution depend on the specific binding complex formed: elution usually involves a change in pH, ionic strength or buffer compo-sition. Enzyme proteins can be desorbed using a compound with higher affinity for the enzyme than the ligand, e.g. a substrate or substrate analogue. Affin-ity chromatography using antibody ligands is called immuno-affinity chromatography.
In this section we will consider principles of liquid chroma-tography for separation of biological molecules such as proteins and amino acids. Choice of stationary phase will depend to a large extent on the type of chromatography employed; however certain basic requirements must be met. For high capacity, the solid support must be porous with high internal surface area; it must also be insoluble and chemically stable during operation and cleaning, Ideally, the particles should exhibit high mechan-ical strength and show little or no non-specific binding. The low rigidity of many porous gels was initially a problem in industrial-scale chromatography; the weight of the packing material in large columns and the pressures developed during flow tended to compress the packing and impede operation. However, many macroporous gels and composite materials of high rigidity are now available for industrial use.
Two methods for carrying out chromatographic separa-tions are high-performance liquid chromatography (HPLC) and fast protein liquid chromatography (FPLC). In principle, any of the types of chromatography described above can be executed using HPLC and FPLC techniques. Specialised equipment for HPLC and FPLC allows automated injection of sample, rapid flow of material through the column, col-lection of the separated fractions, and data analysis. Chromatographic separations traditionally performed under atmospheric pressure in vertical columns with manual sample feed and gravity elution are carried out faster and with better resolution using densely-packed columns and high flow rates in HPLC and FPLC systems. The differences between HPLC and FPLC lie in the flow races and pressures used, the size of the packing material, and the resolution accomplished. In gen-eral, HPLC instruments are designed for small-scale, high-resolution analytical applications; FPLC is tailored for large-scale purification. In order to achieve the high resolu-tions characteristic of HPLC, stationary-phase particles 2-5 pm in diameter are commonly used. Because the particles are so small, HPLC systems are operated under high pressure
(5-10 MPa) to achieve flow rates of 1-5 ml min~!, FPLC
instruments are not able to develop such high pressures
(1-2 MPa), and are therefore operated with column packings
</div><span class="text_page_counter">Trang 30</span><div class="page_container" data-page="30">Figure 10.16 Differential migration of two solutes A and B.
HPLC; accordingly, it is common practice to collect only the central peak of the solute pulse emerging from the end of the column and to recycle or discard the leading and trailing edges. FPLC equipment is particularly suited to protein separ-ations; many gels used for gel chromatography and affinity h hy are ible and cannot withstand the high pressures exerted in HPLC.
‘Chromatography is essentially a batch operation; however industrial chromatography systems can be monitored and con-trolled for easy automation. Cleaning the column in place is generally difficult. Depending on the nature of the impurities contained in the samples, rather harsh treatments with concen-trated salt or dilute alkali solutions are required; these may affect swelling of the gel beads and, therefore, liquid flow in the col-umn, Regeneration in place is necessary as re-packing of large columns can be laborious and time-consuming, Repeated use of chromatographic columns is essential because of their high cost.
10.7.1 Differential Migration
Differential migration provides the basis for chromatographic separation and is explained diagrammatically in Figure 10.15.
equilibrium affinities for a particular stationary phase. For the sake of brevity, let us say that the solutes are adsorbed onto the stationary phase although they may be adsorbed, bound or entrapped depending on the type of chromatography employed. Assume that A is adsorbed more strongly than B. If a small quantity of solution is passed through the column so that only a limited depth of packing is saturated, both solutes will be retained in the bed as shown in Figure 10.16(a).
A suitable eluant is now passed through the bed. As shown in Figures 10.16(b-c), both solutes will be alternately adsorbed and desorbed at lower positions in the column as flow of eluant continues. Because solute B is more easily desorbed than A, it moves forward more rapidly. Differences in migration velocities of solutes are related to differences in equilibrium distributions between stationary and mobile phases. In Figure 10.16(e), solute B has been separated from A and washed out of the system.
Several parameters are used to characterise differential migration. An important variable is the volume V, of eluting solvent required to carry the solute through the column until it emerges at its maximum concentration. Each component sep-arated by chromatography has a different elution volume. Another parameter commonly used to characterise elution is
</div><span class="text_page_counter">Trang 31</span><div class="page_container" data-page="31">pe Œcc VỆ
(10.37) where V, is the void volume, i.e. the volume of liquid in the column outside of the particles. For two solutes, the ratio of their capacity factors k, and &, is called the selectivity or relative retention, 8:
Eqs (10.37) and (10.38) are normally applied to adsorption, partition, ion-exchange and affinity chromatography. In gel chromatography where separation is a function of effective molecular size, the elution volume is easily related to certain physical properties of the gel column. The total volume ofa gel column is:
(10.39) where Vị is total volume, V, is void volume outside the par-ticles, V; is internal volume of liquid in the pores of the parti-cles, and V, is volume of the gel itself. The outer volume V, can be determined by measuring the elution volume of a sub-stance that is completely excluded from the stationary phase; a solute which does not penetrate the gel can be washed from the column using a volume of liquid equal to V,. V, is usually about one-third Vp. Solutes which are only partly excluded from the stationary phase elute with a volume described by the following equation:
(10.40) where K, is the gel partition coeficient, defined as the fraction of internal volume available to the solute. For large molecules which do not penetrate the solid, K, = 0. From Eq, (10.40):
obtained with different gel-chromatography columns; it is independent of column size and packing density. However experimental determination of K,, depends on knowledge of V,, which is difficult to measure accurately. V, is usually calcu-lated using the equation:
(10.42) where a is mass of dry gel and W, is the water regain value, defined as the volume of water taken up per mass of dry gel. The value for W, is generally specified by the gel manu-facturer. If, as is often the case, the gel is supplied already wet and swollen, the value of a is unknown and V, is determined using the following equation:
MPs (yy)
<small>1” Twp) tr s</small>
where pg is the density of wet gel and p,, is the density of water.
Example 10.5 Hormone separation using gel chromatography
A pilot-scale gel-chromatography column packed with Sephacryl resin is used to separate two hormones A and B. The column is
5em in diameter and 0.3m high; the void volume is 1.9 x 1074 m3, The water regain value of the gel is 3 x 1073 m3 kg! dry Sephacryl; the density of wet gel is 1.25 x 10² kg m~3. The partition coefficient for hormone A is 0.38; the partition coefficient for hormone B is 0.15. If the eluant flow rate is 0.7 1 h~!, what is the retention time for each hormone?
</div><span class="text_page_counter">Trang 32</span><div class="page_container" data-page="32">The effectiveness of chromatography depends not only on differential migration but on whether the elution bands for individual solutes remain compact and without overlap. Ideally, each solute should pass out of the column at a different instant in time. In practice, elution bands spread out some-what so that each solute takes a finite period of time to pass across the end of the column. Zone spreading is not sơ import-ane when migration rates vary widely because there is little chance that solute peaks will overlap. However if the mole-cules to be separated have similar structure, migration rates will also be similar and zone spreading must be carefully con-trolled.
As illustrated in Figure 10.15, typical chromatogram elu-tion bands have a peak of high concentraelu-tion at or about the centre of the pulse but are of finite width as the concentration trails off to zero before and after the peak. Spreading of the solute peak is caused by several factors represented schemati-cally in Figure 10.17.
(i) Axial diffusion, As solut is cartied through the column,
molecular diffusion of solute will occur from regions of high concentration to regions of low concentration, Diffusion in the axial direction, i.e. along the length of the tube, is indicated in Figure 10.17(a) by broken arrows, Axial diffusion broadens the solute peak by trans-porting material upstream and downstream away from the region of greatest concentration.
Eddy diffusion, In columns packed with solid particles, actual flow paths of liquid through the bed can be highly Gi)
variable. As indicated in Figure 10.17), some liquid will flow almost directly through the bed while other liquid will take longer and more tortuous paths through the gaps or interstices between the particles. Accordingly, some solute molecules carried in the fluid will move slow-er than the avslow-erage rate of progress through the column while others will take shorter paths and move ahead of the average; the result is spreading of the solute band. Differential motion of material due to erratic local varia-tions in flow velocity is known as eddy diffusion. Local non-equilibrium effects. In most columns, lack of equilibrium is the most important factor affecting zone spreading, although perhaps the most difficult to under-stand. Consider the situation at position X indicated in Figure 10.17(a). A solute pulse is passing through the col-umn; as shown in Figure 10.17(b) concentration within this pulse increases from the front edge to a maximum near the centre and then decreases to zero. As the solute pulse moves down the column, an initial gradual increase in solute concentration will be experienced at X. In response to this increase in mobile-phase solute concen-tration, solute will bind to the stationary phase and the stationary-phase concentration will start to increase towards an appropriate equilibrium value. Equilibrium is not established immediately however; it takes time for the solute to undergo the mass-transfer steps from liquid to solid as outlined in Section 10.6.4. Indeed, before equilibrium can be established, the mobile-phase concen-tration increases again as the centre of the solute pulse moves closer to X. Because concentration in the mobile
</div><span class="text_page_counter">Trang 33</span><div class="page_container" data-page="33">Figure 10.17 Zone spreading in a chromatography column. phase is continuously increasing, equilibrium at X
remains always out of reach and the stationary-phase concentration lags behind equilibrium values. As a consequence, a higher concentration of solute remains in the liquid than if equilibrium were established, and the front edge of the solute pulse effectively moves ahead fast-et than the remainder of the pulse. As the peak of the solute pulse passes X, the mobile-phase concentration starts to decrease with time. In response, the solid phase must divest itself of solute to reach equilibrium with the lower liquid-phase concentrations. Again, because of delays due to mass transfer, equilibrium cannot be established with the continuously changing liquid concentration. As the solute pulse passes and the liqui concentration at X falls to zero, the solid phase still con-tains solute molecules that continue to be released into the liquid. Consequently, the rear of the solute pulse is effectively stretched out until the stationary phase reaches equilibrium with the liquid.
In general, conditions which improve mass transfer will increase the rate at which equilibrium is achieved between the
the particle surface area per unit volume facilitates mass trans-fer and reduces non-equilibrium effects; surface area is usually increased by using smaller particles. On the other hand, increasing the liquid flow rare will exacerbate non-equilibrium effects as the rate of adsorption fails to keep up with con-centration changes in the mobile phase. Viscous solutions give rise to considerable zone broadening as a result of slower mass-transfer rates; zone broadening is also more pronounced if the solute molecules are large. Changes in temperature can affect zone broadening in several ways. Because viscosity is reduced at elevated temperatures, heating the column often decreases zone spreading. However, rates of axial diffusion increase at higher temperatures so that the overall effect depends on the system and temperature range tested.
10.7.3 Theoretical Plates in Chromatography
The concept of theoretical plates is often used to analyse zone broadening in chromatography. The idea is essentially the same as that described in Section 10.4 for an ideal equilibrium stage. The chromatography column is considered to be made up of a number of segments or plates of height Z# the magnitude of H
</div><span class="text_page_counter">Trang 34</span><div class="page_container" data-page="34">Figure 10.18 Parameters for calculation of: (a) number of A ButC
theoretical plates, and (b) resolution. 5 eet
is of the same order as the diameter of the resin particles. ‘Within each segment equilibrium is supposed to exist.
As in adsorption operations, equilibrium is not often achieved in chromatography so that the theoretical-plate con-cept does not accurately reflect conditions in the column. Nevertheless the idea of theoretical plates is applied extensive-ly, mainly because it provides a parameter, the plate height H, which can be used to characterise zone spreading. Use of the plate height, which is also known as the height equivalent to a theoretical plate (HETP), is acceptable practice in chromatog-raphy design even though it is based on a poor model of column operation. HETP is a measure of zone broadening; in general, the lower the HETP value the narrower is the solute peak.
HETP depends on various processes which occur during elution of a chromatography sample. A popular and simple
where His plate height, wis linear liquid velocity, and 4, Band Care experimentally-determined kinetic constants. A, Band C include the effects of liquid-solid mass transfer, forward and backward axial dispersion, and non-ideal distribution of liquid around the packing. As outlined in Section 10.6.4, overall rates of solute adsorption and desorption in chromatography depend mainly on mass-transfer steps. Values of A, B and C are reduced by improving mass transfer between liquid and solid phases, resulting in a decrease in HETP and better col-umn performance. Eq. (10.44) and other HETP models are discussed further in other references [16, 17).
HETP for a particular component is related to the elution volume and width of the solute peak as it appears on the chromatogram. If, as shown in Figure 10.18(a), the pulse has the standard symmetrical form of a normal distribution around a mean value #, the number of theoretical plates can be calculated as follows:
where Nis number of theoretical plates, V, is the distance on the chromatogram corresponding to the elution volume of the solute, and w is the base line width of the peak between lines drawn tangent to the inflection points of the curve. Eq.
(10.45) applies if the sample is introduced into the column as a
narrow pulse. Number of theoretical plates is related to HETP as follows:
<small>N=</small>
als
where Lis the length of the column. For a given column, the greater the number of theoretical plates the greater is the num-ber of ideal equilibrium stages in the system and the more efficient is the separation. Values of Hand N vary for a parti-cular column depending on the component being separated.
10.7.4 Resolution
Resolution is a measure of zone overlap in chromatography and an indicator of column efficiency. For separation of two
</div><span class="text_page_counter">Trang 35</span><div class="page_container" data-page="35">= 2Wø~ Va)
(10.47) where Ry is resolution, V,, and V5 are distances on the chromatogram corresponding to elution volumes for compo-nents 1 and 2, and w, and w, the baseline widths of the chromatogram peaks as shown in Figure 10.18(b). Column resolution is a dimensionless quantity; the greater the value of Ry the more separated are the two solute peaks. An Ry value of 1.5 corresponds to a baseline resolution of 99.8% or virtual complete separation; when Ryy= 1.0 the two peaks overlap by about 2% of the total peak area.
Column resolution can be expressed in terms of HETP. Assuming w, and w, are approximately equal, Eq. (10.47)
can be expressed in terms of È; and 6 from Eqs (10.37) and (10.38), so that Eq. (10.49) becomes:
eek ow (221) (4
ae 3) eat)
Using the expression for N from Eq, (10.46), the equation for colungn resolution is:
6-1\( k B k+l)”
As is apparent from Eq. (10.51), peak resolution increases as a
function of VL , where L is the column length. Resolution also (10.50)
increases with decreasing HETP; therefore, any enhancement of mass-transfer conditions reducing H will improve resolu-tion, Derivation of Eq. (10.51) involves Eq, (10.45), which applies to chromatography systems where a relatively small quantity of sample is injected rapidly. Resolution is sensitive to increases in sample size; as the amount of sample increases, res-olution declines. In laboratory analytical work it is common to. use extremely small sample volumes, of the order of micro-litres. However, depending on the type of chromatography used for production-scale purification, sample volumes 5-20% of the column volume and higher are used. Because resolution under these conditions is relatively poor, if the solute peak is collected for isolation of product the central portion of the peak is retained while the leading and trailing edges are recycled back to the feed.
10.7.5. Scaling-Up Chromatography
“The aim in scale-up of chromatography is to retain the resolu-tion and solute recovery achieved using a small-scale column while increasing the throughput of material. Strategies for scale up must take into account the dominance of mass-transfer effects in chromatography separations.
“The easiest approach to scale-up is to simply increase the flow rate through the column. This gives unsatisfactory results; raising the liquid velocity increases zone spreading and produces high pressures in the column which compress the stationary phase and cause pumping difficulties. The pressure-drop problem can be alleviated by increasing the particle size; however this hinders the overall mass-transfer process and so decreases resolution. Increasing the column length can help regain any resolution lost by increasing the flow rate or particle diameter; however increasing L also has a strong effect in rais-ing the pressure drop through the column.
“The solution to scale-up is to keep the same column length, linear flow velocity and particle size as in the small column, but increase the column diameter. The larget capacity of the col-umn is therefore due solely to its greater cross-sectional area. Sample volume and volumetric flow rate are increased in pro-portion to column volume. In this way, all the important parameters affecting the packing matrix, liquid flow, mass transfer and equilibrium conditions are kept constant; similar column performance can therefore be expected, Because liquid distribution in large-diameter packed columns tends to be poor, care must be taken to ensure liquid is fed evenly over the entire column cross-section.
In practice, variations in column properties and efficiency do occur with scale-up. As an example, compressible solids such as those used in gel chromatography get better support from the
</div><span class="text_page_counter">Trang 36</span><div class="page_container" data-page="36">column wall in small columns than in large columns; as a result, lower linear flow rates must be used in large-scale systems. An advantage of using gels of high mechanical strength in laborato-ry systems is that they allow more direct scale-up to commercial operation, The elasticity and compressibility of gels used for fractionation of high-molecular-weight proteins preclude use of long columns in large-scale processes; bed heights in these systems are normally restricted to 0.6-1.0 m.
10.8 Summary of Chapter 10
Ac the end of Chapter 10 you should: (i) know what isa unit operation;
(i) beable to describe generally the steps of downstream pro-cessing;
understand the theory and practice of fileration; understand the principles of centrifugation, including scale-up considerations;
(¥) be familiar with methods used for cell disruption;
(vi) understand the concept of an ideal stage;
(vii) be able to analyse aqueous two-phase extractions in terms of the equilibrium partition coefficient, product yield and concentration factor;
(viii) understand the principles of adsorption operations and
design of fixed-bed adsorbers;
(ix) know the different types of chromatography used for
sep-aration of biomolecules; and
(x) understand the concepts of differential migration, zone
spreading and resolution in chromatography, know what operating conditions enhance chromatography perfor-mance, and be able to describe scale-up procedures for chromatography columns.
10.1 Bacterial filtration
A suspension of Bacillus subtilis cels is filtered under constant pressure for recovery of protease. A pilot-scale filter is used to measure filtration properties. The filter area is 0.25 m?, the pressure drop is 360 mmHg, and the filtrate viscosity is 4.0 cP. The cell suspension deposits 22 g cake per litre of filtrate. The following data are measured.
Time (min) 2 =3 6 10 15 20
Filtrate volume(\) 10.8 12.1 18,0 21.8 28.4 32.0
(a) Determine the specific cake resistance and filter medium
(b) What size filter is required to process 4000 | cell
suspen-sion in 30 min at a pressure drop of 360 mmHg?
10.2 Filtration of mycelial suspensions
Pelleted and filamentous forms of Streptomyces griseus are
fil-tered separately using a small laboratory filter of area 1.8 cm?,
The mass of wet solids per ml of filtrate is 0.25 g ml~ for the pelleted cells and 0.1 gml~! for the filamentous culture. Viscosity of the filtrate is 1.4 cP. Five filtration experiments at different pressures are carried out with each suspension. The results are as follows:
</div><span class="text_page_counter">Trang 37</span><div class="page_container" data-page="37">(a) Evaluate the specific cake resistance as a function of
pres-sure for each culture.
(b) Determine the compressibility for each culture.
(©) A filter press with area 15 m? is used to process 20 m?
fila-mentous S. griseus culture. If the filtration must be completed in one hour, what pressure drop is required?
10.3. Rotary-drum vacuum filtration
Continuous rotary vacuum filtration can be analysed by con-sidering cach revolution of the drum as a stationary batch
filtration. Per revolution, each cm? of filter cloth is used to
form cake only for the period of time it spends submerged in the liquid reservoir. A rotary-drum vacuum filter with drum diameter 1.5 m and filter width 1.2 m is used to filter starch from an aqueous slurry. The pressure drop is kept constant at 4.5 psis the filter operates with 30% of the filter cloth sub-merged. Resistance due to the filter medium is negligible. Laboratory tests with a 5 cm? filter have shown that 500 ml slurry can be filtered in 23.5 min at a pressure drop of 12 psi; the starch cake was also found to be compressible with s= 0.57. Use the following steps to determine the drum speed required
to produce 20 mỞ filtered liquid per hour. (@) Evaluate y-a' from the laboratory test data. (b) TẾ Nis the drum speed in revolutions per hour, what is the
cycle time?
(6) From (b), for what period of time per revolution is each cm? of filter cloth used for cake formation?
(d) What volume of filtrate must be filtered per revolution to achieve the desired rate of 20 m} per hour?
(©) Apply Eq. (10.11) to a single revolution of the drum to evaluate N.
(f) The liquid level is raised so that the fraction of submerged
filter area increases from 30% to 50%. What drum speed is required under these conditions?
10.4 Centrifugation of yeast
Yeast cells are to be separated from a fermentation broth. Assume that the cells are spherical with diameter 5 pm and density 1.06 g cm7>. The viscosity of the culture broth is 1.36 x 1073N sm~?. Ac the temperature of separation, the
den-sity of the suspending fluid is 0.997 g cmTM>. 500 litres broth
must be treated every hour.
(a) Specify E for a suitably-sized disc-stack centrifuge. (b) The small size and low density of microbial cells are
dis-ad-vantages in centrifugation. Ifinstead of yeast, quartz particles of diameter 0.1 mm and specific gravity 2.0 are separated from the culture liquid, by how much is 3 reduced?
10.5 Centrifugation of food particles
Small food particles with diameter 10°? mm and density
1.03 g cm? are suspended in liquid of density 1.00 g cm.
The viscosity of the liquid is 1.25 mPa s. A tubular-bowl cen-trifugc of length 70 cm and radius 11.5 cm is used to separate the particles. If the centrifuge is operated at 10 000 rpm, esti-mate the feed flow rate at which the food particles are just removed from the suspension.
10.6 Scale-up of disc-stack centrifuge
A pilot-scale disc-stack centrifuge is tested for recovery of bac-teria, The centrifuge contains 25 discs with inner and outer diameters 2 cm and 10 cm, respectively. The half-cone angle is 35°, When operated at a speed of 3000 rpm with a feed rate of
3.5 litre min Ì, 70% of the cells are recovered. Ifa bigger
cen-trifuge is to be used for industrial trcatment of 80 litres mịn — 1, what operating speed is required to achieve the same sedi-mentation performance if the larger centrifuge contains 55 discs with outer diameter 15 cm, inner diameter 4.7 cm, and half-cone angle 45°?
10.7 Centrifugation of yeast and cell debris
A tubular-bowl centrifuge is used to concentrate a suspension of genetically-engineered yeast containing a new recombinant protein. At a speed of 12 000 rpm, the centrifuge treats 3 Ì broth min” Ì with satisfactory results, It is proposed to use the
same centrifuge to separate cell debris from homogenate pro- ° duced by mechanical disruption of the yeast. If the average size of the debris is one-third that of the yeast and the viscosity of the homogenate is five times greater than the cell suspension, what flow rate can be handled if the centrifuge is operated at the same speed?
10.8 Cell disruption
Micrococcus bacteria are disrupted at 5°C in a Manton-Gaulin homogeniser operated at pressures. between 200 and
550 kg, cm, Data for protein release asa function of
num-ber of passes through the homogeniser are as follows:
</div><span class="text_page_counter">Trang 38</span><div class="page_container" data-page="38">-(a) How many passes are required to achieve 80% protein
release at an operating pressure of 460 kg, cm ~2? (b) Estimate the pressure required to deliver 70% protein
recovery in only two passes?
10.9 Enzyme purification using two-phase aqueous partitioning
Leucine dehydrogenase is recovered from a homogenate of disrupted Bacillus cereus cells using an aqueous two-phase polyethylene glycol-salt system. 150 litres of homogenate
initially containing 3.2 units enzyme mÌ~Ì are processed; a
polyethylene glycol-salt mixture is added and two phases form. The enzyme partition coefficient is 3.5.
@)_ What volume ratio of upper and lower phases must be
chosen to achieve 80% recovery of enzyme in a single extraction step?
(b) If the volume of the lower phase is 100 litres, what is the concentration factor for 80% recovery?
10.10 Recovery of viral particles
Cells of the fall armyworm Spodoptera frugiperda are cultured in a fermenter to produce viral particles for insecticide. Viral particles are released into the culture broth after lysis of the host cells. The initial culture volume is 5 litres. An aqueous ‘two-phase polymer solution of volume 2 litres is added to this liquid; the volume of the bottom phases 1 litre. The virus
par-tition coefficient is 1072.
(a) Whatis the yield of virus at equilibrium?
(b) Write a mass balance for viral particles in terms of
con-centrations and volumes of the phases, equating the amounts of virus present before and after addition of polymer solution.
Derive an equation for the concentration factor in terms of liquid volumes and the partition coefficient only. ‘Calculate the concentration factor for the viral extraction.
10.11 Gel chromatography scale-up
Gel chromatography is to be used for commercial-scale purification of a proteinaceous diphtheria toxoid from Corynebacterium diphtheriae supernatant. In the laboratory, a small column of 1.5 cm inner diameter and height 0.4 m is packed with 10 g dry Sephadex gel; the void volume is meas-ured as 23 ml. A sample containing the toxoid and impurities is injected into the column. At a liquid flow rate of
14 ml min=, the elution volume for the toxoid is 29 ml; the
elution volume for the principal impurity is 45 ml. A column of height 0.6 m and diameter 0.5 m is available for large-scale gel chromatography. The same type of packing is used; the void fraction and ratio of pore volume to total bed volume remain the same as in the bench-scale column, The liquid flow rate in the large column is scaled up in proportion to the col-umn cross-sectional area; the flow patterns in both colcol-umns can be assumed identical. The water regain value for the
pack-ing is given by the manufacturer as 0.0035 m? kg— Ì dry gel.
(a) Which is the larger molecule, the diphtheria toxoid or the
(4) Whatis the volumetric flow rate in the large column? (© _ Estimate the retention time of toxoid in the large column? (b)
10.12 Protein separation using chromatography
Human insulin A and B from recombinant Escherichia coli are separated using pilotscale affinity chromatography. Laboratory studies have shown that capacity factors for the proteins are 0.85 for the A-chain and 1.05 for the B-chain. ‘The dependence of HETP on liquid velocity satisfies the fol-lowing type of equation:
A H= —+Bu+C
where wis linear liquid velocity and A, Band Care constants. Values of A, Band Cfor the insulin system were found to be 2
10-9 m2 s~!, 1,5 sand 5.7 107 m, respectively. Two
col-umns with inner diameter 25 cm are available for the process; one is 1.0 m high, the other is 0.7 m high.
(a) Plot the relationship between Hand u from u = 0.1 x 10⁻⁴ to w= 2x 1074,
</div><span class="text_page_counter">Trang 39</span><div class="page_container" data-page="39">(b) What is the minimum HETP? At what liquid velocity is
the minimum HETP obtained?
(6) Ifthe larger column is used with a liquid flow rate of 0.31 lites min—1, will the owo insulin chains be completely
If the smaller column is used, what is the maximum liquid flow rate that will give complete separation? (4)
1. Dwyer, J.L. (1984) Scaling up bio-product separation with high performance liquid chromatography. Bio/Technology 2, 957-964.
2. Belter, P.A, E.L. Cussler and W.-S. Hu (1988) Bioseparations: D Processing for Biotechnology, John Wiley, New York.
3. Flaschel, E., C. Wandrey and MR. Kula (1983) Ultrafiltration for the separation of biocatalysts. Adv. Biochem. Eng /Biotechnol. 26, 73-142.
4. Fane, AG. and J.M. Radovich (1990) Membrane systems. In: J.A. Asenjo (Ed), Separation Processes in Biotechnology, pp. 209-262, Marcel Dekker, New York. 5. Kula, M.-R. (1985) Recovery operations. In: H.-J. Rehm
and G. Reed (Eds), Biotechnology, vol. 2, pp. 725-760, VCH, Weinheim.
6. Hsu, H.-W. (1981) Separations by Centrifugal Phenomena, John Wiley, New York.
7. Ambler, C.M. (1952) The evaluation of centrifuge
per-formance. Chem. Eng. Prog. 48, 150-158.
8. Ambler, C.M. (1988) Centrifugation. In: PA. Schweitzer (Ed), Handbook of Separation Techniques for Chemical Engineers, 2nd edn, pp. 4-59-4-88, McGraw-Hill, New York.
9. Perry, R.H„ D.W. Green and J.O. Maloney (Eds) (1984) Chemical Engineers’ Handbook, 6th edn, pp. 19-89-19-96, McGraw-Hill, New York.
10. Hetherington, PJ., M. Follows, P. Dunnill and M.D. Lilly (1971) Release of protein from bakers’ yeast (Saccharomyces cerevisiae) by disruption in an industrial homogeniser. Trans. IChE49, 142-148.
11. Engler, C.R. and C.W. Robinson (1981) Effects of organism type and growth conditions on cell disruption by impingement. Biotechnol. Lett. 3, 83-88. 12. Coulson, J.M. and J.F. Richardson (1991) Chemical
Engineering, vol. 2, 4th edn, Chapters 17 and 18, Pergamon Press, Oxford.
13. Snyder, L.R. (1974) Classification of the solvent proper-ties of common liquids. J. Chromatog. 92, 223-230. 14, Johnson, E.L. and R. Stevenson (1978) Basic Liguid
15. Scopes, RK. (1982) Protein Purification, Springer-Verlag, New York.
16. Giddings, J.C. (1965) Dynamics of Chromatography, Part I, Marcel Dekker, New York.
17. Heftmann, E. (Ed) (1967) Chromatography, 2nd edn, Reinhold, New York.
Suggestions for Further Reading
‘There is an extensive literature on downstream processing of biomolecules. The following is a small selection.
Downstream Processing (see also refs 2 and 5)
Asenjo, J.A. (1990) (Ed) Separation Processes in Biotechnology, Marcel Dekker, New York.
Atkinson, B. and F. Mavituna (1991) Biochemical Engineering and Biotechnology Handbook, 2nd edn, Chapters 16 and 17, Macmillan, Basingstoke.
van Brakel, J. and HH. Kleizen (1990) Problems in down-stream processing. In: M.A. Winkler (Ed), Chemical Engineering Problems in Biotechnology, pp. 95-165, Elsevier Applied Science, London.
Filtration (sce also refs 2-4)
Coulson, J.M. and J.F. Richardson (1991) Chemical Engineering, vol. 2, 4th edn, Chapter 7, Pergamon Press, Oxford.
McCabe, W.L. and J.C. Smith (1976) Unit Operations of Chemical Engineering, 3rd edn, pp. 922-948, McGraw-Hill, Tokyo.
Nestaas, E. and D.I.C. Wang (1981) A new sensor, the ‘filtra-tion probe’, for quantitative characteriza‘filtra-tion of the penicillin fermentation. I. Mycelial morphology and cul-ture activity. Biotechnol. Bioeng. 23, 2803-2813. Oolman, T. and T.-C. Liu (1991) Filtration properties of
mycelial microbial broths. Biotechnol. Prog. 7, 534-539.
Centrifugation (sce also refs 2, 6 and 8)
Axelsson, H.A.C. (1985) Centrifugation. In: M. Moo-Young (Ed), Comprehensive Biotechnology, vol. 2, pp. 325-346, Pergamon Press, Oxford.
Coulson, J.M. and J.F. Richardson (1991) Chemical Engineering, vol. 2, 4th edn, Chapter 9, Pergamon Press,
</div><span class="text_page_counter">Trang 40</span><div class="page_container" data-page="40">Cell Disruption (see also refs 10 and 11)
Chisti, Y. and M. Moo-Young (1986) Disruption of microbial cells for intracellular products. Enzyme Microb. Technol. 8, 194-204.
Dunnill, P. and M.D. Lilly (1975) Protein extraction and
Adsorption (see also refs 2 and 15)
Amold, F.H., H.W. Blanch and C.R. Wilke (1985) Analysis of affinity separations. I. Predicting the performance of affinity adsorbers, Chem. Eng. J.30, B9-B23. Hines, A.L. and R.N. Maddox (1985) Mass Transfer: recovery from microbial cells. In: S.R. Tannenbaum and
D.LC. Wang (Eds), Single-Cell Protein I, pp. 179-207, MIT Press, Cambridge, Massachusetts.
Engler, C.R. (1985) Disruption of microbial cells. In: M. Moo-Young (Ed), Comprehensive Biotechnology, vol. 2, pp.
305-324, Pergamon Press, Oxford.
Kula, M.-R. and H. Schiitte (1987) Purification of proteins and the disruption of microbial cells. Biotechnol. Prog. 3, 31-42.
Aqueous Two-Phase Liquid Extraction Albertsson, P-Ä. (1971) Partition of Cell Particles and
Macromolecules, 2nd edn, John Wiley, New York. Diamond, A.D. and J.T. Hsu (1992) Aqueous two-phase
systems for biomolecule separation. Adv. Biochem. Eng /Biotechnol. 47, 89-135.
Kroner, K.H., H. Schiitte, W. Stach and M.-R. Kula (1982) Scale-up of formate dehydrogenase by partition. J. Chem.
Tech, Biotechnol, 32, 130-137.
Kula, M-R, KH. Kroner and H. Husedt (1982) Purification of enzymes by liquid-liquid extraction. Adv. Biochem. Eng. 24, 73-118.
Kula, M.-R. (1985) Liquid-liquid extraction of biopolymers. In: M. Moo-Young (Ed), Comprehensive Biotechnology, vol. 2, pp. 451-471, Pergamon Press, Oxford.
Fundamentals and Applications,Chapter 14, Prentice-Hall, New Jersey.
Slejko, F.L. (1985) (Ed) Adborption Technology, Marcel Dekker, New York.
Chromatography (sec also refs 1, 16 and 17)
Chisti, Y. and M. Moo-Young (1990) Large scale protein sep-arations: engineering aspects of chromatography. Biotech. Adv. 8, 699-708.
Cooney, J.M. (1984) Chromatographic gel media for large scale protein purification. Bio/Technology, 2 41-43, 46-51, 54-55.
Delaney, R.A.M. (1980) Industrial gel filtration of proteins. In: RA. Grant (Ed), Applied Protein Chemistry, pp. 233-280, Applied Science, London.
Janson, J.-C. and P. Hedman (1982) Large-scale chromatog-raphy of proteins. Adv. Biochem. Eng. 25, 43-99. Ladisch, M.R. (1987) Separation by sorption. In: H.R.
Bungay and G. Belfort (Eds), Advanced Biochemical Engineering, pp. 219-237, John Wiley, New York. Robinson, P,J., M.A. Wheatley, J.-C. Janson, P. Dunnill and
M.D. Lilly (1974) Pilot scale affinity chromatography: purification of P-galactosidase. Biotechnol. Bioeng. 16,
<small>1103-1112.</small>
</div>