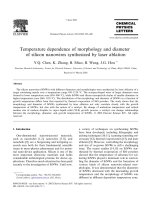
FLUX COMPOSITION DEPENDENCE OF MICROSTRUCTURE AND TOUGHNESS OF SUBMERGED ARC HSLA WELDMENTS
Bạn đang xem bản rút gọn của tài liệu. Xem và tải ngay bản đầy đủ của tài liệu tại đây (1.11 MB, 15 trang )
<span class="text_page_counter">Trang 1</span><div class="page_container" data-page="1">
Flux Composition Dependence of Microstructure and Toughness of
Submerged Arc HSLA Weldments
<i>CaF2-CaO-SiC>2 system fluxes produce good quality niobium microalloyed HSLA weldments with very low oxygen content </i>
<b>BY C. B. DALLAM, S. LIU, AND D. L OLSON </b>
ABSTRACT. Twenty eight reagent grade fused fluxes from the CaF2-CaO-Si02 sys-tem were used to produce bead-on-plate and double-V-groove submerged arc welds on a quenched-and-tempered nio-bium HSLA steel. An E70S3 welding wire was used with t w o different heat inputs —namely, 1.9 and 3.3 k j / m m (48.3 and 83.8 kj/in.) A niobium microalloyed steel was selected because of its fine grained microstructure, high yield strength, and high toughness at low tem-peratures. Fluxes from the CaF
<small>2</small>-CaO-Si02 system were selected because of their low oxygen potential, and their ability to produce low oxygen (80-450 ppm) welds. Quantitative metallography and chemical analysis were performed on the welds. The chemical behavior of this flux system has been characterized with respect to manganese, silicon, niobium, and sulfur.
The lower heat input welds showed predominantly fine microstructure of acicular ferrite. At high oxygen content, a higher percentage of grain boundary fer-rite (ferfer-rite veining) was observed. By reducing the oxygen in the weld metal, the amount of acicular ferrite was increased. With further reduction of weld metal oxygen, the main microstructural feature, instead of acicular ferrite, became bainite. Using higher heat input.
<i>Based on paper presented at the 64th Annual A WS Convention held in Philadelphia, Pennsyl-vania, during April 24-29, 1983. </i>
<i>C B. DALLAM, S. LIU, and D. L. OLSON are with the Center for Welding Research, Department of Metallurgical Engineering, Col-orado School of Mines, Golden, ColCol-orado. </i>
the weld metal microstructure transition with oxygen level was not so clear.
In spite of the essentially similar optical microstructure and similar chemical com-position (other than oxygen), the mechanical properties of the various welds were observed to be very differ-ent. Toughness data (upper shelf energy and transition temperature) were found to correlate with weld metal oxygen content. The upper shelf energy decreased with increasing oxygen level in the weld metal.
<b>Introduction and Background </b>
HSLA steels were developed to achieve high yield strength and at the same time maintain a reasonable level of toughness with a minimum of alloying. Due to the possibility of increased design loading and strength to weight ratio, more and more structural applications using HSLA steels are being seen. Some examples are line pipes for gas and oil transportation and off-shore structures. The physical metallurgy of these microal-loyed steels for the optimization of their microstructure and properties has already been treated extensively in the literature (Refs. 1-4) and are not discussed in this paper.
Most applications of HSLA steels involve structures where welding is used. Two major consequences of this fabrica-tion process are the deteriorafabrica-tion of the base metal properties due to the welding thermal cycles and the introduction of a solidification structure which is heteroge-neous (compared to the base metal) both chemically and microstructurally. In the fusion zone, the weld metal composition,
heat input and cooling rate, solidification characteristics, and reheating thermal cycles (in multiple pass welds) contribute to the final properties of the weld joint. Adjacent to the fusion zone is a thermally
<i>affected region (heat-affected zone, i.e., </i>
HAZ) within which the base metal micro-structure is altered by the high tempera-ture of the molten weld pool. Martensite or other low temperature transformation products may be formed impairing the toughness of these regions.
As noted below, under separate head-ing, the presence of oxygen can influence weld metal microstructure and proper-ties. With this in mind, the behavior of CaF
<small>2</small>-CaO-Si02 flux systems was studied with the purpose of reporting on weld metal performance when using these fluxes on a niobium microalloyed steel.
Some Background
Typical Microstructure of C-Mn Steel Weldments
Several different microstructures may be obtained in the weld metal of low carbon microalloyed steels. They are grain boundary ferrite (BF), side plate ferrite (SPF), acicular ferrite (AF), upper bainite (AC), and micro-constitutents such as pearlite, cementite, and martensite.
Figure 1 shows some of the main constituents of a C-Mn steel weldment. A comparison of the various classifications of low carbon, low alloy steel weld metal microstructure is shown in Table 1. Factors Affecting Weld Metal Microstructure
F.-jctors affecting weld metal toughness have been studied and acicular ferrite
140-s | MAY 1985
</div><span class="text_page_counter">Trang 2</span><div class="page_container" data-page="2">was found to be the constituent respon-sible for the high toughness (Refs. 6, 7). Acicular ferrite is formed intragranularly, resulting in randomly oriented short fer-rite needles with a basket weave feature. This interlocking nature, together with its fine grain size, provides the maximum resistance to crack propagation by cleav-age. For this reason, it has become increasingly important to understand the factors which would maximize the vol-ume fraction of acicular ferrite in the weld metal.
Weld metal composition (alloying ele-ments and oxygen), prior austenite grain size, and welding heat input (cooling rate) are the three main factors that determine the microstructure of a weld metal. It is shown (Ref. 8) that an increasing cooling rate progressively refines the resulting microstructure from grain boundary fer-rite t o side plate ferfer-rite, acicular ferfer-rite, bainite, and eventually to martensite.
Alloying elements in the weld metal may come from the base metal, the welding electrode, and the welding fluxes. Hardenability agents such as man-ganese, chromium, and molybdenum will shift the austenite decomposition trans-formation to longer delay times. Superim-posing a cooling curve on the transfor-mation curves, one notices that the refin-ing of the final weld microstructure can be explained. This is shown schematically in Fig. 2. Composition control is necessary in order to maximize the volume fraction of acicular ferrite, because excessive alloying elements can cause the forma-tion of bainite and martensite.
A number of recent investigations (Refs. 9-13) indicate that oxygen affects the weld metal microstructure and the
<i>Fig. 1 — Typical microstructures in low carbon low alloy steel weldments showing: grain boundary ferrite (a); side plate ferrite (b); acicular ferrite (c); bainite (d) </i>
mechanical properties in the form of inclusions. These inclusions may be a product of the deoxidation process or result from some solid state transforma-tion (Ref. 14). Using Charpy testing data,
Ito and Nakanishi (Ref. 15) observed that both high and low weld metal oxygen content weldments (with >500 ppm or <200 ppm) showed poor impact proper-ties. Only the intermediate level oxygen
<b>Table 1—Classification and </b>
<i><small>(a) Nakanishi, M . , Watanabe. I. I.. Kojima, T.. M o r i , N. et al, Kikuta, Y., et al. </small></i>
<i><small>(b) Pargeter, R. I.; W a t s o n , M . N . . Harrison, P. L . Farrar, R. A.; Levine, E„ Hill, D. C , Sawhill |r., |. M . , Choi. C L., Hill, D. C , Clover, A. C , et al., Pacey, A. ).. Kerr, K. W . , Abson, D. I.. Dolby, </small></i>
<small>R. E., and Hart, P. H. M . </small>
WELDING RESEARCH SUPPLEMENT 1141-s
</div><span class="text_page_counter">Trang 3</span><div class="page_container" data-page="3"><i>Fig. 2 — Schematic continuous cooling transformation diagram of a low carbon low alloy steel weldment showing the effects of composition on weld metal phase transformations. In the dia-gram, "M" represents martensite, "AC" designates upper bainite (aligned ferrite with carbide), "AF" signifies acicular ferrite, and </i>
<i>"BF" represents blocky ferrite </i>
<i>Fig. 3 —Partial ternary diagram of CaF<small>2</small>-CaO-Si02 system showing the nominal compositions of the fluxes used (open circles first set of welds; filled circles—both first and second set of welds) </i>
w e l d s (200 p p m t o 5 0 0 p p m ) p r o d u c e d t o u g h acicular ferrite structures. Kikuta ef
<i>al. (Ref. 16) r e p o r t e d t h e same t r e n d f o r </i> -marily acicular ferrite m i c r o s t r u c t u r e , w h i l e side plate ferrite p r e d o m i n a t e d at o x y g e n - r i c h inclusions can directly nucle-ate acicular ferrite. In t h e absence o f these inclusions, lath t y p e structures c u r v e in Fig. 2 t o shorter delay times.
Harrison a n d Farrar (Ref. 18) r e p o r t e d grain size, f a v o r i n g grain b o u n d a r y ferrite a n d side plate ferrite f o r m a t i o n . Ferrante a n d Farrar (Ref. 19) d e t e r m i n e d that the
inclusions c o n t r o l t h e austenite grain g r o w t h b y pinning o f t h e grain b o u n d -aries, f o l l o w i n g the Z e n e r e q u a t i o n o f p r e c i p i t a t e - b o u n d a r y i n t e r a c t i o n . T h e y also f o u n d that acicular f e r r i t e directly nucleates f r o m the inclusions.
Keville (Ref. 14) a n d Pargeter (Ref. 20) s h o w e d that t h e inclusions' size, distribut i o n , a n d distribut y p e ( c o m p o s i distribut i o n ) can b e c o r -r e l a t e d t o t h e m i c -r o s t -r u c t u -r e a n d t h e toughness o f t h e w e l d m e t a l . Keville (Ref. 21) also i n d i c a t e d that t h e inclusions are
T h e t y p e s o f inclusions w e r e also cata-l o g u e d using particcata-le anacata-lyzer scanning w e l d s m a d e w i t h high basicity fluxes.
T h e l o w e r viscosity o f high basicity fluxes m a y b e t h e cause o f t h e increase in
</div><span class="text_page_counter">Trang 4</span><div class="page_container" data-page="4">Table 3—Welding Conditions for the 1st and 2nd Set of Experiments
<i>Fig. 4 —loint geometry of the double-V-grooved welds; measurements given in inches </i>
of a flux are generally oxides, and a reasonably high oxygen potential of the flux would be expected. Therefore, the main source of oxygen in the submerged arc welding process is the flux. Some commercial flux systems based on FeO, M n O and SiC>2 may contribute up to 1000 ppm of oxygen to the weld metal.
The requirement of low weld metal oxygen to achieve high toughness (high volume fraction of acicular ferrite) leads to the reformulation of fluxes attempting to reduce the oxygen transfer. One way is to substitute non-oxygen carriers (such as fluorides) for some of the oxides in the fluxes. Decreasing the amount of oxygen in the flux, a reduction of weld metal oxygen would be expected. A second
<i>way is to replace weak oxides (e.g., silica </i>
and ferrous oxide) partially by stronger oxides such as calcium oxide and magne-sium oxide. Since the Ca-O bonds are much stronger than the Si-O bonds, the degree of dissociation of calcium oxide in the molten flux would be less than that of silica, resulting in a lower weld metal oxygen content. Another possible alter-native is the addition of metal powders
<i>(e.g., aluminum, titanium) to the fluxes to </i>
reduce the weld metal oxygen pickup (Refs. 11,25,26).
<b>Experimental Procedure </b>
Twenty eight reagent grade fused fluxes were produced from the CaF2-CaO-Si02 system, using nominal compo-sition at every 10% increment on the ternary phase diagram —Fig. 3. The details of the flux preparation were reported in a previous paper (Ref. 27). Two quenched-and-tempered niobium microalloyed steel plates of similar grade
<i>were used to make the welds, and a %i </i>
in. (2.38 mm) diameter E70S3 welding electrode was used. The chemical com-position of the plates and the welding electrode are given in Table 2.
Two sets of experiments were per-formed:
1. Bead-on-plate welds were made on 4 X 1 0 X 0 . 5 in. ( 1 0 0 X 2 5 0 X 1 3 mm) plates (machined from plate I) with each one of the fluxes. Instead of using the flux hopper, a flux bin was set up along the torch path. The welding process parame-ters are shown in Table 3. The welds were used to study variables such as arc instability, bead morphology and
pene-tration, and contact angle for interfacial energy calculations.
Metallographic analysis and Rockwell hardness measurements were performed on each weldment. Chemical analyses were performed using a Baird Atomic Spectrovac Model 1000 Emission Spec-trometer. Weld metal oxygen, nitrogen, sulfur, and carbon contents were deter-mined using Leco Analyzers. The chemi-cal interaction between the molten flux and weld pool was also studied.
2. Double-V-groove welds were made on plates machined from the plate II. The dimensions of the welding plates were 4 X 1 1 X 0 . 6 2 5 in. (100 X 280 X 16 mm). Specific fluxes, indicated in Fig. 3, were used for this second set of welds. The joint design is shown in Fig. 4; the welding conditions are shown in Table 3.
The welds were radiographically examined before standard Charpy speci-mens were prepared. Approximately nine Charpy bars were machined out of each weld. The Charpy V-notch tough-ness measurements were done using a Tinius Olsen Charpy machine, with the testing temperatures ranging from —100 to 120°C ( - 1 4 8 to 248°F). At least eight temperatures were tested for each weld. Fractographic analyses were also done using AMR scanning electron micro-scope.
Carbon extraction replicas were made on some of the welds in order to exam-ine the inclusions and other second phases present in the welds. The replicas were examined using the Philips 200 transmission electron microscope.
In an attempt to characterize the crys-talline nature of the inclusions, an acid extraction was performed. Some drilling shavings from the weld were chemically decomposed with hydrochloric acid (10:1). To accelerate the process of dis-solution, the solution was heated to close to boiling with an argon cover gas. After the extraction, the fluid was filtered through a Millipore filtration set-up (0.025 micron pore size). The filtered particles were examined using a Philips x-ray dif-fractometer and spectrometer.
<b>Results and Discussion </b>
Chemical Behavior of the Fluxes
The final weld composition for a
par-ticular element is made up of contribu-tions from the welding electrode, the base metal, and the weld metal-flux reac-tions. The chemical behavior will be expressed in terms of a quantity called delta (A); this is the difference between the composition of a particular element determined analytically and the amount of that element which could be present in the weld if no elemental transfer from the weld pool to the flux or vice versa had occurred. The effects of dilution with the base metal were also taken into account. A negative value of delta means that, during welding, a particular element has been transferred from the weld metal to the slag; a positive delta would indicate the element going from the molten flux to the weld metal.
The chemical composition and the ele-mental delta values of the first set of welds are presented in Tables 4A, B and 5. The delta quantities of the elements were then plotted as a function of flux composition. Negative delta values were seen for manganese and niobium —Figs. 5 and 6. These delta quantities were also insensitive to flux compositional changes. This observation implies the activities of manganese and niobium are nearly con-stant for these systems.
High temperature activity data of M n O (Ref. 28) in the MnO-CaO-Si0
<small>2</small>system indicate that the M n O activity is almost constant with 40% Si02 content in the flux providing the conditions of a con-stant delta manganese in the weld metal for that system. Comparing the t w o curves in Fig. 5, the same behavior would be expected for welds made with CaF2" CaO-Si02 fluxes, resulting in the constant delta manganese. A constant delta quan-tity in this case also suggests that small flux variation will not significantly alter the weld metal chemical composition.
The delta sulfur quantity is plotted as a function of the ratio C a O / S i 0
<small>2</small>in Fig. 7. The deviations were all negative, indicat-ing weld pool desulfurization. With increasing CaO-Si0
<small>2</small>, an increasing sulfur loss was observed. This is related to the oxygen potential of the molten flux in contact with the molten weld pool and can be explained by the desulfurization
</div><span class="text_page_counter">Trang 5</span><div class="page_container" data-page="5">The increase of K ' , w i t h increasing basicity in Fig. 8, indicates that t h e sulfur is
being p a r t i t i o n e d m o r e t o t h e slag. This translates i n t o a n e g a t i v e delta sulfur q u a n t i t y a n d agrees w i t h t h e t r e n d s h o w n in Fig. 7. By increasing C a O activi-t y in activi-t h e flux, activi-t h e sulfur will b e r e m o v e d
Table 4B—Flux Compositions for the Various Weld Number Designations
Table 5—Delta Quantities of Manganese, Silicon, Niobium, Sulfur for the 28 Welds Produced Using a Heat Input of 1.87 KJ/mm, %
</div><span class="text_page_counter">Trang 6</span><div class="page_container" data-page="6"><i>Fig. 5 —Delta manganese plotted as a function of weight-percent CaF<small>2</small> for two different flux systems </i>
<i>Fig. 6 —Delta niobium plotted as a function of weight-percent CaF2 for different Si0<small>2</small> contents in the CaO-CaF<small>2</small>-SI0<small>2</small> flux system </i>
more readily. This can occur by reducing the silica content in the flux for the CaF<small>2</small>-CaO-Si02 system.
Silicon had both positive and negative delta values (gained or lost) as shown in
Fig. 9. W h e n the SiO? content is approxi-mately equal to the CaO content, no silicon transfer was observed. This corre-sponds to the zero delta silicon region (shaded region indicated in Fig. 9). Above
400
300
o u_
that region (%Si0<small>2</small>/%CaO greater than one), there was an increase of silicon in the weld pool indicating that silicon was transferred from the flux to the weld. When %Si0<small>2</small>/%CaO is less than one, a
</div><span class="text_page_counter">Trang 7</span><div class="page_container" data-page="7"><i>Fig. 9 —Partial ternary diagram of CaF</i>
<i><small>2</small></i><i>-CaO-Si0</i>
<i><small>2</small></i><i> system showing the composition regions where the weld metal gains or loses silicon. Notice the region of no silicon change, ASi = 0 </i>
silicon loss was seen. The thermodynamic activity data (Ref. 30) shown in Fig. 10 explains the shaded region of no silicon change, since the silicon isoactivity lines lie parallel to this shaded region.
If it is desirable for the composition of the weld to be equal to the base metal composition, manganese and niobium can be introduced into the weld metal by either adjusting the flux composition or by alloy additions to the welding
elec-40%SiO
trodes. The silicon content, in the present case, can be controlled by simply adjust-ing the flux composition. The concept of controlling the weld metal composition by the proper combination of flux and
<i>filler metal (i.e., welding electrode) is very </i>
important, especially in cases where weld metal chemistry must be kept in narrow compositional ranges.
The results of the oxygen analysis on the weld beads are shown in Fig. 11.
4 0 % Si0<small>2 </small>
<small>CoO </small>
% CaF
<small>2 </small><i>Fig. 11-Partial ternary diagram of CaF</i>
<i><small>2</small></i><i>-CaO-Si0</i>
<i><small>2</small></i><i> system showing the variation of weld metal oxygen as a function of flux composition </i>
Welds made with silica free fluxes showed the lowest oxygen contents (<100 ppm). Increasing the silica content in the flux, the weld metal oxygen was found to increase. To a lesser degree, an increase in CaO content also increased the oxygen content in the weld metal.
Traditionally, weld metal oxygen and mechanical properties had been related
<i>to the basicity index. Tuliani et al. (Ref. 31) </i>
showed that higher basicity fluxes resulted in lower weld metal oxygen, sulfur, and silicon. Weld metal toughness was also said to improve with increasing basicity index (Ref. 32). However, it is still questionable whether the parameter basicity index expresses any fundamental relationship. The flux basicity index (B.I.) equation proposed by Tuliani (Ref. 31)
Eagar (Ref. 24) modified this relationship by omitting the CaF
<small>2</small>term. Using the equation developed by Eagar (Ref. 24), the weld metal oxygen contents were plotted as a function of basicity index — Fig. 12. The data points showed large scattering without following the usual trend as indicated by the solid curve proposed by other authors (Refs. 24, 31). However, if the weld metal oxygen con-tent were plotted using all the terms in equation (3), the data points fell smoothly in the band as seen in Fig. 13 and report-ed in the literature (Ref. 24). This compli-cates the interpretation of the relation-ship between the basicity index and weld metal oxygen. It is also known that weld metal oxygen content increases with an increasing heat input.
Microstructure
A definite trend of microstructural vari-ation was observed within the series of weld metals. For the purpose of analysis, the following discussion will be based upon three particular weldments. Figure 14 shows the light micrographs of the three weldments. Their oxygen contents are 350, 250, and 140 ppm, respectively (each containing similar manganese and silicon contents).
The t w o main features seen in the high oxygen weld metal are grain boundary ferrite and acicular ferrite. The grain boundary ferrite occurred in the form of continuous veining along the prior aus-tenite grain boundaries, and constituted around 20 to 30% of the whole struc-ture—Fig. 14A.
By reducing the oxygen in the weld metal to 250 ppm, a refining of the microstructure was seen. There was a significant decrease of grain boundary ferrite veining. Quantitative
<b>metallogra-146-s | M A Y 1985 </b>
</div><span class="text_page_counter">Trang 8</span><div class="page_container" data-page="8"><i>Fig. 12 - Variation of weld metal oxygen content with basicity index omitting the CaF<small>2</small> term </i>
<i>Fig. 13 — Variation of weld metal oxygen content with basicity index including the CaF<small>2</small> term </i>
p h y s h o w e d that acicular ferrite seen b e t w e e n t h e ferrite plates a n d w e r e thus classified as bainite —Fig. 14C.
T h e results d e p i c t e d in Fig. 14 suggest sions, a n d arc stabilities w e r e q u a n t i t a -tively m e a s u r e d a n d analyzed. T h e results h a v e b e e n r e p o r t e d in a p r e v i o u s p a p e r (Ref. 27), a n d are n o t discussed here. Recommended Fluxes from the w e l d i n g o f HSLA steels because t h e
<i>Fig. 14 — Microstructural variation with weld metal oxygen content: A - 350 ppm of oxygen, mixed microstructure of grain boundary ferrite and acicular ferrite; B- 260 ppm of oxygen, microstructure predominantly acicular ferrite; C- 107 ppm of oxygen, microstructure predominantly upper bainite </i>
</div><span class="text_page_counter">Trang 9</span><div class="page_container" data-page="9">w i t h o t h e r flux systems) w o u l d yield a larger a m o u n t o f grain b o u n d a r y ferrite a n d side plate ferrite t h a n desired f o r t h e m a x i m u m toughness. Regions t o t h e left side o u g h t t o b e a v o i d e d because o f t h e steep ridges in the m e l t i n g t e m p e r a t u r e o f t h e fluxes.
Toughness
F r o m t h e indicated r e g i o n in Fig. 9, nine fluxes c o u l d b e selected a l o n g the z e r o delta silicon q u a n t i t y line f o r the s e c o n d set o f w e l d s . The chemical c o m p o s i t i o n variation w a s n o t as clear as the l o w e r heat i n p u t w e l d s . High m a g n i f i c a t i o n light m i c r o g r a p h s s h o w e d that slightly finer selected c a r b o n e x t r a c t i o n replicas are s h o w n in Fig. 17. High w e l d metal o x y g e n
Table 7—The Upper Shelf Energies (USE) and the 100 Joules Transition Temperatures (TT<small>10</small>oj) of the Nine Welds Produced Using a Heat Input of 3.3 k j / m m
</div><span class="text_page_counter">Trang 10</span><div class="page_container" data-page="10"><i>Fig. 76 - Variation of the upper shelf energies (USE) of the Charpy specimens with weld metal oxygen content showing a decreasing USE with increasing oxygen </i>
samples s h o w e d higher inclusion c o n t e n t t h a n t h e l o w e r o x y g e n w e l d s . Finer parti-cles a n d larger size variation w e r e also seen t o b e associated w i t h t h e higher
<i>Fig. 17 —Carbon extraction replicas of weld metal showing the effects of weld metal oxy-gen content on the distribution of inclusions: A — 432 ppm oxygen weld metal; B — 205 ppm oxygen weld metal </i>
w e l d m e t a l o x y g e n can b e used t o
<i>Fig. 19 —Scanning electron micrographs of the Charpy specimens fracture surfaces at 97 "C (206.8 "F) high testing temperatures showing ductile type failure with dimples: A — 432 ppm oxygen weld metal; B - 205 ppm oxygen weld </i>
<i>Fig. 18-Charpy V-notch energy curves as a function of temperature for the highest and lowest weld metal oxygen content welds produced with 20%CaF<small>2</small>-40%CaO-40%SiO<small>2</small> and 80%CaF<small>2</small>-10%CaO-10%SiO<small>2</small> fluxes </i>