IDENTIFICATION OF INVASION-METASTASIS- ASSOCIATED MICRORNAS IN HEPATOCELLULAR CARCINOMA BASED ON BIOINFORMATIC ANALYSIS AND EXPERIMENTAL VALIDATION
Bạn đang xem bản rút gọn của tài liệu. Xem và tải ngay bản đầy đủ của tài liệu tại đây (8.04 MB, 15 trang )
<span class="text_page_counter">Trang 1</span><div class="page_container" data-page="1">
Identification
of invasion-metastasis-associated microRNAs in hepatocellular carcinoma based
on bioinformatic analysis and experimental validation
Weiyang Lou
<small>1,2,3†</small>, Jing Chen
<small>4,5†</small>, Bisha Ding
<small>1,2,3†</small>, Danni Chen
<small>1,2,3</small>, Huilin Zheng
<small>1,2,3</small>, Donghai Jiang
<small>1,2,3</small>, Liang Xu
<small>1,2,3</small>, Chang Bao
<small>1,2,3</small>, Guoqiang Cao
<small>1,2,3</small>and Weimin Fan
<small>1,2,3,6*</small><b>Abstract </b>
<b>Background: Hepatocellular carcinoma (HCC) is one of the most lethal cancer, mainly attributing to its high </b>
ten-dency to metastasis. Vascular invasion provides a direct path for solid tumor metastasis. Mounting evidence has demonstrated that microRNAs (miRNAs) are related to human cancer onset and progression including invasion and metastasis.
<b>Methods: In search of invasion-metastasis-associated miRNAs in HCC, microarray dataset GSE67140 was </b>
down-loaded from the Gene Expression Omnibus database. Differentially expressed miRNAs (DE-miRNAs) were obtained by R software package and the potential target genes were predicted by miRTarBase. The database for annotation, visualization and integrated discovery (DAVID) was introduced to perform functional annotation and pathway enrich-ment analysis for these potential targets of DE-miRNAs. Protein–protein interaction (PPI) network was established by STRING database and visualized by Cytoscape software. The effects of the miR-494-3p and miR-126-3p on migration and invasion of HCC cell lines were evaluated by conducting wound healing assay and transwell assay.
<b>Results: A total of 138 DE-miRNAs were screened out, including 57 upregulated miRNAs and 81 downregulated </b>
miRNAs in human HCC tumors with vascular invasion compared with human HCC tumors without vascular invasion. 762 target genes of the top three upregulated and downregulated miRNAs were predicted, and they were involved in HCC-related pathways, such as pathway in cancer, focal adhesion and MAPK signaling pathway. In the PPI network,
<i>the top 10 hub nodes with higher degrees were identified as hub genes, such as TP53 and MYC. Through constructing </i>
the miRNA-hub gene network, we found that most of hub genes could be potentially modulated by miR-494-3p and miR-126-3p. Of note, miR-494-3p and miR-126-3p was markedly upregulated and downregulated in HCC cell lines and tissues, respectively. In addition, overexpression of miR-494-3p could significantly promote HCC migration and invasion whereas overexpression of miR-126-3p exerted an opposite effect.
<small>© The Author(s) 2018. This article is distributed under the terms of the Creative Commons Attribution 4.0 International License (http://creat iveco mmons .org/licen ses/by/4.0/), which permits unrestricted use, distribution, and reproduction in any medium, provided you give appropriate credit to the original author(s) and the source, provide a link to the Creative Commons license, and indicate if changes were made. The Creative Commons Public Domain Dedication waiver (http://creat iveco mmons .org/publi cdoma in/zero/1.0/) applies to the data made available in this article, unless otherwise stated.</small>
<b>Open Access</b>
<small>*Correspondence: </small>
<small>†Weiyang Lou, Jing Chen and Bisha Ding contributed equally to this work</small>
<small>1 Program of Innovative Cancer Therapeutics, Division of Hepatobiliary and Pancreatic Surgery, Department of Surgery, First Affiliated Hospital, College of Medicine, Zhejiang University, 79 Qingchun Road, Hangzhou 310003, China</small>
<small>Full list of author information is available at the end of the article</small>
</div><span class="text_page_counter">Trang 2</span><div class="page_container" data-page="2">Hepatocellular carcinoma (HCC) is a high aggressive malignancy which mortality is nearly tantamount to its incidence [1]. It ranks the third most common causes of cancer-related death worldwide [2]. A variety of factors lead to the fearful situation, among which metastasis is the main one. Metastasis is a complicated process involv-ing several sequential steps, includinvolv-ing local invasion, intravasation, transport and survival in the circulatory system, extravasation, and settlement and proliferation in a new site [3]. As liver is an organ rich in blood ves-sel, vascular invasion is extremely frequent in clinical patients with HCC. Vascular invasion has a close connec-tion with metastasis because it provides a direct path for cancer metastasis, and is a common precursor to occur-rence of metastasis. Increasing studies have shown that cancer invasion and metastasis are closely associated with multiple biological processes, like degradation of extracellular matrix (ECM) [4], epithelial–mesenchy-mal transition (EMT) [5], immune evasion [6], homing of circulating cancer cells and cancer stem cells (CSCs) [7]. However, the detailed molecular mechanisms that manipulate invasion and metastasis of HCC are largely unknown and need to be further elucidated. Further-more, most of effective targeted therapeutic drugs for HCC are unavailable.
MicroRNAs (miRNAs) are a group of small endog-enous single-stranded non-coding RNAs, approximately 21–25 nucleotides in length [8]. MiRNAs can negatively modulate gene expression via binding to the 3′-untrans-lated region of messenger RNA (mRNA), thereby leading to direct degradation of mRNA or suppression of protein translation. Through this approach, miRNAs are involved in regulation of many biological processes such as pro-liferation, apoptosis, cell cycle and differentiation and DNA repair [9]. Over the past decades, mounting studies have demonstrated that miRNA is frequently abnormally expressed in various types of cancer including HCC [10], and the dysregulation of miRNA plays a paramount role in tumorigenesis, invasion and metastasis [11]. How-ever, research exploring invasion-metastasis-associated miRNAs in HCC based on large-scale human tissues are rarely seen.
With the rapid development of gene chip and RNA sequencing technologies, Gene Expression Omnibus (GEO) gradually plays an important role in bioinformatic analysis [12]. It can provide us novel clues for discovering
reliable and functional miRNAs. In this study, differen-tially expressed miRNAs (DE-miRNAs) in HCC sam-ples with or without vascular invasion were screened out using miRNA expression profile of GSE67140. The potential target genes of the top three most upregulated and downregulated miRNAs were predicted by miR-TarBase, and their potential functions were analyzed by gene ontology (GO) annotation and Kyoto Encyclopedia of Genes and Genomes (KEGG) pathway enrichment analysis. Moreover, a protein–protein interaction (PPI) network of these predicted target genes and miRNA-gene regulatory network were constructed by Cytoscape software. Next, the expression levels of the top 3 most upregulated and downregulated miRNAs in HCC cell lines were determined. Finally, we evaluated miR-494-3p and miR-126-3p on invasion and migration of HCC cell lines. The aim of present study is to explore and identify invasion-metastasis-associated miRNAs and their poten-tial molecular mechanisms based on comprehensive bio-informatic analysis and related experimental validation.
<b>MiRNA microarray</b>
In the discovery step, we only included datasets that compared the miRNA expression in invasive/metastatic HCC cell or tissue with non-invasive/metastatic HCC cell or tissue. Besides, only datasets containing more than twenty samples were included. The titles and abstracts of these datasets were screened, and the full information of the datasets of interest were further evaluated. Finally, only GSE67140 dataset was selected to further study. The dataset GSE67140 based on the platform of GPL8786 (Affymetrix Multispecies miRNA-a Array) contained 91 human HCC tumor samples without vascular invasion and 81 samples with vascular invasion was downloaded from the National Center for Biotechnology Information (NCBI) GEO database (https ://www.ncbi.nlm.nih.gov/ geo).
<b>Screening for DE‑miRNAs</b>
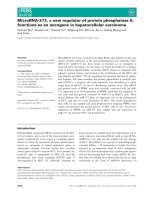
Data were normalized using the normalizeBetweenArray function from R package ‘LIMMA’ from the bioconduc-tor project [13]. Data before and after normalization were shown in Fig. 1a, b, respectively. The miRNA differential expression analysis was conducted using the limma soft-ware package in the Bioconductor package (http://www. bioco nduct or.org/). The related codes were put into R,
<b>Conclusions: Targeting miR-494-3p and miR-126-3p may provide effective and promising approaches to suppress </b>
invasion and metastasis of HCC.
<b>Keywords: Metastasis, Invasion, microRNA, Hepatocellular carcinoma, Bioinformatic analysis</b>
</div><span class="text_page_counter">Trang 3</span><div class="page_container" data-page="3">and the DE-miRNAs in HCC tumor samples with vas-cular invasion compared to HCC tumor samples without vascular invasion were analyzed through the limma
<i>pack-age. P-value < 0.05 and |fold change (FC)| > 2 were set as </i>
the thresholds for identifying DE-miRNAs.
<b>Prediction of target genes</b>
The potential target genes of the top three most upreg-ulated and downregupreg-ulated miRNAs were predicted by miRTarBase (http://mirta rbase .mbc.nctu.edu.tw/php/ index .php), which is an experimentally validated micro-RNA-target interactions database [14].
<b>GO and pathway analysis</b>
The database for annotation, visualization and integrated discovery (DAVID 6.8, http://david -d.ncifc rf.gov/) was introduced to perform functional annotation and path-way enrichment analysis for the predicted targets of the selected 6 DE-miRNAs, including GO and KEGG path-way analysis [15, 16<i>]. P-value < 0.05 was considered as </i>
statistically significant.
<b>PPI network and miRNA‑gene network construction</b>
PPI network and miRNA-gene network were succes-sively constructed. The target genes were first mapped to the STRING database (http://strin g-db.org) to assess functional associations among these target genes [17]. Only the interactions with a combined score > 0.4 were considered as significant. Next, to obtained the hub genes, the degree of connectivity in the PPI network was
analyzed by Cytoscape software (version 3.6.0), after which miRNA-hub gene network was established.
<b>Cell lines and clinical samples</b>
The human HCC cell lines HepG2, Bel-7402, HCCLM3 and SMMC7721 and normal cell line HL7702 were kindly provided by the First Affiliated Hospital of Medi-cal College, Zhejiang University (Hangzhou, China). HepG2, Bel-7402, HCCLM3 and HL7702 were cul-tured in Dulbecco’s modified Eagle’s medium (DMEM; Gibco,12430047) supplemented with 10% fetal bovine serum (FBS; Biological Industries, 04-0101-1, Cromwell, CT, USA) and SMMC7721 was maintained in Roswell Park Memorial Institute (RPMI) 1640 medium (Gibco, 31800105, Life Technologies, Carlsbad) containing 10% FBS under a humidified atmosphere of 5% CO<sub>2</sub> at 37 °C. HCC tumor tissues and matched noncancerous tissues were also obtained from the First Affiliated Hospital of Medical College, Zhejiang University (Hangzhou, China).
<b>Cell transfection</b>
The miRNA mimics and negative control (purchased from RiboBio, Guangzhou, China) were transfected into HCC cell lines using Lipofectamine<sup>™</sup> 3000 according to the manufacturer’s instruction.
<b>RNA extraction and quantitative‑PCR (qPCR)</b>
RNAiso plus Reagent (TaKaRa, Kusatsu, Japan) was introduced to extract total RNA from HCC cell lines and clinical samples. Subsequently, miRNAs reverse tran-scription primers and q-PCR primers were purchased
<b><small>Fig. 1 Normalization of GSE67140 data. a Data before normalization; b data after normalization</small></b>
</div><span class="text_page_counter">Trang 4</span><div class="page_container" data-page="4">from Ribobio Co. Ltd (Guangzhou, China). Q-PCR was performed in triplicates by SYBR Premix Ex Taq (TaKaRa, RR420A). The U6 small nuclear RNA was used as the internal control. The 2<small>−ΔΔCT</small> method was utilized to determine fold change in the RNA level of each sample compared with the reference sample.
<b>The Cancer Genome Atlas database</b>
The expression levels of miR-494-3p and miR-126-3p in HCC tissue from the Cancer Genome Atlas (TCGA) database (https ://genom e-cance r.ucsc.edu/) were deter-mined. Firstly, the miRNA-sequencing data in patients of liver cancer was downloaded from the database. Then, miR-494-3p and miR-126-3p expression values
<i>were extracted, after which unpaired Student’s t-test was </i>
employed to conduct statistical analysis between normal
<i>group and tumor group. A P-value < 0.05 was considered </i>
as significant.
<b>Wound healing assays</b>
Cells were plated in six-well plates with 1 × 10<small>5</small> cells per well. After transfection (50 nM), the cells were grown to 100% confluence in six-well plates. Then, a micropipette tip was applied to make a cross wound. Photographs were taken by a microscopy immediately or 24 h after wounding.
<b>Transwell assay</b>
The cell invasion assay was performed using 24-well tran-swell chambers (Corning, USA). Firstly, the inserts were coated with Matrigel (BD Bioscience, USA) on the upper surface. After transfection (50 nM), 1 × 10<small>5</small> cells were suspended in 0.2 ml serum-free medium and added to the inserts. 0.6 ml medium with 20% FBS was added to the lower compartment as a chemoattractant. After incu-bation at 37 °C for 48 h, the cells on the upper surface of the membrane were carefully removed using a cotton bud and cells on the lower surface were successively fixed with 100% methanol and stained with 0.1% crystal vio-let. Five visual fields of 200× magnification of each insert were randomly selected and counted under a light micro-scope (Olympus, Japan).
<b>Analysis of target gene expression using UALCAN database</b>
UALCAN, a portal for facilitating tumor subgroup gene expression and survival analyses, provides easy access to publicly available cancer transcriptome data includ-ing TCGA [18]. The database was utilized to analyze the expression levels of potential targets of miR-494-3p and miR-126-3p between normal tissue and tumor tissue. In brief, gene symbols were firstly pasted in the text area, and liver hepatocellular carcinoma dataset was chosen. Then, the expression information of each target gene
could be acquired by linking to gene expression analysis result. Statistical analysis of comparison between nor-mal group and tumor group was performed and log-rank
<i>P-value was observed in the database.</i>
<b>Survival data from Kaplan–Meier plotter</b>
The prognostic values of miR-494-3p and miR-126-3p in HCC were analyzed using Kaplan–Meier plotter (KM plotter) database [19]. In brief, the two miRNAs were entered into the database, after which Kaplan–Meier survival plots were generated and hazard ratio (HR), 95%
<i>confidence intervals (CI), log rank P-value were displayed on the webpage. P-value of < 0.05 was regarded as </i>
statis-tically significant.
<b>Statistical analysis</b>
The results were shown as mean ± SD. Differences between two groups were estimated using unpaired
<i>Stu-dent’s t-test. A two-tailed value of P < 0.05 was </i>
consid-ered as statistically significant.
<b>Identification of DE‑miRNAs and their target genes</b>
To identify DE-miRNAs of miRNA array GSE67140 downloaded from GEO, we conducted a differential expression analysis using limma software package. Based on this analysis, a total of 138 miRNAs were found to be significantly differentially expressed in HCC tumor samples with vascular invasion more than two-fold when compared to HCC tumor samples without vas-cular invasion, including 57 upregulated and 81 down-regulated miRNAs. For better visualization, the top ten most upregulated miRNAs and top ten most down-regulated miRNAs were presented in Tables 1 and 2
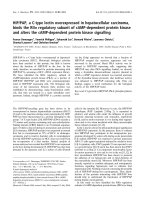
respectively. According to fold change (FC), miR-494-3p, miR-1207-5p and miR-1268a were the top three most upregulated miRNAs; and miR-126-3p, miR-199a-3p and miR-199b-3p were the top three most downregu-lated miRNAs. 485 potential target genes were predicted for the three upregulated miRNAs and 277 genes for the three downregulated miRNAs by using miRTarBase. A volcano plot of these DE-miRNAs was provided in Fig. 2.
<b>GO functional enrichment analysis</b>
Three categories of GO functional annotation analysis were performed on these potential target genes men-tioned above, including biological process (BP), cellu-lar component (CC) and molecucellu-lar function (MF). As shown in Fig. 3a1–a3, the enriched GO functions for target genes of the three upregulated miRNAs included the regulation of transcription, transcription, regulation of programmed cell death, regulation of cell death and regulation of apoptosis in the BP category; intracellular
</div><span class="text_page_counter">Trang 5</span><div class="page_container" data-page="5">bounded organelle, non-membrane-bounded organelle, membrane-enclosed lumen, organelle lumen and intracellular organelle lumen in the CC cat-egory; and DNA binding, transcription regulator activity, transcription factor binding, RNA binding and sequence-specific DNA binding in the MF category. The enriched GO functions for target genes of the three downregu-lated miRNAs were presented in Fig. 3b1–b3, involving the regulation of transcription, regulation of RNA meta-bolic process, positive regulation of cellular biosynthetic process, positive regulation of macromolecule meta-bolic process and phosphorylation in the BP category; membrane-enclosed lumen, organelle lumen, intracel-lular organelle lumen, nuclear lumen and cytosol in the CC category; and transcription regulator activity, adenyl ribonucleotide binding, ATP binding, purine nucleoside binding and nucleoside binding in the MF category.
<b>KEGG pathway enrichment analysis</b>
To further analyze the enriched pathways of these tar-get genes, we subsequently conducted KEGG pathway enrichment analysis. For upregulated miRNAs (Fig. 4a),
the enriched KEGG pathways contained pathways in cancer, focal adhesion, glioma, neurotrophin signaling pathway and insulin signaling pathway. And the enriched KEGG pathways for downregulated miRNAs (Fig. 4b) included pathways in cancer, focal adhesion, MAPK signaling pathway, neurotrophin signaling pathway and chemokine signaling pathway. Interestingly, both tar-get genes of upregulated miRNAs and tartar-gets of down-regulated miRNAs were enriched in the process, focal adhesion. Accumulating evidence has demonstrated that dysregulation of focal adhesion plays a central role in cell invasion and migration [20]. Therefore, 17 genes
<i>(PRKCA, HRAS, TLN1, MAP2K1, PPP1CC, PTEN, </i>
<i>AKT1, VEGFB, MAPK1, IGF1R, CCND1, ARHGAP5, BCL2, RAC1, PPP1R12A, RAP1A, RAP1B) of upregulated </i>
<i>miRNAs and 21 genes (PIK3CG, CAV2, FLT1, ROCK1, </i>
<i>MET, IGF1, ITGA3, HGF, KDR, AKT1, MAPK1, CRKL, PAK4, BCL2, VEGFA, MAPK9, MAPK8, CRK, PIK3R1, AKT2, PIK3R2) of downregulated miRNAs which are </i>
involved in focal adhesion may interact with the selected 6 miRNAs, thereby modulating invasion and metastasis in HCC.
<b>Table 1 Top ten upregulated differentially expressed miRNAs between HCC tumor with vascular invasion and without vascular invasion</b>
<b>Table 2 Top ten downregulated differentially expressed miRNAs between HCC tumor with vascular invasion and without vascular invasion</b>
<small>hsa-miR-199a-3p− 3.492737.052915− 13.33992.38E−282.88E−2653.79083hsa-miR-199b-3p− 3.465257.057111− 13.07891.33E−271.13E−2552.08226</small>
<small>hsa-miR-146b-5p− 2.811796.432729− 10.10733.72E−191.17E−1732.81846</small>
</div><span class="text_page_counter">Trang 6</span><div class="page_container" data-page="6"><b>Construction and analysis of PPI network and miRNA‑hub gene network</b>
The PPI networks of target genes of the six selected DE-miRNAs were constructed using the STRING database. Data from this database revealed that lots of these target genes could interact with each other. The top ten hub genes listed in Table 3 were screened out according to the node degree. For the upregulated miRNAs, the hub genes
<i>were TP53, AKT1, MAPK1, MYC, BCL2, HRAS, PTEN, </i>
<i>CALM3, CDKN1A, CYCS. For the downregulated </i>
<i>miR-NAs, the hub genes were MYC, AKT1, VEGFA, MAPK8, </i>
<i>PIK3CG, BCL2, FGF2, KRAS, PIK3R1, SIRT1. Among </i>
<i>these genes, TP53 and MYC demonstrated the highest </i>
node degrees, which were 80 and 42, respectively. The
<i>results suggest that TP53 and MYC may be two key </i>
tar-gets correlated with HCC invasion and metastasis. Subsequently, the miRNA-hub gene network was con-structed by cytoscape software as showed in Fig. 5. From Fig. 5<i>a, we found that six (CYCS, MYC, AKT1, MAPK1, </i>
<i>BCL2 and PTEN) in ten hub genes could be potentially </i>
modulated by upregulated miR-494-3p. 4 hub genes and 2 hub genes could be potentially regulated by 1207-5p and 1268a, respectively. Additionally,
<i>miR-126-3p could potentially target nine (PIK3R1, PIK3CG, </i>
<i>SIRT1, BCL2, AKT1, MAPK8, VEGFA, KRAS and MYC) </i>
in ten hub genes. And 4 hub genes and 1 hub gene could be potentially modulated by 199a-3p and miR-199b-3p. These data supported that miR-494-3p and
miR-126-3p might be two potential regulators of invasion and metastasis in HCC.
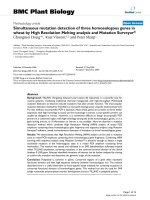
Next, we further evaluated the expression of potential targets of miR-494-3p and miR-126-3p in HCC using the UALCAN database as shown in Fig. 6. The analytic
<i>results suggested that the expression of five (CYCS, </i>
<i>MAPK1, PTEN, AKT1, BCL2) in six targets of miR-494 </i>
was significantly upregulated in HCC tissue than
<i>nor-mal tissue whereas MYC gene was markedly </i>
downregu-lated. It is widely acknowledged that there is an inverse relationship between miRNA expression and target gene expression. Thus, among these detected genes, the
<i>sig-nificantly downregulated MYC may be the most potential </i>
target for the upregulated miR-494-3p. Similarly, these
<i>significantly upregulated genes including AKT1, BCL2, </i>
<i>MAPK8, VEGFA and KRAS may be the most potential </i>
targets for the downregulated miR-126-3p in theory.
<b>Aberrant expression and prognostic roles of miR‑494‑3p and miR‑126‑3p in HCC</b>
Based on our previous findings, we intended to further determine the expression and prognostic roles of miR-494-3p and miR-126-3p in HCC. Firstly, we evaluated the expression of miR-494-3p and miR-126-3p in four HCC cell lines (HepG2, Bel7402, SMMC7721 and HCCLM3) compared with that in normal liver cell line (HL7702). The results presented in Fig. 7a, d demonstrated that miR-494-3p expression was markedly upregulated and miR-126-3p expression were significantly downregu-lated in all four HCC cell lines. Of note, expression of miR-494-3p and miR-126-3p in HCCLM3 is the most upregulated and downregulated compared with other three cell lines. HCCLM3 is a high metastatic HCC cell [21], further suggesting miR-494-3p and miR-126-3p may regulate HCC metastasis. The expression of miR-1207-5p, miR-1268a, miR-199a-3p and miR-199b-3p in HCC cell lines was also detected (Additional file 1 : Fig-ure S1). However, the expression of them was only sig-nificantly dysregulated in one or two HCC cell lines as shown in Additional file 1 : Figure S1. To some extent, the result hinted that the functional roles of miR-1207-5p, miR-1268a, miR-199a-3p and miR-199b-3p in HCC may be not as good as miR-494-3p and miR-126-3p. Besides, miR-494-3p and miR-126-3p expression in 70 pairs of clinical tumor and normal samples also demonstrated a higher expression of miR-494-3p and a lower expres-sion of miR-126-3p in HCC tissues than normal tissues (Fig. 7c, f), further hinting promoting and suppressive roles of miR-494-3p and miR-126-3p in HCC, respec-tively. Moreover, for miR-126-3p, similar results were obtained by downloading and analyzing HCC data from the Cancer Genome Atlas (TCGA) (Fig. 7e). However, for miR-494-3p, there was no significant difference between
<b><small>Fig. 2 Volcano plot of the DE-miRNAs. The black dots represent </small></b>
<small>miRNAs that are not differentially expressed between 91 human HCC tumor samples without vascular invasion and 81 samples with vascular invasion, and the red dots and green dots represent the upregulated and downregulated miRNAs in HCC tumor samples with vascular invasion, respectively</small>
</div><span class="text_page_counter">Trang 7</span><div class="page_container" data-page="7">tumor tissue and normal tissue (Fig. 7b). To summarize, miR-494-3p was upregulated and miR-126-3p was down-regulated in HCC, suggesting that they may play a major role in the onset and progression of HCC, especially in HCC invasion and metastasis.
KM plotter database was utilized to assess the prognos-tic values of the two potential miRNAs, miR-494-3p and
miR-126-3p in HCC. As shown in Fig. 7g, high expres-sion of miR-494-3p was significantly correlated with worse OS, further implying that miR-494-3p is an onco-gene in HCC. Figure 7h indicated a favorable prognostic role of miR-126-3p in HCC. In short, all these findings suggest that miR-494-3p and miR-126-3p are aberrantly expressed in HCC and can serve as two prognostic
<b><small>Fig. 3 GO functions for the target genes of top three upregulated miRNAs and top three downregulated miRNAs. a1 Enriched biological process of the upregulated miRNAs; a2 enriched cellular component of the upregulated miRNAs; a3 enriched molecular function of the upregulated miRNAs; b1 enriched biological process of the downregulated miRNAs; b2 enriched cellular component of the downregulated miRNAs; b3 enriched </small></b>
<small>molecular function of the downregulated miRNAs</small>
</div><span class="text_page_counter">Trang 8</span><div class="page_container" data-page="8"><b><small>Fig. 4 KEGG pathway enrichment analysis of target genes of six selected DE-miRNAs. a For upregulated miRNAs; b for downregulated miRNAs. </small></b>
<i><small>Only the enriched pathways with P-value < 0.001 were presented. The red lines represent count and the blue lines represent − log</small></i><small>10(P-value)</small>
</div><span class="text_page_counter">Trang 9</span><div class="page_container" data-page="9">biomarkers. Therefore, the two miRNAs, miR-494-3p and miR-126-3p were selected for further experimental excavation and research.
<b>In vitro effects of miR‑494‑3p and miR‑126‑3p on HCC migration and invasion</b>
In the first place, miR-494-3p and miR-126-3p expression in HepG2 and HCCLM3 after transfected with miRNA mimics at final concentrations of 20, 50 and 100 nM
were detected using qPCR (Additional file 2 : Figure S2). To determine the roles of miR-494-3p and miR-126-3p in HCC migration, we first performed a wound healing assay. As shown in Fig. 8, wound healing assay suggested that miR-494-3p overexpression markedly enhanced HepG2 and HCCLM3 migration whereas overexpression of miR-126-3p could significantly attenuate cell migra-tion, when compared with negative control cells. Next, a transwell invasion assay was employed to measure the effects of miR-494-3p and miR-126-3p on HCC invasion. The results presented in Fig. 9 demonstrated that upregu-lation of miR-494-3p and miR-126-3p could evidently boost and suppress cell invasion, respectively. All these data confirmed that miR-494-3p and miR-126-3p were two key regulators of HCC invasion and metastasis. Tar-geting miR-494-3p and miR-126-3p may represent novel approaches in treating HCC patients with vascular inva-sion or/and distant metastasis, thus improving the prog-nosis of patients with HCC.
HCC, a high heterogeneous malignancy, which progno-sis is extremely dismal, mainly attributing to its tendency to invade and metastasize. To date, effective therapeutic strategies against invasive or/and metastatic HCC is still rare. Therefore, it is imperative need to seek and develop
<b>Table 3 Hub genes identified in the PPI interaction</b>
<i><small>PPI protein–protein interaction</small></i>
</div><span class="text_page_counter">Trang 10</span><div class="page_container" data-page="10">a promising therapeutic target to improve the survival of patients with advanced HCC.
MiRNAs are a group of small, endogenous non-coding RNAs which possess a variety of biological functions, including modulating cell metabolism and cell survival [22, 23]. Recent studies showed that miRNA is involved in HCC invasion and metastasis by post-transcriptionally regulating gene expression. For example, the team of Liao CG found that miR-10b promotes migration and invasion of HCC via direct repression of RhoC, uPAR and MMPs [24]. In addition, Yang et al. [25] suggested that miR-34a
is involved in Treg cell recruitment and promotes venous metastases of HBV-positive hepatocellular carcinoma. However, systemic analysis of miRNA’s roles in HCC invasion and metastasis remain absent.
In this study, we discovered some invasion-metastasis-associated miRNAs by performing a differential expres-sion analysis on a microRNA array downloaded from GEO datasets. According to node degree, top ten hub genes of three upregulated miRNAs and three down-regulated miRNAs were screened out. By constructing miRNA-gene network, we found that most of hub genes
<i><b><small>Fig. 6 The mRNA expression of predicted targets of miR-494-3p and miR-126-3p from the UALCAN database. a CYCS expression; b MAPK1 expression; c PTEN expression; d AKT1 expression; e BCL2 expression; f MYC expression; g MAPK8 expression; h VEGFA expression; i KRAS expression; j </small></b></i>
<i><b><small>PIK3CG expression; k PIK3R1 expression; l SIRT1 expression</small></b></i>
</div>