báo cáo khoa học: " Simultaneous mutation detection of three homoeologous genes in wheat by High Resolution Melting analysis and Mutation Surveyor®" pot
Bạn đang xem bản rút gọn của tài liệu. Xem và tải ngay bản đầy đủ của tài liệu tại đây (661.55 KB, 12 trang )
BioMed Central
Page 1 of 12
(page number not for citation purposes)
BMC Plant Biology
Open Access
Methodology article
Simultaneous mutation detection of three homoeologous genes in
wheat by High Resolution Melting analysis and Mutation Surveyor
®
Chongmei Dong*
1
, Kate Vincent
1,2
and Peter Sharp
1
Address:
1
Plant Breeding Institute, University of Sydney, PMB 4011, Narellan NSW 2567, Australia and
2
Australian Centre for Plant Functional
Genomics, PMB 1, Glen Osmond SA 5064, Australia
Email: Chongmei Dong* - ; Kate Vincent - ;
Peter Sharp -
* Corresponding author
Abstract
Background: TILLING (Targeting Induced Local Lesions IN Genomes) is a powerful tool for
reverse genetics, combining traditional chemical mutagenesis with high-throughput PCR-based
mutation detection to discover induced mutations that alter protein function. The most popular
mutation detection method for TILLING is a mismatch cleavage assay using the endonuclease CelI.
For this method, locus-specific PCR is essential. Most wheat genes are present as three similar
sequences with high homology in exons and low homology in introns. Locus-specific primers can
usually be designed in introns. However, it is sometimes difficult to design locus-specific PCR
primers in a conserved region with high homology among the three homoeologous genes, or in a
gene lacking introns, or if information on introns is not available. Here we describe a mutation
detection method which combines High Resolution Melting (HRM) analysis of mixed PCR
amplicons containing three homoeologous gene fragments and sequence analysis using Mutation
Surveyor
®
software, aimed at simultaneous detection of mutations in three homoeologous genes.
Results: We demonstrate that High Resolution Melting (HRM) analysis can be used in mutation
scans in mixed PCR amplicons containing three homoeologous gene fragments. Combining HRM
scanning with sequence analysis using Mutation Surveyor
®
is sensitive enough to detect a single
nucleotide mutation in the heterozygous state in a mixed PCR amplicon containing three
homoeoloci. The method was tested and validated in an EMS (ethylmethane sulfonate)-treated
wheat TILLING population, screening mutations in the carboxyl terminal domain of the Starch
Synthase II (SSII) gene. Selected identified mutations of interest can be further analysed by cloning
to confirm the mutation and determine the genomic origin of the mutation.
Conclusion: Polyploidy is common in plants. Conserved regions of a gene often represent
functional domains and have high sequence similarity between homoeologous loci. The method
described here is a useful alternative to locus-specific based methods for screening mutations in
conserved functional domains of homoeologous genes. This method can also be used for SNP
(single nucleotide polymorphism) marker development and eco-TILLING in polyploid species.
Published: 4 December 2009
BMC Plant Biology 2009, 9:143 doi:10.1186/1471-2229-9-143
Received: 21 May 2009
Accepted: 4 December 2009
This article is available from: />© 2009 Dong et al; licensee BioMed Central Ltd.
This is an Open Access article distributed under the terms of the Creative Commons Attribution License ( />),
which permits unrestricted use, distribution, and reproduction in any medium, provided the original work is properly cited.
BMC Plant Biology 2009, 9:143 />Page 2 of 12
(page number not for citation purposes)
Background
Detection of SNPs in genes of interest, whether induced or
endogenous, is a powerful tool to explore gene function
and to identify desired mutations for breeding. TILLING
has proven to be a valuable methodology for reverse
genetics, combining traditional chemical mutagenesis
with high-throughput PCR-based mutation detection. As
a post-genomics tool, TILLING is not only useful for func-
tional genomics [1], but is also effective for crop improve-
ment [2]. TILLING produces a large chemically
mutagenized population with random mutations across
the genome, so that an efficient mutation detection
method is essential. SNP discovery methods used in TILL-
ING include full sequencing [3], denaturing high-pressure
liquid chromatography (dHPLC) [4] and heteroduplex
mismatch cleavage assay using endonuclease CelI fol-
lowed by sequencing [5]. Among these, the mismatch
cleavage assay has high sensitivity in pooled samples, and
is therefore high-throughput and low cost. Other muta-
tion scanning methods such as single-strand conforma-
tional polymorphism (SSCP) [6], denaturing gradient gel
electrophoresis (DGGE) [7] and technologies such as
pyrosequencing [8] and mass spectrometry (MS) [9] have
advantages and disadvantages regarding sensitivity,
throughput, cost and simplicity. Heteroduplex mismatch
cleavage assay works in any PCR amplicon (usually 0.5-
1.5 kb) and any sequence context. The only requirement
for heteroduplex assay is the purity of a PCR product.
Therefore, PCR reactions for heteroduplex assay are per-
formed using gene-specific primers at high stringency.
However, these conditions are sometime difficult to
achieve when TILLING a polyploid species. For TILLING
in soybean, a recent allotetraploid species [10], a restric-
tion enzyme digestion of the genomic DNA before PCR
was added to the method in an attempt to reduce the
homoeologous complexity [11], but this method would
not work without a locus-specific restriction site.
Bread wheat (Triticum aestivum) is an allohexaploid spe-
cies with three closely related genomes. Most wheat genes
are present as three similar sequences of homoeologous
loci with high exonic homology and lower homology in
introns. Locus-specific primers can usually be designed in
intron regions, as shown in wheat waxy genes [2]. How-
ever, some wheat genes have high homology among the
three homoeologous loci even in introns, so that locus-
specific PCR is not easily achievable. Here we report a new
method using High Resolution Melting (HRM) analysis
and Mutation Surveyor
®
to screen mutations in the car-
boxyl terminal domain of the Starch Synthase II (SSII)
gene allowing simultaneous screening of the three
homoeologous loci. Conserved regions of a gene which
can be identified from multiple sequence alignment of a
large number of divergent orthologous genes are believed
to have high functional significance http://
pfam.sanger.ac.uk/. Mutations in these conserved
sequences will have a high likelihood of being deleteri-
ous, which is often the purpose of TILLING. For effectively
screening mutations in the conserved regions, where
locus-specific primers are not easy to obtain, we devel-
oped this method allowing simultaneous mutation detec-
tion in a functional domain of all three homoeologous
genes in hexaploid wheat.
HRM analysis is an extension of previous DNA melting
(dissociation) analysis enabled by the new generation of
fluorescent dsDNA dyes [12]. These dyes, such as LCGreen
and CYTO
®
9, have low toxicity to PCR and can therefore
be used at high concentration to saturate the dsDNA PCR
product. Greater dye saturation means there is less
dynamic dye redistribution to non-denatured regions of
nucleic strands during melting so that the measured fluo-
rescent signals have higher fidelity [12,13]. The combina-
tion of these characteristics provides greater melt
sensitivity and higher resolution melt profiles making it
possible to detect SNPs in PCR amplicons, even in
somatic mutations and methylations [14-18]. Mutation
Surveyor
®
(SoftGenetics, State College, PA, USA) is a com-
mercially available software for DNA variation analysis
that allows automatic mutation detection in sequence
traces. Mutation Surveyor
®
is claimed to detect > 99% of
mutations, with sensitivity to the mutant allele extending
down to 5% of the primary peak (mosaic or somatic
mutations) provided the sequence quality meets a mini-
mum Phred score of 20. The method presented here was
tested and validated in an EMS (ethylmethane sulfonate)-
treated wheat TILLING population [19], targeting the SSII
genes.
Rsults
Mutation Surveyor
®
can detect heterozygous mutations in
an ampilcon containing three homoeoloci
Chemically treated TILLING populations contain single-
nucleotide changes in the genome. To detect such induced
mutations in a PCR reaction end-point containing frag-
ments of three homoeoloci in wheat means the software
should be sensitive enough to detect a 1:5 ratio of
mutant:background signal in the case of a heterozygous
mutation. To test the software sensitivity, a previously
identified heterozygous mutant (G1642A in Wx-D1) was
used to mix with non-mutant DNA to form mutant:non-
mutant ratios of 1:0, 1:1, 1:2, 1:3, 1:4 and 1:5 so that the
mutant allele fractions in the pooled DNA were 1/2, 1/4,
1/6, 1/8, 1/10 and 1/12. These six samples were used to
amplify the Wx7D3 fragment [2] and sequenced in both
directions. The sequence data were analyzed with Muta-
tion Surveyor
®
software set to check bi-directional (2D)
small peaks. Due to the nature of sequencing, artefact
peaks may appear as real data. However, artefact sequenc-
ing peaks rarely occur at the same position in both for-
BMC Plant Biology 2009, 9:143 />Page 3 of 12
(page number not for citation purposes)
ward and reverse directions. Using the 2D setting of the
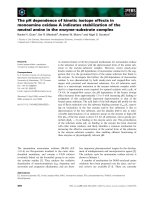
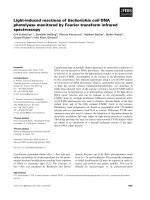
software increases the sensitivity and accuracy. Figure 1
shows that the software is able to detect the known muta-
tion in up to a 1/10 dilution. Table 1 shows the Mutation
Surveyor
®
report indicating the mutation position and
score. The mutation score is used by the software to call a
mutation and rank its confidence level. It is a measure of
the probability of error and is based on the ratios of noise
level, the overlapping factor and the dropping factor used
by the software. The first two samples (1/2 and 1/4
mutant allele) had mutation scores from 9 to 43; other
samples had a score of 7 (Table 1). These scores may be
used as an indication of the possible zygosity status of a
mutant. Due to the nature of sequencing, however, peak
heights may be quite variable so it is important that both
directions are examined when the mutation score is used
as an indication of the zygosity. To test if the software is
able to detect a heterozygous mutation in an amplicon
containing three homoeoloci of wheat, a SSII gene frag-
ment was screened for SNP mutations in a TILLING pop-
ulation.
The wheat SSII genes/homoeoloci (GenBank accessions
AB201445
, AB201446 and AB201447) are each approxi-
mately 7 kb, have eight exons, and share more than 96%
identity [20]. By analysis of the gene sequence with COD-
DLE (for Codons Optimized to Detect Deleterious
Lesions; />), we identify
that the last exon contains catalytic domains. This car-
boxyl terminal is long (957 bp) and very conserved
among the three homoeoloci. It was chosen for mutation
detection in this study due to the high probability that
missense mutations in this exon will have deleterious
effects on the enzyme activity, and it has a large number
of TGG and CAG codons that can mutate to premature
stop codons (Figure 2). The partial exon was PCR ampli-
fied using primers ABDF6 and ABDR9 (Figure 2) in 192
TILLING lines. PCR products were purified and sequenced
in both directions, and then analyzed by Mutation Sur-
veyor
®
Software. The initial analysis identified 26 mutants
(Additional file 1). An example of a mutant sequence trace
analyzed by the software is shown in Figure 3. If these 26
mutants in this 532 bp fragment are all true mutants, then
the mutation frequency (26/532 × 3 × 192 bp) was about
1 in 12 kb, which is very high compared to the frequency
of about 1 in 24 kb from the screening of waxy gene [19]
and other genes (unpublished data) in the same popula-
tion. It is possible that some false positives are included in
this initial analysis. These 26 mutations were re-examined
with Mutation Surveyor
®
, and the mutation call thresh-
olds were set to accept the mutation when the mutation
height is near or above 500 and the background noise in
surrounding base pairs is zero. With these more stringent
criteria, some of the mutants were identified as possible
false positive mutants. In the following HRM analysis,
some were confirmed as false positives. Table 2 lists the
mutants identified and confirmed by HRM analysis.
Among these 17 mutants, five had a mutation score equal
or greater than 10, indicating a possible homozygous
mutation. Others had scores of seven, possibly heterozy-
gotes. The apparent percentage of homozygotes (29.4%)
is similar to previous findings [19].
Table 1: The mutation report of Mutation Surveyor
®
after sequence trace analysis of mutant/non-mutant mixed samples.
Mutant allele in pooled DNA Sample File Reference File Direction Mutation * Score
1/2 B11F_D01.ab1 Q7D3_F_G08.ab1 Forward (352)G>GA$20 20
1/2 B11R_C01.ab1 Q7D3_R_G09.ab1 Reverse (392)G>GA$43 43
1/4 B21F_D02.ab1 Q7D3_F_G08.ab1 Forward (352)G>GA$9 9
1/4 B21R_C02.ab1 Q7D3_R_G09.ab1 Reverse (392)G>GA$16 16
1/6 B31F_D03.ab1 Q7D3_F_G08.ab1 Forward (352)G>AG$7 7
1/6 B31R_C03.ab1 Q7D3_R_G09.ab1 Reverse (392)G>AG$7 7
1/8 B41F_D04.ab1 Q7D3_F_G08.ab1 Forward (352)G>AG$7 7
1/8 B41R_C04.ab1 Q7D3_R_G09.ab1 Reverse (392)G>AG$7 7
1/10 B51F_D05.ab1 Q7D3_F_G08.ab1 Forward (352)G>AG$7 7
1/10 B51R_C05.ab1 Q7D3_R_G09.ab1 Reverse (392)G>AG$7 7
1/12 B61F_D06.ab1 Q7D3_F_G08.ab1 Forward n.a. n.a.
1/12 B61R_C06.ab1 Q7D3_R_G09.ab1 Reverse n.a. n.a.
*Mutation report indicates the position (in brackets), the base change (G>GA) and the score (the number after the $ sign).
BMC Plant Biology 2009, 9:143 />Page 4 of 12
(page number not for citation purposes)
High Resolution Melting (HRM) analysis of the SSII
mutants
To test the sensitivity of HRM in scanning for SNPs in
mixed PCR fragments, a number of primer pairs were
designed to have amplicon sizes between 100 to 250 bp
in the ABD6-9 fragment. Three primer pairs were chosen
due to their good amplification levels and distinctive
melting peaks in the derivative plot; ABDF6 and ABDR1
for amplicon ABD6-1, ABDF12 and ABDR22 for ampli-
con ABD12-22, and ABDF2 and ABDR9 for amplicon
ABD2-9 (Figure 2). Mutants No3 to No10 (Table 2) along
with two non-mutant samples were analysed by HRM
using ABDF6 and ABDR1 as primers. Each reaction was
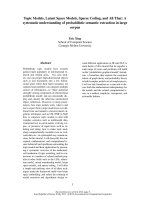
duplicated. Figure 4 shows the normalized melting curve,
difference plot and derivative melting curve of ABD6-1. In
the derivative melting curve (Figure 4C), three melting
peaks were detected in non-mutants, indicating dynamic
melting behavior of the ABD6-1 fragment, possibly due to
its high GC content, secondary structures and intrinsic
SNPs among the three loci. Despite the complex melting
behavior, all mutants tested had shifts in melting peaks
from that of the non-mutant. The normalized melting
curve (Figure 4A) and the difference plot (Figure 4B) also
show that the melting curve shape and the signal differ-
ence of the mutants was distinctive from those of the non-
mutant. HRM analysis is able to detect mutations in
mixed PCR fragments containing other SNPs (among the
homoeologous loci). The high sensitivity of HRM to
detect SNPs in a complex genome such as wheat should
allow the use of this method for scanning mutations in a
TILLING population before sequencing. Amplicons
ABD12-22 and ABD2-9 were also analyzed by HRM using
mutants listed in Table 2 and Additional file 1. Both
amplicons are suitable for HRM analysis and mutants had
peaks shifted towards a lower temperature (Additional
files 2 and 3). It is known that a change from C to T, or G
to A will lower melting temperature.
Detecting unknown mutations using HRM and Mutation
Surveyor
®
analysis
Discovering unknown mutations is a more challenging
task than determining the presence of known lesions. To
test if HRM is sensitive enough to detect rare unknown
mutations in a large population in which most samples
are non-mutant, 32 samples were random chosen from
the 192 samples previously sequenced, and HRM ana-
lysed in a blind fashion with amplicon ABD6-1. In this
assay, five samples with abnormal melting were discov-
ered (Figure 5) and sequence analyses showed they were
mutants. Another three samples had small differences in
melting behavior compared to that of non-mutant, but
they were not mutants as determined by sequence analy-
ses. Other samples with normal melting were confirmed
by sequence data as non-mutant. Therefore, 100% of the
mutations were detected.
For TILLING, a large population is needed for finding use-
ful mutants, so the mutation scanning method has to be
high-throughput. To use HRM analysis in a high-through-
put fashion, an assay to detect mutations in amplicons
ABD6-1, ABD12-22 and ABD2-9 in 140 blind unknown
samples was conducted. At the same time, fragment
ABD6-9 of these 140 samples were sequenced, and the
sequence traces were analysed with Mutation Surveyor
®
using stringent criteria. Results of the two independent
assays are compared in Table 3. From HRM analysis of
ABD6-1, 15 samples with aberrant melting were identi-
fied. Sequence analysis of these 140 samples with Muta-
tion Surveyor
®
identified eight mutants in the ABD6-1
region with seven detected by HRM analysis and one not
detected by HRM of ABD6-1, but detected by HRM of
ABD12-22. HRM on fragment ABD12-22 had better sensi-
tivity (100%, Table 3) in detecting unknown mutations
compared to ABD6-1 and ABD2-9, assuming that Muta-
tion Surveyor
®
analyses are 100% correct. All three frag-
ments had some false positives in HRM analysis, ranging
from 2.8% to 7.1%.
Progeny testing and cloning
From 140 samples screened in the ABD6-9 fragment by
HRM and sequencing, two mutants were found to have
Mutation Surveyor
®
software detects a mutant allele in pooled DNAFigure 1
Mutation Surveyor
®
software detects a mutant allele
in pooled DNA. Sequence traces (forward traces) from the
Graphical Analysis Display of Mutation Surveyor
®
are shown.
The arrow indicates a G to A mutation detected by Mutation
Surveyor
®
in mutant/non-mutant mixed samples with the
fraction of mutant allele in pooled DNA being 1/2, 1/4, 1/6, 1/
8, 1/10 and 1/12.
Mutant
ratio
1/2
1/4
1/6
1/8
1/10
1/12
BMC Plant Biology 2009, 9:143 />Page 5 of 12
(page number not for citation purposes)
nonsense mutations, one was 4A7 (C454T, Q641*) and
the other, 4D7 (G165A, W544*). Segregating M2 seeds of
these two lines were used in a progeny test. Twelve M2
seedlings of 4A7 and 10 M2 seedlings of 4D7 were ana-
lyzed by HRM and sequencing. The mutation in 4A7 is
located near the 3'-end of fragment ABD2-9. To increase
the sensitivity of HRM, fragment ABD3-9 was chosen for
HRM analysis. Figure 6A shows four samples with
mutant-like melting peaks. These four samples and one
chosen from non-mutant-like samples were sequenced
and it was revealed that the four samples were all mutants;
one being a possible homozygous mutant and other three
were heterozygous. The one showing non-mutant behav-
ior of melting was confirmed by sequence as non-mutant.
Figure 6B shows the ABD6-1 melting analysis of 4D7
progenies. Seven mutant-like curves were identified.
Sequence analysis confirmed two of the seven were
homozygous mutants and other five were heterozygous.
Two samples with non-mutant-like melting curves were
confirmed by sequence as non-mutant. Homozygous
mutants were determined by comparing the ratio of two
overlapping peaks with that of neighboring SNPs (intrin-
sic SNPs among three loci) and a mutation score greater
than seven as reported by Mutation Surveyor
®
.
PCR products ABD3-9 (for 4A7) and ABD6-1 (for 4D7)
amplified from homozygous progeny of 4A7 and 4D7
were cloned with the pGEM
®
-T Easy vector. From eight
sequenced clones of 4A7, two had the mutation and the
sequence belonged to the A genome. The other six clones
Table 2: 17 mutations are identified in 192 TILLING lines in ABD6-9 after Mutation Surveyor
®
analysis of sequence traces and
confirmation by HRM analysis.
No Sample Mutation Surveyor
report
Position in ABD6-
9
Position in Gene
(SSII-A)
Codon change Amino acid
change
Mutation type
1 3D7 (16)C>CT$7* C34T C5999T cac/tac H501Y missense
2 1D3 (25)C>CT$10 C43T C6008T ctg/ttg L504L silent
3 3F10 (65)C>CT$7 C83T C6048T gcc/gtc A517V missense
4 1C8 (85)G>AG$7 G103A G6068A gac/aac D524N missense
5 1F10 (115)C>CT$7 C133T C6098T ctg/ttg L534L silent
6 1D8 (129)G>AG$7 G147A G6112A aag/aaa K538K silent
7 3E5 (129)G>AG$7 G147A G6112A aag/aaa K538K silent
8 3A8 (148)G>AG$7 G166A G6131A ggg/agg G545R missense
9 1D9 (151)C>CT$28 C169T C6134T ctt/ttt L546F missense
10 3A4 (159)C>CT$11 C177T C6142T gac/gat D548D silent
11 3H9 (187)C>CT$7 C205T C6170T cgc/tgc R558C missense
12 1D5 (300)G>AG$7 G318A G6283A cgg/cga R595R silent
13 3D8 (306)C>CT$7 C324T C6289T tgc/tgt C597C silent
14 3F6 (342)C>CT$7 C360T C6325T gtc/gtt V609V silent
15 1B2 (361)C>CT$13 C379T C6344T ctc/ttc L616F missense
16 3B7 (365)G>AG$7 G383A G6348A ggc/gac G617D missense
17 1E4 (387)G>AG$7 G405A G6370A ggg/gga G624G silent
*The reverse trace of this mutation had a score of 46.
BMC Plant Biology 2009, 9:143 />Page 6 of 12
(page number not for citation purposes)
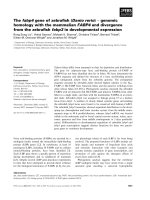
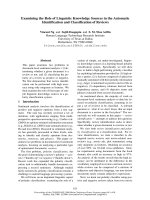
An alignment of three homoeologous sequences of SSIIFigure 2
An alignment of three homoeologous sequences of SSII. A gene fragment of SSII from primer ABDF6 to ABDR9 is
aligned to show three homoeologous loci with 17 SNPs (gray highlighting). The codons (CAG and TGG) which can mutate to
premature stop codons are indicated in boxes. Arrows indicate the positions of primers designed for PCR and HRM analysis.
The four primer pairs are: ABDF6 and ABDR1, ABDF12 and ABDR22, ABDF2 and ABDR9, and ABDF3 and ABDR9.
ABDF6
10 20 30 40 50 60
SSII-A CCGTTCACCG AGTTGCCTGA GCACTACCTG GAACACTTCA GACTGTACGA CCCCGTGGGT
SSII-B CCGTTCACCG AGTTGCCTGA GCACTACCTG GAACACTTCA GACTGTACGA CCCCGTGGGT
SSII-D CCGTTCACCG AGTTGCCTGA GCACTACCTG GAACACTTCA GACTGTACGA CCCCGTGGGT
70 80 90 100 110 120
SSII-A GGTGAGCACG CCAACTACTT CGCCGCCGGC CTGAAGATGG CGGACCAGGT TGTCGTGGTG
SSII-B GGTGAACACG CCAACTACTT CGCCGCCGGC CTGAAGATGG CGGACCAGGT TGTCGTCGTG
SSII-D GGTGAACACG CCAACTACTT CGCCGCCGGC CTGAAGATGG CGGACCAGGT TGTCGTGGTG
ABDF12
130
1
40 150 160 170 180
SSII-A AGCCCCGGGT ACCTGTGGGA GCTCAAGACG GTGGAGGGCG GCTGGGGGCT TCACGACATC
SSII-B AGCCCGGGGT ACCTGTGGGA GCTGAAGACG GTGGAGGGCG GCTGGGGGCT TCACGACATC
SSII-D AGCCCCGGGT ACCTGTGGGA GCTGAAGACG GTGGAGGGCG GCTGGGGGCT TCACGACATC
190 200 210 220 230 240
SSII-A ATACGGCAGA ACGACTGGAA GACCCGCGGC ATCGTCAACG GCATCGACAA CATGGAGTGG
SSII-B ATACGGCAGA ACGACTGGAA GACCCGCGGC ATCGTGAACG GCATCGACAA CATGGAGTGG
SSII-D ATACGGCAGA ACGACTGGAA GACCCGCGGC ATCGTCAACG GCATCGACAA CATGGAGTGG
ABDR1
250 260 270 280 290 300
SSII-A AACCCCGAGG TGGACGTCCA CCTCCAGTCG GACGGCTACA CCAACTTCTC CCTGAGCACG
SSII-B AACCCCGAGG TGGACGTCCA CCTCAAGTCG GACGGCTACA CCAACTTCTC CCTGGGGACG
SSII-D AACCCCGAGG TGGACGCCCA CCTCAAGTCG GACGGCTACA CCAACTTCTC CCTGAGGACG
ABDR22
ABDF2
310 320 330 340 350 360
SSII-A CTGGACTCCG GCAAGCGGCA GTGCAAGGAG GCCCTGCAGC GCGAGCTGGG CCTGCAGGTC
SSII-B CTGGACTCCG GCAAGCGGCA GTGCAAGGAG GCCCTGCAGC GGGAGCTGGG CCTGCAGGTC
SSII-D CTGGACTCCG GCAAGCGGCA GTGCAAGGAG GCCCTGCAGC GCGAGCTGGG CCTGCAGGTC
ABDF3
370 380 390 400 410 420
SSII-A CGCGCCGACG TGCCGCTGCT CGGCTTCATC GGCCGCCTGG ACGGGCAGAA GGGCGTGGAG
SSII-B CGCGGCGACG TGCCGCTGCT CGGCTTCATC GGGCGCCTGG ACGGGCAGAA GGGCGTGGAG
SSII-D CGCGCCGACG TGCCGCTGCT CGGCTTCATC GGCCGCCTGG ACGGGCAGAA GGGCGTGGAG
430 440 450 460 470 480
SSII-A ATCATCGCGG ACGCCATGCC CTGGATCGTG AGCCAGGACG TGCAGCTGGT CATGCTGGGC
SSII-B ATCATCGCGG ACGCGATGCC CTGGATCGTG AGCCAGGACG TGCAGCTGGT CATGCTGGGC
SSII-D ATCATCGCGG ACGCCATGCC CTGGATCGTG AGCCAGGACG TGCAGCTGGT GATGCTGGGC
490 500 510 520 530
SSII-A ACCGGCCGCC ACGACCTGGA GAGCATGCTG CGGCACTTCG AGCGGGAGCA CC
SSII-B ACCGGGCGCC ACGACCTGGA GGGCATGCTG CGGCACTTCG AGCGGGAGCA CC
SSII-D ACCGGGCGCC ACGACCTGGA GAGCATGCTG CAGCACTTCG AGCGGGAGCA CC
ABDR9
BMC Plant Biology 2009, 9:143 />Page 7 of 12
(page number not for citation purposes)
were either B genome or D genome lacking the mutation.
From seven sequenced clones of 4D7, one had the muta-
tion which was in the A genome. The other six clones were
either B genome or D genome lacking the mutation. The
locations of both mutations were therefore identified.
Discussion
TILLING is a reverse genetics tool for studying gene func-
tion. The most desirable mutations in TILLING are those
causing complete or partial inactivation of the targeted
gene product. Screening mutations in a conserved region
or functional domain will increase the efficiency and
speed for finding such deleterious mutants. The method
described in this report is suitable for screening a func-
tional domain of a gene in a polyploid species such as
wheat. In plants, polyploidy is very common and many
crops are polyploid, e.g. wheat, oats, potato, cotton [10].
TILLING in polyploids, especially autopolyploids can
cause complications in mismatch cleavage assays [11].
HRM scanning can be an alternative choice. Although
amplicons for HRM analysis are shorter than that used in
mismatch cleavage assay, HRM is a closed-tube, low cost
and fast assay; no digestion and gel separation steps are
required.
The bread wheat SSII gene is very conserved among three
homoeoloci, especially within the C-terminal domain.
The method presented here is effective in detecting muta-
tions in this region in a TILLING population although
false positives are detected by independent HRM analysis
or Mutation Surveyor
®
. It is important to use both assays
for confirming a mutation. False positives from HRM
analysis may be due to the presence of some non-specific
amplification, or differences in PCR amplification
between samples. DNA from the TILLING population was
extracted with a high-throughput method; therefore, there
may be variations among samples in DNA quality, salt
and inhibitor concentrations, which may affect PCR per-
formance and HRM analysis [17]. A degree of variation in
melting behavior observed within non-mutants of clinical
samples was previously reported [15]. With careful DNA
extraction and quantitative control, the false positive rate
may be reduced to a lower level. False positives from
Mutation Surveyor
®
analysis can be controlled to a low
level by using highly stringent criteria to identify muta-
tions.
Amplicon length and sequence content may affect the sen-
sitivity of HRM. Shorter amplicons are preferred for
Mutation Surveyor
®
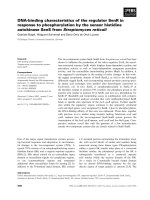
detects single nucleotide changesFigure 3
Mutation Surveyor
®
detects single nucleotide changes. An example of Graphic Analysis Display showing that Mutation
Surveyor
®
detects single nucleotide changes in an amplicom containing three homoeologous SSII fragments.
Forward Reference Trace
Forward Sample Trace
Forward Comparison
Reverse Comparison
Reverse Sample Trace
Reverse Reference Trace
Induced
SNP C/T
SNP among
homoeoloci
BMC Plant Biology 2009, 9:143 />Page 8 of 12
(page number not for citation purposes)
higher sensitivity. However, considering throughput and
efficiency of TILLING, relative longer amplicons (200-250
bp) are still practical for TILLING as demonstrated in this
report. False positives or negatives from HRM analysis
may reduce the mutation detection accuracy. However,
further sequence analysis by Mutation Surveyor
®
will
increase the accuracy. Furthermore the cost of sequencing
will be largely reduced if HRM is followed by sequencing.
Detecting mutations in a TILLING population is not like
genotyping of medical samples, which requires 100%
accuracy and sensitivity. Missing an occasional mutant
will not greatly affect mutant discovery by TILLING. If del-
eterious mutants are identified, they can be assigned to a
particular genome within bread wheat (A, B or D). This
can be achieved either by cloning and sequencing the par-
ticular PCR products as shown in this report, or by using
genome-specific and SNP-specific primers. Because such
Figure 4
A
B
C
Temperature (˚C)
Normalized Fluorescence Relative Signal Difference -dF/dT
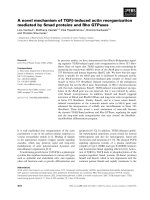
Amplicon melting analysis of fragment ABD6-1Figure 4
Amplicon melting analysis of fragment ABD6-1.
Amplicon melting analysis of fragment ABD6-1 in duplicated
non-mutant and mutant samples, showing the normalized
melting curve (A), difference plot (B) and derivative melting
curve (C). Non-mutants are shown in red and black (thick
lines). Mutants are (as in Table 2) No3 C83T (blue), No4
G103A (green), No5 C133T (salmon, one PCR did not work,
only one sample shown), No6 G147A (brown), No7 G147A
(magenta), No8 G166A (purple), No9 C169T (aqua) and
No10 C177T (orange).
Amplicon melting analysis of fragment ABD6-1 in 32 blind samplesFigure 5
Amplicon melting analysis of fragment ABD6-1 in 32
blind samples. Amplicon melting analysis of fragment
ABD6-1 in 32 blind samples, showing five samples with
altered melting behavior (thick lines) compared to other
samples.
-dF/dT
Temperature (˚C)
BMC Plant Biology 2009, 9:143 />Page 9 of 12
(page number not for citation purposes)
mutations represent a small percentage of total mutations
from EMS mutagenesis, the extra work for such genome
assignments should not be large.
HRM can be applied for mutation detection and SNP gen-
otyping in medical research [21]. Application of HRM in
plant research is limited. Recent publications in plants
demonstrated that HRM is a useful tool for genetic varia-
tion discovery and genotyping including SNPs, INDELs
and microsatellites [22-24]. To our knowledge, this is the
first report of the use of HRM analysis to detect a minor
sequence change in mixed PCR fragments of an EMS-
treated TILLING population. Among the three different
amplicons we studied in this report, HRM of ABD12-22
had the highest sensitivity for detecting mutations.
ABD12-22 is the shortest (167 bp) and has the fewest
intrinsic SNPs (3 SNPs) between homeoloci. The other
amplicons ABD6-1 and ABD2-9 are longer (210 bp and
235 bp respectively) and more complicated (4 SNPs and
8 SNPs respectively). HRM sensitivity is determined by the
sequence context, length and divergence in a PCR ampli-
con containing homoeologous gene fragments. HRM is
usually applicable when the melting peaks are clear and
distinct in non-mutant samples, which can be tested
before large scale experiments, in our experience. How-
ever, the maximum fragment length and sequence diver-
gence between homeoloci where HRM remains useful for
SNP or mutation detection is unknown and further exper-
iments are required.
HRM analysis is able to detect all single base changes, with
greater sensitivity for G/A and C/T changes, and lower sen-
sitivity for A/T and G/C changes [25]. EMS alkylates gua-
nine bases and results in G/C to A/T transitions [26]. HRM
is therefore suitable for TILLING, especially EMS-TILL-
ING. Recent development of massively parallel sequenc-
ing instruments (Roche 454, Illumina/Solexa, and AB
SOLiD) makes it possible to resequence genes of interest
in a mutagenized population with relatively low cost
[27,28]. However, the accessibility and affordability to
these technologies still needs to be considered by many
laboratories. The simplicity and low cost of HRM makes it
a good choice for scanning mutations in TILLING or eco-
TILLING.
Conclusion
HRM in conjunction with sequence analysis is sensitive
enough to detect a heterozygous SNP in a PCR amplicon
containing three homoeologous gene fragments of wheat.
Genome locations of mutations need only be determined
for those are predicted to be deleterious to gene function.
This method can be used for screening three homoeolo-
gous genes simultaneously, especially in a conserved func-
tional domain or EST sequences. For diploid species,
HRM scanning can be used for pooled samples. It may
also be useful for SNP marker development and eco-TILL-
ING.
Methods
TILLING population
An EMS TILLING population was generated in Australian
wheat cultivar Ventura, and DNA samples were prepared
as described previously [19].
Test of Mutation Surveyor
®
sensitivity
A heterozygous mutant (G1642A in Wx-D1) identified
during screening for waxy gene mutants [19] was used to
verify that Mutation Surveyor
®
is able to detect a hetero-
zygous mutant in a mixed DNA pool. DNA from this het-
erozygous mutant and a homozygous non-mutant sample
were mixed to give mutant:non-mutant DNA ratios of 1:0,
1:1, 1:2, 1:3, 1:4 and 1:5. PCR was performed with these
different pools using the primer set Wx7D3 [2] and the
PCR products were purified with Wizard
®
SV Gel and PCR
Clean-up system (Promega, Madison, WI, USA) and
Sanger-sequenced in both directions (Australia Genome
Research Facility, Brisbane, Australia). Mutation Surveyor
®
software was used for analysis of sequence data with the
program set to check 2D (bi-directional) small peaks; the
mutation-calling parameters were set to the program
Table 3: Comparison of results from independent HRM and Mutation Surveyor
®
analysisof 140 TILLING lines.
Fragment HRM Scanning Mutation Surveyor
®
HRM Sensitivity
4
Mut
1
T
2
F
3
Mut
1
HRM detected HRM un-detected % sensitivity
4
% false positive rate
4
ABD6-11578871 87.5 5.7
ABD12-22 10 6 4 6 6 0 100 2.8
ABD2-915510651 83.3 7.1
1
Number of mutations identified by HRM or Mutation Surveyor
®
.
2
T = True mutants that sequences contain mutations confirmed by Mutation Surveyor
®
.
3
F = False mutants that sequences do not contain mutations confirmed by Mutation Surveyor
®
.
4
%sensitivity = true positive/(true positive + false negative); %false positive rate = false positive/total number of sample analysed; assuming Mutation
Surveyor
®
analyses are 100% correct.
BMC Plant Biology 2009, 9:143 />Page 10 of 12
(page number not for citation purposes)
Progeny tests of mutants 4A7 and 4D7Figure 6
Progeny tests of mutants 4A7 and 4D7. Progeny tests of mutants 4A7 (C454T, Q641*) and 4D7 (G165A, W544*). (A)
Twelve segregating M2 seedlings of 4A7 were analysed by HRM in ampilcon ABD3-9, four samples showed mutant-like melting
peaks (thick lines). The thick black line is the known mutant control. (B) Ten segregating M2 seedlings of 4D7 were analysed by
HRM in amplicon ABD6-1, seven samples showed mutant-like melting peaks (thick lines). The thick black line is the known
mutant control. Representative sequence traces are shown on the right; homozygote is at the top, heterozygote in the middle
and non-mutant at the bottom. Vertical arrows show the mutation positions.
A
B
BMC Plant Biology 2009, 9:143 />Page 11 of 12
(page number not for citation purposes)
default including the overlapping factor and dropping fac-
tor. The overlapping factor is calculated by the software
from the two different bases in the reference and sample
traces on either side of the mutation. The dropping factor
is determined from the relative intensities of the four
neighboring peaks (two peaks on each side) between sam-
ples traces and reference traces. Output reports were dis-
played in the advanced two direction setting. In this
setting the software will search for peaks buried within the
baseline and indicate their presence with a short green bar
if they are of the same wavelength and are in the same spa-
tial position in both strands of sequence data.
In the analysis of SSII fragments, which has three homoe-
oloci sequence traces, certain "mutations" were deleted
when the same "mutation" appeared multiple times in the
same position, because they were SNPs between homoe-
ologous loci or were due to artefacts of sequencing. 2D
small peaks identified by the program were checked by
examining the GAD (Graphic Analysis Display), the raw
sequence chromatographs, and also using the bias of EMS
mutagenesis which mutates G/C to A/T [26].
PCR of SSII and HRM analysis
PCR primers used to amplify part of the carboxyl terminal
domain of the SSII gene (GenBank accessions AB201445
,
AB201446
and AB201447) were designed using Primer3
version 0.4.0 /> and manu-
ally justified to avoid regions containing SNPs among the
three genes. Primers ABDF6: 5'-CCGTTCACCGAGTT-
GCCTG-3' and ABDR9: 5'-GGTGCTCCCGCTCGAAGTG-
3' amplify a 532 bp fragment of all three homoeologous
genes (Figure 2). PCR amplification was carried out in a
50 μl volume containing 2 μl of DNA (~100 ng), 1× Pfu-
Ultra
®
II buffer (Stratagene, La Jolla, CA, USA), 1×
enhancer solution (Invitrogen, Carlsbad, CA, USA), 0.2
mM dNTPs, 0.25 μM primers and 1.25 U PfuUltra
®
II
Fusion HS DNA Polymerase (Stratagene, La Jolla, CA,
USA). PCR was conducted using a thermal cycler (Master-
Cycler 5333, Eppendorf, North Ryde, NSW, Australia) as
follows: 95°C for 2 min, followed by 6 cycles of touch-
down PCR (98°C for 10 s, an annealing step starting at
72°C for 20 s and decreasing 1°C per cycle, a temperature
ramp increasing 0.5°C per second to 72°C, and 72°C for
30 min), then 35 more cycles of PCR (98°C for 10 s, 66°C
for 20 s and 72°C for 15 s) and finally extension at 72°C
for 1 min. PCR products were purified using Promega
Wizard
®
SV 96 PCR Clean-up kit (Promega, Madison, WI,
USA) according to the manufacturer's instructions and
eluted in 100 μl H
2
O. The purified PCR products were
then sent to AGRF (Australia Genome Research Facility,
Brisbane, Australia) for sequencing in both directions,
and were used for nested PCR and HRM analysis.
Nested PCR used primers ABDF6 and ABDR1 (5'-ACGAT-
GCCGCGGGTC-3') for a 210 bp amplicon; primers
ABDF12 (5'-GGTACCTGTGGGAGCTSAAG-3') and
ABDR22 (5'-CAGGGAGAAGTTGGTGTAGC-3') for a 167
bp amplicon; primers ABDF2 (5'-ACGCTGGACTCCG-
GCAA-3') and ABDR9 for a 235 bp amplicon; and primers
ABDF3 (5'-CCTGGACGGGCAGAAGG-3') and ABDR9 for
a 137 bp amplicon (Figure 2). PCR was performed in 10
μl reactions under the same conditions as above, except
that 2.5 μM CYTO
®
9 (Invitrogen, Carlsbad, CA, USA) was
added to the reactions and 1 μl of a 100× dilution of the
first PCR (unpurified) or 1 μl of 20× dilution of purified
first PCR product was used as the template. PCR and HRM
analysis were carried out in a Rotor-Gene™ 6000 real time
PCR machine (Corbett Research, Mortlake, NSW, Aus-
tralia) set at the following conditions: 1 cycle of 95°C for
3 min; 40 cycles of 95°C for 10 s, 60°C for 15 s, 72°C for
10 s; 1 cycle of 72°C for 90 s and a melt from 72°C to
90°C rising at 0.1°C per step (wait 2 s every step). The
amplification was monitored. Significantly early or late
amplifications were omitted in HRM analysis, as they may
give rise to aberrant melting curves. After the PCR and
melting steps, samples were loaded on 2% agarose gels to
check whether amplifications were specific.
Cloning
PCR products of mutant samples were cloned into the
pGEM
®
-T Easy vector (Promega, Madison, WI, USA)
according to the manufacturer's instructions. Clones were
sequenced to identify the genome locations of mutations.
Authors' contributions
KV performed mutagenesis and DNA sample preparation.
CD designed experiments, performed HRM and Mutation
Surveyor
®
analysis, cloning, and wrote the paper. PS par-
ticipated in its design and coordination and helped to
draft the manuscript. All authors read and approved the
final manuscript.
Additional material
Additional file 1
Initial analysis with Mutation Surveyor
®
in ABD6-9 sequence traces
identified 26 mutants in 192 TILLING lines. Initial analysis with
Mutation Surveyor
®
in ABD6-9 sequence traces identified 26 mutants in
192 TILLING lines.
Click here for file
[ />2229-9-143-S1.DOC]
BMC Plant Biology 2009, 9:143 />Page 12 of 12
(page number not for citation purposes)
Acknowledgements
We thank Corbett Research, Australia for providing a free trial of the
Rotor-Gene™ 6000, Dr Bing Yu, Department of Molecular and Clinical
Genetics, University of Sydney, for useful discussion, Prof Bob McIntosh
and Dr Peng Zhang, Plant Breeding Institute, University of Sydney, for crit-
ical reading of the manuscript. This work was supported by the Value
Added Wheat Cooperative Research Centre, Australia.
References
1. Henikoff S, Comai L: Single-nucleotide mutations for plant
functional genomics. Annual Review of Plant Biology 2003,
54:375-401.
2. Slade AJ, Fuerstenberg SI, Loeffler D, Steine MN, Facciotti D: A
reverse genetic, nontransgenic approach to wheat crop
improvement by TILLING. Nat Biotechnol 2005, 23:75-81.
3. Wienholds E, Schulte-Merker S, Walderich B, Plasterk RHA: Target-
selected inactivation of the zebrafish rag1 gene. Science 2002,
297:99-101.
4. McCallum CM, Comai L, Greene EA, Henikoff S: Targeted screen-
ing for induced mutations. Nat Biotechnol 2000, 18:455-457.
5. Colbert T, Till BJ, Tompa R, Reynolds S, Steine MN, Yeung AT, McCa-
llum CM, Comai L, Henikoff S: High-throughput screening for
induced point mutations. Plant Physiol 2001, 126:480-484.
6. Gross E, Arnold N, Goette J, Schwarz-Boeger U, Kiechle M: A com-
parison of BRCA1 mutation analysis by direct sequencing,
SSCP and DHPLC. Hum Genet 1999, 105:72-78.
7. Li Q, Liu Z, Monroe H, Culiat CT: Integrated platform for detec-
tion of DNA sequence variants using capillary array electro-
phoresis. Electrophoresis 2002, 23:1499-1511.
8. Langaee T, Ronaghi M: Genetic variation analyses by Pyrose-
quencing. Mutat Res 2005, 573:96-102.
9. Buetow KH, Edmonson M, MacDonald R, Clifford R, Yip P, Kelley J,
Little DP, Strausberg R, Koester H, Cantor CR, et al.: High-through-
put development and characterization of a genome wide col-
lection of gene-based single nucleotide polymorphism
markers by chip-based matrix-assisted laser desorption/ion-
ization time-of-flight mass spectrometry. Proc Natl Acad Sci
USA 2001, 98:581-584.
10. Adams KL, Wendel JF: Polyploidy and genome evolution in
plants. Curr Opin Plant Biol 2005, 8:135-141.
11. Cooper JL, Till BJ, Laport RG, Darlow MC, Kleffner JM, Jamai A, El-
Mellouki T, Liu S, Ritchie R, Nielsen N, et al.: TILLING to detect
induced mutations in soybean. BMC Plant Biology 2008, 8:.
12. Wittwer CT, Reed GH, Gundry CN, Vandersteen JG, Pryor RJ:
High-resolution genotyping by amplicon melting analysis
using LCGreen. Clin Chem 2003, 49:853-860.
13. Monis PT, Giglio S, Saint CP: Comparison of SYT09 and SYBR
Green I for real-time polymerase chain reaction and investi-
gation of the effect of dye concentration on amplification
and DNA melting curve analysis. Anal Biochem 2005, 340:24-34.
14. Kristensen LS, Mikeska T, Krypuy M, Dobrovic A: Sensitive Melting
Analysis after Real Time-Methylation Specific PCR (SMART-
MSP): high-throughput and probe-free quantitative DNA
methylation detection. Nucleic Acids Res 2008, 36:E42.
15. Krypuy M, Newnham GM, Thomas DM, Conron M, Dobrovic A:
High resolution melting analysis for the rapid and sensitive
detection of mutations in clinical samples: KRAS codon 12
and 13 mutations in non-small cell lung cancer. BMC Cancer
2006, 6:.
16. Reed GH, Wittwer CT: Sensitivity and specificity of single-
nucleotide polymorphism scanning by high-resolution melt-
ing analysis. Clin Chem 2004, 50:1748-1754.
17. White H, Potts G: Mutation scanning by high resolution melt
analysis. Evaluation of rotor-gene 6000 (Corbett Life Sci-
ence), HR-1 and 384-well lightscanner (Idaho Technology).
National Genetics Reference Laboratory (Wessex 2006) [http://
www.ngrl.org.uk/Wessex/downloads_reports.htm].
18. Zhou LM, Wang L, Palais R, Pryor R, Wittwer CT: High-resolution
DNA melting analysis for simultaneous mutation scanning
and genotyping in solution. Clin Chem 2005, 51:1770-1777.
19. Dong C, Dalton-Morgan J, Vincent K, Sharp P: A modified TILL-
ING method for wheat breeding. The Plant Genome 2009, 2:.
20. Shimbata T, Nakamura T, Vrinten P, Saito M, Yonemaru J, Seto Y, Yas-
uda H: Mutations in wheat starch synthase II genes and PCR-
based selection of a SGP-1 null line. Theor Appl Genet 2005,
111:1072-1079.
21. Erali M, Voelkerding KV, Wittwer CT: High resolution melting
applications for clinical laboratory medicine. Exp Mol Pathol
2008, 85:50-58.
22. Chateigner-Boutin AL, Small I: A rapid high-throughput method
for the detection and quantification of RNA editing based on
high-resolution melting of amplicons - art. no. e114. Nucleic
Acids Res 2007, 35:E114.
23. Lehmensiek A, Sutherland MW, McNamara RB: The use of high
resolution melting (HRM) to map single nucleotide polymor-
phism markers linked to a covered smut resistance gene in
barley. Theor Appl Genet 2008, 117:721-728.
24. Wu SB, Wirthensohn M, Hunt P, Gibson J, Sedgley M: High resolu-
tion melting analysis of almond SNPs derived from ESTs.
Theor Appl Genet 2008, 118:1-14.
25. Liew M, Pryor R, Palais R, Meadows C, Erali M, Lyon E, Wittwer C:
Genotyping of single-nucleotide polymorphisms by high-res-
olution melting of small amplicons. Clin Chem 2004,
50:1156-1164.
26. Greene EA, Codomo CA, Taylor NE, Henikoff JG, Till BJ, Reynolds
SH, Enns LC, Burtner C, Johnson JE, Odden AR, et al.: Spectrum of
chemically induced mutations from a large-scale reverse-
genetic screen in Arabidopsis. Genetics 2003, 164:731-740.
27. Comai L, Henikoff S: TILLING: practical single-nucleotide
mutation discovery. Plant J 2006, 45:684-694.
28. Weil CF: TILLING in Grass Species. Plant Physiol 2009,
149:158-164.
Additional file 2
Amplicon melting analysis of fragment ABD12-22. Amplicon melting
analysis of fragment ABD12-22 in duplicated non-mutant and mutant
samples, showing normalized melting curve (A), difference plot (B) and
derivative melting curve (C). Non-mutants are shown in red and black
(thick lines). Mutants (as in Additional file 1) are M9 (G166A, green),
M10 (C169T, blue), M11 (C177T, orange) and M13 (C205T, pink).
Click here for file
[ />2229-9-143-S2.DOC]
Additional file 3
Amplicon melting analysis of fragment ABD2-9. Amplicon melting
analysis of fragment ABD2-9 in duplicated non-mutant and mutant sam-
ples, showing normalized melting curve (A), difference plot (B) and
derivative melting curve (C). Non-mutants are shown in red and black
(thick lines). Mutants (as in Additional file 1) are M18 (G348A, blue),
M19 (C360T, brown), M20 (C366T, pink), M21 (C379T, green), M22
(G383A, orange), M24 (G462A, purple), and M25 (C463T and
C489T, aqua).
Click here for file
[ />2229-9-143-S3.DOC]