worldwide covid 19 cases analysis
Bạn đang xem bản rút gọn của tài liệu. Xem và tải ngay bản đầy đủ của tài liệu tại đây (434.15 KB, 13 trang )
<span class="text_page_counter">Trang 1</span><div class="page_container" data-page="1">
<i>3.1-Model Overview for Covid-19 Analysis...11</i>
<i>3.2-Feature Selection and Engineering...11</i>
<i>3.3-Model Architecture and Training...11</i>
<i>3.4-Evaluation Metrics and Performance Analysis...11</i>
<b>4.SCENARIO ANALYSIS AND PURPOSE...12</b>
<i>4.1-Scenario Definition for Covid-19 Analysis...12</i>
<i>4.2-Simulation Methods and Assumptions...12</i>
<i>4.3-Analysis of Scenario Results and Findings...12</i>
<i>4.4-Purpose and Objectives of the Scenario Analysis...12</i>
<i>5.1-Summary of Covid-19 Analysis Findings...12</i>
<i>5.2-Limitations and Future Research Directions...12</i>
<i>5.3-Implications and Recommendations...12</i>
<b>Worldwide Covid-19 Cases AnalysisABSTRACT</b>
This paper introduces an innovative methodology for analyzing the Covid-19 prediction.
</div><span class="text_page_counter">Trang 2</span><div class="page_container" data-page="2">COVID-19 is a global threat that has prompted extensive research efforts worldwide. This study aims to analyze the current research focus and country variations in income levels and COVID-19 transmission. A textual analysis of 5780 publications from databases like Web of Science, Medline, and Scopus was conducted
of developing a machine learning model to predict the risk level of COVID-19 patients based ontheir symptoms, status, and medical history. The report outlines the steps involved in model development, evaluation, and interpretation, emphasizing the potential value of the model in resource allocation and prioritization.
<i>Figure 1: Coronavirus prediction</i>
A mathematical model is formulated to introduce a quarantine class and government interventionmeasures for mitigating disease transmission. The model's dynamical behavior is studied in terms of the basic reproduction number. The sensitivity analysis reveals that reducing contact between exposed and susceptible individuals is the most crucial factor in achieving disease control. (Majhi, Thangeda et al. 2021) An optimal control problem is formulated to minimize the number of infected individuals and the cost of implementing government control measures. The article also provides a short-term forecast of COVID-19 trends in three highly affected states in India, emphasizing the need for further monitoring and control measures to reduce contact between exposed and susceptible individuals in the first two states.(Mandal, Jana et al. 2020)
<i>1.1-Motivation of covid 19 study.</i>
The motivation behind conducting this research stems from the urgency and significance of understanding the impact of COVID-19 on different countries. The global nature of the
</div><span class="text_page_counter">Trang 3</span><div class="page_container" data-page="3">pandemic demands comprehensive analysis to inform evidence-based decision-making and improve our collective response to such health crises.
We seek to close significant knowledge gaps and offer insightful information that can support international efforts to prevent COVID-19 by examining the experiences and responses of various nations. The results of this study could affect legislative choices, influence public health efforts, and ultimately save lives. (Murashima 2023)
Future preparedness and response activities must be guided by an understanding of the variables that affect infection rates, fatality rates, and the efficacy of containment measures. By identifyingbest practices and lessons gained, we may build a knowledge foundation that can be used to prepare for comparable global health issues in the future as well as during the current pandemic.(Ivanov and Dolgui 2020)
Moreover, this research seeks to emphasize the importance of global collaboration and interdisciplinary approaches in addressing complex public health issues. (Szolnoki, Lueke et al. 2021) By analyzing data from different countries, we can foster a deeper understanding of the interplay between epidemiology, healthcare systems, socioeconomic factors, and policy responses. This understanding can pave the way for innovative solutions and enhance our collective resilience against future pandemics.
Ultimately, the motivation behind this research lies in our shared responsibility to protect public health and mitigate the devastating impacts of COVID-19. By conducting a comprehensive investigation into the pandemic's impact on different countries, we aim to contribute to the globalknowledge base, inform evidence-based decision-making, and foster international cooperation in addressing current and future health crises.(Legate, Ngyuen et al. 2022)
COVID-19 caseload identification analysis.Cross-country COVID-19 mortality rate examination.Successful recovery factors assessment.
Impact exploration of demographics, healthcare, and interventions on COVID-19 spread and severity.
<b>2.RELATED WORK</b>
Country/Region The name of the country or region where the COVID-19 cases are reported.
Afghanistan
</div><span class="text_page_counter">Trang 4</span><div class="page_container" data-page="4">Confirmed The total number of confirmed COVID-19 cases in the country or region.
36263Deaths The total number of deaths attributed
to COVID-19 in the country or region.
1269Recovered The total number of individuals who
have recovered from COVID-19 in the country or region.
25198Active The current number of active
COVID-19 cases (active cases = confirmed - deaths - recovered) in the country or region.
New cases The number of newly reported COVID-19 cases in the country or region.
106New deaths The number of newly reported deaths
attributed to COVID-19 in the country or region.
10New recovered The number of individuals who have
newly recovered from COVID-19 in the country or region.
Deaths / 100 Cases <sup>The percentage of deaths among the </sup><sub>total confirmed cases (deaths / </sub>confirmed * 100).
3.50Recovered / 100
Cases <sup>The percentage of recoveries among </sup>the total confirmed cases (recovered /confirmed * 100).
69.49Deaths / 100
Recovered <sup>The percentage of deaths among the </sup>total recoveries (deaths / recovered * 100).
5.04Confirmed last week The total number of confirmed cases
in the country or region reported in the previous week.
355261 week change The change in the total number of
confirmed cases compared to the previous week (confirmed - confirmed last week).
1 week % increase The percentage increase in the total number of confirmed cases comparedto the previous week ((1 week change / confirmed last week) * 100).
WHO Region The region of the World Health
Organization (WHO) to which the <sup>Eastern Mediterranean</sup>
</div><span class="text_page_counter">Trang 5</span><div class="page_container" data-page="5">country or region belongs.
<b>Analyze by describing data:</b>
The information I got from Kaggle from the Mexican government. This dataset contains an enormous number of anonymized patient-related information including pre-conditions. The raw dataset consists of 16 uniques features and 5 rows of area.
The price and the other factors are independent variables in Figure 2, which shows the Covid-19 patient' status from different countries, will predict whether the patient is at high risk or not.
<i>Figure 2: The covid 19 dataset</i>
What are the data types for various feature? And What is the distribution of numerical feature values across the samples?
<i>Figure 3: Check the datatype of all valuables in dataset</i>
In Figure 4, we observe that the dataset comprises a total of 15 columns, each representing a specific feature or attribute. Among these columns, nine features are represented as integers, two features are objects (likely representing categorical variables or textual data), and four features are represented as floating-point numbers (commonly used for quantitative variables with decimal values).
</div><span class="text_page_counter">Trang 6</span><div class="page_container" data-page="6">The use of Pandas, a powerful data manipulation and analysis library in Python, greatly facilitates the exploration and description of datasets, particularly in the early stages of research. By leveraging the functionalities offered by Pandas, researchers can gain valuable insights into the dataset and obtain answers to important questions that arise during the initial phases of data analysis.
<b>1.Which country or region has the highest number of confirmed COVID-19 cases?</b>
The statistics shows that Afghanistan, with a total of 36,263 verified COVID-19 cases, has the largest number of cases in figure 2. This research emphasizes the pandemic's major effects on Afghanistan's population and raises the possibility of a strain on the healthcare infrastructure of the nation. A number of variables, including population density, testing capability, and the degreeof community transmission, may have an impact on the large number of confirmed cases.
<b>2. What is the overall mortality rate (deaths / confirmed) across all countries or regions?</b>
According to the presented dataset, the global death rate for all nations or regions is 3.50%. The proportion of confirmed COVID-19 cases worldwide that have died is represented by this figure.The mortality rate indicates the danger of fatal events related with COVID-19 and offers crucial insights into the severity and effect of the condition. With a mortality rate of 3.5%, it is likely that a sizable fraction of those with confirmed cases have died.
<b>3. Which country or region has the highest number of deaths attributed to COVID-19?</b>
Afghanistan reports the highest number of deaths attributed to COVID-19 in figure 2, with a totalof 1,269 deaths. This figure underscores the significant toll that COVID-19 has taken on public health in Afghanistan, potentially reflecting a combination of factors, including healthcare infrastructure, access to treatment, demographic characteristics, and the effectiveness of containment measures. The high number of deaths underscores the importance of robust public health interventions and healthcare resources to mitigate the impact of the disease.
<b>4. Among the reported cases, which country or region has the highest number of recoveries?</b>
Among the reported cases, Afghanistan has registered the highest number of recoveries, with a total of 25,198 individuals who have successfully recovered from COVID-19. This finding highlights the potential for positive health outcomes and successful recovery in Afghanistan. Factors contributing to the high number of recoveries may include effective healthcare management, treatment protocols, and recovery support, such as access to medical care, isolation, and supportive therapies.
<b>5. What is the average number of active COVID-19 cases across all countries or regions?</b>
The dataset was used to compute the average number of active COVID-19 cases across all nations or regions, which came to be about 3,309.8. This figure shows the total number of peoplewho are actively infected with the virus and may be able to spread it, and it offers important insights on the current burden of active cases around the world. In order to quantify the worldwide illness burden, allocate healthcare resources, and implement efficient public health
</div><span class="text_page_counter">Trang 7</span><div class="page_container" data-page="7">interventions to restrict the spread of COVID-19, it is imperative to track the average number of active cases.
<b>6. Which country or region has shown the highest increase in new cases compared to the previous week?</b>
With a rise of 709 new cases over the course of one week, analysis of the dataset reveals that Albania has experienced the biggest increase in new COVID-19 instances when compared to the prior week. This finding points to a significant increase in newly reported cases over a short period of time, potentially signaling an acceleration of COVID-19 transmission dynamics in Albania. Changes in testing capacity, public health initiatives, population shifts, and adherence topreventive habits are possible contributors to this increase.
<b>7. Among the countries or regions with significant new cases, which one has the highest number of new deaths?</b>
Among the countries or regions with significant new cases, Algeria reports the highest number ofnew deaths, with 8 additional deaths recorded. This observation signifies an alarming escalation in COVID-19-related fatalities within a specific timeframe in Algeria. The high number of new deaths may be influenced by various factors, including healthcare capacity, access to critical care, the virulence of circulating viral strains, and the effectiveness of public health interventionsaimed at reducing mortality rates.
<b>8. How does the mortality rate vary across different WHO regions?</b>
The offered dataset, however, regrettably does not directly provide data on the death rate in various World Health Organization (WHO) areas. Additional information pertaining to death rates broken down by WHO regions would be necessary in order to fully assess the variance in mortality rates. Insights into geographical disparities, variations in healthcare systems, demographic variables, public health interventions, and the efficiency of COVID-19 response plans in various regions can be gained by analyzing such data.
<b>9. Which country or region has the highest percentage of deaths among the confirmed cases?</b>
Among the countries or regions in the dataset, Andorra has the highest percentage of deaths among the confirmed cases, with a death rate of 5.73%. This finding indicates a relatively higher proportion of fatal outcomes among individuals diagnosed with COVID-19 in Andorra. Several factors may contribute to this higher mortality rate, including population demographics, healthcare capacity, testing strategies, the prevalence of underlying health conditions, and the quality of healthcare services available to COVID-19 patients.
<b>10. How does the number of recoveries compare to the number of confirmed cases in each country or region?</b>
The provided dataset does not directly provide a comparison between thenumber of recoveries and the number of confirmed cases in each country or region. However, by calculating the recovery rate (recovered / confirmed * 100) for each country or region using the available data, it
</div><span class="text_page_counter">Trang 8</span><div class="page_container" data-page="8">is possible to assess the proportion of individuals who have successfully recovered from COVID-19 in relation to the total number of confirmed cases. Analyzing the recovery rate can provide insights into the effectiveness of healthcare systems, treatment protocols, and public health interventions in facilitating recovery and reducing the burden of active cases.
<i>Figure 4: Country/Region arrays</i>
In Figure 4, The 'Country/Region' array consists of 195 countries and regions, providing a comprehensive global perspective on the reach of the pandemic. These countries represent diverse locations from Afghanistan to Zimbabwe.
</div><span class="text_page_counter">Trang 9</span><div class="page_container" data-page="9">The 'WHO Region' array categorizes these countries and regions into six distinct regions defined by the World Health Organization (WHO). These regions include Eastern Mediterranean, Europe, Africa, Americas, Western Pacific, and South-East Asia. This classification allows for a regional analysis and comparison of COVID-19 trends and patterns.
We are able to understand the individual nations and areas affected by the epidemic by looking atthe 'Country/Region' array, which adds to our understanding of the pandemic's overall effects. Byshowing regional trends and differences, the 'WHO Region' array offers a clearer understanding of how the pandemic is disseminated throughout several locations.
It is significant to note that the presented data lacks particular COVID-19 statistics and comprehensive details on the pandemic's effects on each nation or region. However, it provides astarting point for additional investigation and research. Additional information about cases, deaths, tests, and other pertinent aspects would be required to perform a more thorough research of COVID-19.
<i>2.2-Data Collection Methods</i>
As we can see in this dataset in Figure 5 by using ouput code
to is used to calculate the correlation coefficients between variables in a pandas DataFrame called df.
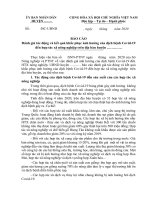
<i>Figure 5: The dataset of information</i>
As we can see from Figure 5, this table shows the correlation coefficients from the dataset of covid-19.
Confirmed shows a strong positive correlation with Deaths (0.934698), Recovered (0.906377), and Active (0.927018). This indicates that as the number of confirmed cases increases, the number of deaths, recoveries, and active cases also tend to increase.
Deaths has a strong positive correlati
Recovered and Active have a somewhat positive association (0.682103), which suggests that as recoveries rise, the number of active cases tends to fall.
Confirmed and Active have a substantial positive connection with new instances (0.909720 and 0.851190, respectively). This suggests that a rise in confirmed and active cases is correlated with an increase in new cases.
New cases and New deaths have a high positive connection of 0.935947, while Active and Active have a moderately favorable correlation of 0.78123. This shows that greater rates of newly reported deaths and new cases and active cases are related.
New recovered has a moderate positive correlation with Recovered (0.919203) and a weak positive correlation with Active (0.673887). This indicates that higher numbers of newly reported recoveries are associated with higher overall recoveries and a decrease in active cases.
</div><span class="text_page_counter">Trang 10</span><div class="page_container" data-page="10">Deaths / 100 Cases has a weak positive correlation with Deaths (0.251565) and a weak negative correlation with Recovered / 100 Cases (-0.168920). This suggests a slight increase in the percentage of deaths per 100 cases with a higher number of deaths and a slight decrease in the percentage of recoveries per 100 cases.
Deaths / 100 Recovered has a weak positive correlation with Deaths (0.169006) and a weak positive correlation with Active (0.058386). This indicates a slight increase in the percentage of deaths per 100 recoveries with higher numbers of deaths and a slight increase in active cases.
Confirmed last week has a strong positi
Confirmed (0.954710) and New cases (0.959993) have a strong positive association with 1 week change, indicating that bigger changes in the number of confirmed cases and new casesare related to higher numbers of confirmed cases.
A higher percentage rise in confirmed cases compared to the prior week is linked to a lower percentage of recoveries per 100 cases, according to a weakly negative association between 1week% increase and Recovered / 100 Cases (-0.394254).
<b>3.PROPOSED MODEL</b>
<i>3.1-Model Overview for Covid-19 Analysis</i>
The suggested approach seeks to get insights into the global epidemic by analyzing worldwide COVID-19 data. It integrates epidemiological data, demographic data, and intervention techniques to better understand the distribution, impact, and mitigation strategies of COVID-19 across countries and regions.
<i>3.2-Correlation between variables:</i>
We can assess the strength of the linear link between two variables using a metric called the correlation coefficient in order to analyze the relationship between two variables graphically.(Sharif, Sarkar et al. 2021)
The study found that COVID-19 deaths per million people in a country are negatively related to the country's BCG vaccination rate.(Li 2021)
Or this:
Where:
</div>