Balanced scorecards and operational dashboards with Microsoft excel
Bạn đang xem bản rút gọn của tài liệu. Xem và tải ngay bản đầy đủ của tài liệu tại đây (14.61 MB, 482 trang )
<span class="text_page_counter">Trang 1</span><div class="page_container" data-page="1">
<b>Balanced Scorecards</b>
& Operational Dashboards
<b>Create Balanced Scorecards and </b>
<b>operational dashboards that drive success</b>
Balanced Scorecards help organizations clarify their strategy, translate strategy into action, and successfully execute their strategy. Operational dashboards are critical for monitoring and managing high performance.
This book is a guide for those who defi ne and build these business performance tools: executive sponsors, operational managers, facilitators, and Excel developers. Based on years of experience, these step-by-step methods will help you develop Balanced Scorecards and operational dashboards that drive strategic execution and operational performance.
<b>• Write a strategic Destination Statement that clarifi es your vision</b>
<b>• Build a Strategy Map illustrating strategic objectives and the causal links that drive success</b>
<b>• Map operational processes to identify leverage points with the greatest impact• Identify the “critical few” metrics that drive and measure success</b>
<b>• Gain buy-in with Tactical Action Plans and Implementation Plans • Build impressive, dynamic Excel scorecards and dashboards using only </b>
<b>$49.99 US$54.99 CAN </b>
Visit our Web site at www.wiley.com/compbooks
Companion Web site
Download free Excel sample fi les at www.wiley.com/go/scorecardsanddashboardswithexcel. You can also fi nd additional resources on Balanced Scorecards and operational dashboards at www.torconsulting.com
<b>Ron Person</b> is Managing Director of Tor Consulting, Inc., a fi rm passionately dedicated to helping organizations execute their strategy and build measurable high performance. He is certifi ed as a Balanced Scorecard consultant through the Balanced Scorecard Collaborative founded by Drs. Kaplan and Norton, founders of the Balanced Scorecard, and he is a
Award). Ron’s clients span a wide range of industries in the U.S. and internationally.
</div><span class="text_page_counter">Trang 3</span><div class="page_container" data-page="3">Balanced Scorecards and Operational Dashboards with
</div><span class="text_page_counter">Trang 5</span><div class="page_container" data-page="5">Balanced Scorecards and Operational Dashboards
Ron Person
</div><span class="text_page_counter">Trang 6</span><div class="page_container" data-page="6"><b><small>Balanced Scorecards and Operational Dashboards with Microsoft Excel</small></b>
<small>Published by Wiley Publishing, Inc. 10475 Crosspoint Boulevard Indianapolis, IN 46256 www.wiley.com</small>
<small>Copyright © 2009 by Tor Consulting, Inc., Santa Rosa, California Published by Wiley Publishing, Inc., Indianapolis, Indiana Published simultaneously in Canada</small>
<small>ISBN: 978-0-470-38681-1</small>
<small>Manufactured in the United States of America10 9 8 7 6 5 4 3 2 1</small>
<small>Library of Congress Cataloging-in-Publication Data is available from the publisher.</small>
<small>No part of this publication may be reproduced, stored in a retrieval system, or transmitted in any form or by any means, electronic, mechanical, photocopying, recording, scanning, or otherwise, except as permitted under Sections 107 or 108 of the 1976 United States Copyright Act, without either the prior written permission of the Publisher, or authorization through payment of the appropriate per-copy fee to the Copyright Clearance Center, 222 Rosewood Drive, Danvers, MA 01923, (978) 750-8400, fax (978) 646-8600. Requests to the Publisher for permission should be addressed to the Permissions Department, John Wiley & Sons, Inc., 111 River Street, Hoboken, NJ 07030, (201) 748-6011, fax (201) 748-6008, or online at of Liability/Disclaimer of Warranty: The publisher and the author make no representations or warranties with respect to the accuracy or completeness of the contents of this work and specifically disclaim all warranties, including without limitation warranties of fitness for a particular purpose. No warranty may be created or extended by sales or promotional materials. The advice and strategies contained herein may not be suitable for every situation. This work is sold with the understanding that the publisher is not engaged in rendering legal, accounting, or other professional services. If professional assistance is required, the services of a competent professional person should be sought. Neither the publisher nor the author shall be liable for damages arising herefrom. The fact that an organization or Web site is referred to in this work as a citation and/or a potential source of further information does not mean that the author or the publisher endorses the information the organiza-tion or Web site may provide or recommendations it may make. Further, readers should be aware that Internet Web sites listed in this work may have changed or disappeared between when this work was written and when it is read.</small>
<small>For general information on our other products and services, please contact our Customer Care ment within the United States at (877) 762-2974 and outside the United States at (317) 572-3993, fax (317) 572-4002.</small>
<b><small>Depart-Trademarks:</small></b><small> Wiley and the Wiley logo are trademarks or registered trademarks of John Wiley & Sons, Inc., and/or its affiliates, in the United States and other countries, and may not be used without writ-ten permission. Microsoft and Excel are registered trademarks of Microsoft Corporation in the United States and/or other countries. All other trademarks are the property of their respective owners. Wiley Publishing, Inc., is not associated with any product or vendor mentioned in this book.</small>
<small>XL Cubed © 2009 Microcharts </small>
<small>Xcelsius © SAP AG. All rights reserved. SAP and the SAP logo are trademarks and registered trademarks of SAP AG in Germany and several other countries. Business Objects and its logo and Crystal Reports are trademark or registered trademarks of Business Objects, S.A., an SAP Company.</small>
<small>SmartDraw © with SmartDraw </small>
<small>Reproduced with permission from SmartDraw.com, </small>
<small>Wiley also publishes its books in a variety of electronic formats. Some content that appears in print may not be available in electronic books.</small>
</div><span class="text_page_counter">Trang 7</span><div class="page_container" data-page="7">About the Author
<b>Ron Person</b> helps his clients create a competitive advantage in strategic tion and a culture of high-performance.
execu-Ron’s firm, Tor Consulting, works with small- to mid-sized organizations with revenues of $25 to $500 million. His clients in the United States and internation-ally include hospitals, banks, biotech companies, medical device manufacturers, and financial services firms, spanning a diversity of organizations such as:
Medtronic CardioVascular<small>■</small>
Prior to founding Tor Consulting, Ron has been:
A manager of competitive analysis for a Fortune 500 corporation <small>■</small>
international bestsellers with almost 4 million copies in print
He has personally conducted workshops for thousands of businesspeople and has spoken before conferences and groups such as Vistage (the world’s lead-ing Chief Executive organization), Microsoft technical conferences, the American Society for Quality, APICS (the Association for Operations Managers), the Project Management Institute, PIHRA (the Professionals in Human Resources Association), and the American Association of Homes and Services for the Aging.
</div><span class="text_page_counter">Trang 8</span><div class="page_container" data-page="8"><b>vi About the Author</b>
Ron’s education and credentials include:
Certification by the Balanced Scorecard Collaborative, the educational <small>■</small>
division of the founders of Balanced Scorecard, Drs. Kaplan and Norton. Only a few independent consultants each year pass this rigorous training and examination.
Member of the California Awards for Performance Excellence™ Board of <small>■</small>
Training as a facilitator for strategic planning by the Institute for Cultural <small>■</small>
Affairs and the Center for Strategic Facilitation
For additional information on how your organization can create a competitive advantage through strategic execution and accelerated performance, contact Ron Person at:
<small> </small>
(707) 568-6976
<small>www.torconsulting.com</small>
</div><span class="text_page_counter">Trang 9</span><div class="page_container" data-page="9"><b>viiDoug Holland</b>, a “blue-badge” software engineer at Intel Corporation since March 2007, holds a master’s degree in software engineering from Oxford University, has received the Microsoft MVP award within the Visual C# cat-egory, and is also an Intel Black Belt Software Developer. Outside work, Doug enjoys spending time with his wife and four children and is an officer and aircrew member in the Civil Air Patrol/U.S. Air Force Auxiliary.
About the Technical Editor
</div><span class="text_page_counter">Trang 11</span><div class="page_container" data-page="11">Having been a consultant for more than 20 years, I realize that one of the sibilities of a consultant is collecting and filtering ideas that help clients, then putting the best ones into practice in ways that make them productive and beneficial. There are many people and sources who have built the foundation of the ideas presented in this book. Here are a few I would like to thank.
respon-First, thank you to my past and future clients. I truly enjoy meeting and working with each new team to help create a competitive and performance advantage.
Thank you to Drs. Kaplan and Norton of the Palladium Group for ing the advancement of management science with Balanced Scorecards and Strategy Maps.
further-Each year, a few consultants complete the Balanced Scorecard certification program delivered through the Balanced Scorecard Collaborative, the educa-tional division of the Palladium Group. Thank you to Edward A. Barrows, Jr., Vice President of Balanced Scorecard Collaborative, a Palladium company, and Karen A. DiMartino, Manager, Advisory Services, for conducting an excellent Balanced Scorecard certification program.
The consulting profession can often be lonely, and the opportunities to develop our professional skills are neglected as we help clients and spend time with family. Many people have committed extra time to developing the professional skills of consultants, and we consultants owe them a debt of gratitude. A few of these people in northern California are:
Harry Chapman, Bay Area Consulting Group, founder of the Bay Area Consultants Network
Rogene Baxter, the Bridgewater Group, former president of the Institute of Management Consultants, Northern California Chapter
Acknowledgments
</div><span class="text_page_counter">Trang 12</span><div class="page_container" data-page="12">Diane Akers, 2008 California Awards for Excellence™, Board of JudgesRuth Miller, Senior Lead, California Awards for Excellence™
After having written more than 20 books, I wasn’t sure I wanted to write again, but working with a great team from Wiley Publishing has made it easy to get back in the saddle. Thanks to:
Nancy Muir, software entrepreneur and author of innumerable books, for giving me the nudge that pushed me back into writing
Adaobi Obi Tulton, Senior Development Editor, for being a soft-spoken “velvet hammer” who asked me the right questions, found answers to my queries, and kept reminding me of deadlines
Thanks also to those who trust authors to produce the best book that will serve their readers:
Katie Mohr, Acquisitions EditorGreg Croy, Acquisitions EditorJim Minatel, Acquisitions Director
The multitude of editors for this book have worked hard; if errors have slipped by their well-trained eyes, those errors are mine.
Finally, and most importantly, my thanks to my family for their loving port and understanding. I missed you during the time spent on this book. My love to Barb, Annika, Rohan, Marjorie, and Anne.
</div><span class="text_page_counter">Trang 13</span><div class="page_container" data-page="13">Does the Balanced Scorecard Guarantee Business Success? 9Does the Balanced Scorecard Really Work? 11Do Small and Medium-Sized Businesses
Benefit from the Balanced Scorecard? 12Is the Balanced Scorecard Worth Developing? 13
Developing Your Strategic Assessment 25
Defining Your Strengths and Weaknesses with the Balanced
</div><span class="text_page_counter">Trang 14</span><div class="page_container" data-page="14">You Must Make Your Case for Change 37
Chapter 4 Step-by-Step to Building Your Strategy Map<b> 49</b>
Perspectives: Monitoring Your Strategy
Strategic Themes: Concentrating Resources and
Momentum along Specific Themes 53Objectives and Causal Links: Modeling
What Drives Your Business Success 54Selecting a Strategy Map Facilitator 55Step-by-Step to Creating Your Strategy Map 56
Chapter 5 Step-by-Step from Strategy to Action 63Turning Your Strategy Map into Measurable Action 63
Motivating and Educating the Strategic Theme Teams 65
</div><span class="text_page_counter">Trang 15</span><div class="page_container" data-page="15"><b>Contents xiii</b>
Chapter 6 Step-by-Step to Selecting Metrics and Setting Targets 73Achieving Balance in Your Balanced Scorecard 73
If You Have More Than the “Critical Few,” You Lose 75Lead and Lag Metrics: Drivers and Results 76
Step-by-Step to Selecting Your Metrics 79Defining the Metric with a Metric Definition 80Look Out! What You Measure Is What You Get! 81Critical Questions to Ask About Your Measures and Metrics 82
Chapter 7 Step-by-Step to Developing Your Implementation Plan 87Step-by-Step to Translating Initiatives into Projects 87Monitoring Initiatives in Progress 90
Chapter 8 Step-by-Step to Roll-Out and Strategic Reviews 93Creating a Culture Focused on Strategy 93
Communication, Training, and Roll-Out 98
The Challenges in Developing Dashboards 110
Chapter 10 Mapping Your Operational Processes 113
</div><span class="text_page_counter">Trang 16</span><div class="page_container" data-page="16"><b>xiv Contents</b>
Step-by-Step to Building a Map 120
Brainstorming and Identifying Metrics Using an Ishikawa or
What’s Simple Can Be Difficult, and What’s Difficult
Part III Building Maps, Scorecards and Dashboards 135Chapter 12 Creating Dashboards for Decision Making 137Step-by-Step to Creating Dashboards That Aid Decision Making 137
Some Important Sources on the Art and Science of
</div><span class="text_page_counter">Trang 17</span><div class="page_container" data-page="17"><b>Contents xv</b>
Chapter 13 Drawing Process and Strategy Maps 149Which Drawing Tool Should You Use? 149
Alerting with Conditional Formats 174
Creating In-Cell Charts with Text 178
</div><span class="text_page_counter">Trang 18</span><div class="page_container" data-page="18"><b>xvi Contents</b>
Alerting with Conditional Text Icons 181
Chapter 16 Custom Labels and Formatting 187Combining Numbers, Text, and Dates to Create Custom Labels 188
Automatically Updating Quarterly Titles
Scaling Numbers with Formatting 194
Creating Custom Titles and Floating Text 196
Chapter 17 Working with Data That Changes Size 211Naming Ranges for Ease of Use and Functionality 212
Creating Dynamic Range Names That Automatically
</div><span class="text_page_counter">Trang 19</span><div class="page_container" data-page="19"><b>Contents xvii</b>
Chapter 18 Working with Lists and Tables of Data 227Banish VLOOKUP—Use INDEX and MATCH 227The Key to Creating Most Interactive Dashboards 230
Formatting the Y-axis to Remove Unnecessary
Using Camera Pictures of Charts, Tables,
Simultaneously Formatting the Size of Multiple Charts
When to Use a Data Validation List or Combo Box? 273
Creating Dynamic Cascading Combo Boxes or Lists 274
Displaying or Hiding Data with a Check Box 276Scrolling Charts through Time with a Slider Bar 277
</div><span class="text_page_counter">Trang 20</span><div class="page_container" data-page="20"><b>xviii Contents</b>
Chapter 21 Working with PivotTables 281Basic Concepts of PivotTables 282Creating an Auto-Expanding Database Name 284Using PivotTable Results in Dashboards 286
Drilling Down to Detail with PivotTables 292Updating the PivotTable Linked to Internal or External Data 293
Chapter 22 Smoothing Data and Forecasting Trends 295
Adding the Analysis ToolPak to Excel 301
Chapter 23 Identifying Targets and Displaying Alerts 309
Charting Alerts with Conditional Colors 311
<i>Charting Alerts for the Top/Bottom n, Quartiles, </i>
Charting Alerts with Line and XY Scatter Diagrams 317
<i>Adding a Visual Indicator to Top/Bottom n, Quartile, </i>
Chapter 24 Building Powerful Decision Making Charts 323Seeing a Full Statistical Picture with a Box-and-Whisker Plot 324Bullet Charts—A Better Alternative to Gauges 329Pareto Charts Show What Is Most Important 336Variance Charts Make a Difference 338Project Your Projects with Gantt Charts 340Project Variance Gantt Charts 342
</div><span class="text_page_counter">Trang 21</span><div class="page_container" data-page="21"><b>Contents xix</b>
Creating Flashy Interactive Dashboards with Xcelsius Engage 373
Adding Context and Comments with Briefing Books 385Displaying Pop-Up Content and Dynamic Help 386Controlling Dashboard Display 388
Sending Conditional E-mails from Dashboards 389
Locating and Removing Phantom Links 391Protecting Content, Worksheets, and Workbooks 392
Chapter 28 Data Integration Methods 395Manual Data Entry or Automated Data Integration? 395Manual Data Entry for Dashboards 397Automating Data Retrieval with Text Files 398
Automating Data Retrieval from Databases 404
Importing Data Using a PivotTable 408
</div><span class="text_page_counter">Trang 22</span><div class="page_container" data-page="22"><b>xx Contents</b>
Refreshing Data Automatically 410Linking Imported Data to Your Dashboard 412What is OLAP and When Should You Use It? 412
Chapter 29 Publishing Balanced Scorecards and Dashboards 415
Publishing Multi-Dashboard Systems 418
Creating Complex or High-Security Balanced Scorecards
</div><span class="text_page_counter">Trang 23</span><div class="page_container" data-page="23">This book is a guide to how your organization can create a competitive tage by successfully executing strategy and accelerating performance. You must begin with a vision that is held and communicated through leadership to every employee. That vision is achieved when employees work in concert knowing how they contribute to strategic success and operational performance. A Strategy Map and Balanced Scorecard are the map and measures to how you can achieve strategic success. Operational maps and operational dashboards are the maps and measures that show you how to accelerate operational success.
advan-When I work with truly high-performance teams I see in their eyes a fire and focus that builds energy and intensity throughout the team. That energy comes in two phases. The first phase is the initial excitement of the vision — what the team can build in the future. The second phase, which sustains and builds their energy, comes when they translate their vision into action. Seeing that energy and fire in a team’s eyes is what gives me a passion for my work.
One of my reasons for writing this book is to give organizations of all sizes tools for creating their own execution advantage and building a culture of high performance. This book isn’t just for large multinational organizations. Small- to mid-sized organizations need strategy management, decision-making, and performance management tools as much as or more than multinational corpo-rations. But they don’t have the hundreds of thousands of dollars necessary for Business Intelligence software and long strategic planning processes. And the limited resources of small- and mid-sized organizations require them to have even greater focus and alignment.
</div><span class="text_page_counter">Trang 24</span><div class="page_container" data-page="24">suc-Whether at the macro level of executing your strategy and aligning your company or at the micro level of creating a project team that meets deadlines, there are a few core principles that remain the same:
Create a “burning platform” that moves people away from business <small>■</small>
Maintain and sustain the high performance culture.<small>■</small>
</div><span class="text_page_counter">Trang 25</span><div class="page_container" data-page="25"><b>Introduction xxiii</b>
Who This Book Will Help
This book is built to be a practical guide. It doesn’t have much theory in it. There are already many books with theory and case studies about Balanced Scorecards, Six Sigma, Lean, and other performance improvement methods. Rather, this book is intended to be a guide for the people who make it happen. It will help you map your future, identify the critical few metrics, implement the Balanced Scorecard and create operational dashboards.
There are three different audiences for this book: the Executive Sponsor or operations manager, facilitators and consultants, and software developers.
Executive Sponsor
Balanced Scorecards and performance improvement programs don’t succeed without an executive sponsor. Members of the executive leadership team and the senior managers who are team leaders should scan Parts I and II of this book to understand the timeframes and commitments involved in creating success.
Members of the executive leadership team who have heard the term Balanced Scorecard may not know what it takes to drives strategic success with a Balanced Scorecard. They can scan Part I to see what is involved. It takes time and com-mitment from the executive leadership team.
Two telephone calls from senior managers remind me that many do not know what is involved in creating a Balanced Scorecard or how it affects an organiza-tion when correctly implemented. In one telephone call, the manager asked me, “We’re having a two-day corporate retreat for the executive leadership team. Could you do a Balanced Scorecard for us in two hours?”
Another call illustrated the business buzz-word effect. A manager, whose division executive had heard about a Balanced Scorecard being used at a phar-maceutical competitor called. He had been tasked to “Go put together a Balanced Scorecard for the division in the next week.”
Neither of these cases had executive commitment or the timeframes sary to create a Balanced Scorecard that drives success and creates a culture of high performance.
neces-Facilitators and Consultants
Facilitators and consultants are vital to creating a Balanced Scorecard or tional dashboard. They are the guides who help the executive leadership team and managers through sticky spots. When discussions get too easy because no one is asking the hard questions, the facilitator has to be able to step in and
</div><span class="text_page_counter">Trang 26</span><div class="page_container" data-page="26"><b>opera-xxiv Introduction</b>
ask the probing question that puts a tough issue in the spotlight, so it will be addressed. It is imperative, especially in the case of strategic Balanced Scorecards, to have a consultant who has no agenda and who is politically impartial.
Software Developers
The majority of Balanced Scorecards and operational dashboards are created in Microsoft Excel. You don’t need to be an Excel Visual Basic guru to build them when you know the correct combination of worksheet functions. Part III contains most of the building blocks for creating and maintaining powerful scorecards and dashboards.
Build a Scorecard or Dashboard You Can MaintainNote:
<small>Part III contains the methods and tools necessary for building powerful sion making aids in Excel. But there is more to building them than just a few techniques. Make sure your Excel developer knows how to build systems that can be easily maintained and updated. Whether you use an internal or exter-nal developer, make sure he documents the system and shows others how to maintain it. </small>
deci-Additional skills the software developer needs are the abilities to interview users to discover their needs, understand what is critical in a business pro-cess, design user interfaces, build maintainable architectures, and integrate live data.
How This Book Is Organized
<i>Balanced Scorecards and Operational Dashboards in Excel</i> has three parts. Part I covers the steps and processes required for building a Balanced Scorecard to execute strategy. Part II introduces the basics of mapping operational processes and identifying critical metrics. Part III shows intermediate-to-advanced Excel users techniques specific to creating dashboards.
Part I
Part I describes the journey of building and rolling out the Strategy Map and Balanced Scorecard that is used by over 50 percent of Fortune 1000 companies and more than 70 percent of international corporations. It begins with an over-view of the tools commonly used to develop organizational strategy. A chapter is devoted to building the Strategy Map, the diagram that visually defines the
</div><span class="text_page_counter">Trang 27</span><div class="page_container" data-page="27"><b>Introduction xxv</b>
strategic themes on which the organization will focus and the objectives that will drive success. The next chapter describes how the Strategy Map must be converted to an action plan that details the initiatives to reach success, and the metrics required to keep those initiatives on track and on time. Once the metrics are defined, then the Balanced Scorecard can be developed and used — not just as a dashboard for strategic progress, but as a core mechanism to guide ongoing strategy meetings. The last chapter describes some of the communication and rollout processes necessary to communicate the change.
Part II
Part II is only three chapters long, but it describes a few methods of mapping operations, such as process maps and economic value maps, and how to use them to identify the critical few metrics that drive an operation and measure its success.
Part III
Part III gives many specific examples of how to use Excel to build Balanced Scorecards and operational dashboards. Excel is the most widely used business analysis and graphics tool in the world; the majority of Balanced Scorecards and operational dashboards in the world are built using it. Scorecards and dashboards in Excel do not need to use Visual Basic for Applications, but they do need a good architecture, and they require a few little-known worksheet functions.
Free Resources That Extend This Book
There is much more to executing strategy and creating high performance than will fit in this book. Newsletters, articles, tools, video demonstrations, and soft-ware are available free of charge at <small>www.torconsulting.com</small>.
Download Free Excel Sample Files
The Excel training examples and operational dashboards featured in Part III are available for free download by going to the author’s web site or the publisher’s web site:
<small>www.wiley.com/go/scorecardsanddashboardswithexcel</small>
</div><span class="text_page_counter">Trang 28</span><div class="page_container" data-page="28"><i>To stay ahead of your competition and to get performance tune-ups, sign up for </i>
<i>The newsletter, the newsletter for improving organizational performance. The </i>
<i>news-letter</i> contains practical tips on building a high performance in small- and mid-sized businesses and strategic business units. Sign up at <small>www.torconsulting.com</small>.
Consulting and In-House Workshops
No book can convey all the lessons learned through years of experience. And books certainly can’t build the dynamic interaction that creates valuable insights among leaders and buy-in among employees. In today’s fast-moving, competi-tive environment, you need timely solutions that work right the first time.
We work with executive leadership teams, executive sponsors, tion teams, and IT developers to build and roll out Balanced Scorecards and operational dashboards. We can help you with all the processes and software described in this book, and more — and we can transfer that knowledge to your people through workshops and mentoring.
<b>implementa-Use a Balanced scorecard consUltant certIfIed By the foUnders of the Balanced scorecard</b>
<small>Your organization’s success may depend upon the validity and the tation of your Balanced Scorecard. Only a few independent consultants are certified each year through the Balanced Scorecard Collaborative, the educa-tional division of Drs. Kaplan and Norton consulting firm. To learn more about how a certified Balanced Scorecard consultant can help you, call Ron Person at Tor Consulting.</small>
<small>implemen-(The consultative and facilitative methods described in this book are those developed by the author and have not been certified or vetted by the Palladium Group or the Balanced Scorecard Collaborative.)</small>
</div><span class="text_page_counter">Trang 29</span><div class="page_container" data-page="29"><b>Introduction xxvii</b>
Balanced Scorecard Consulting and Workshops
Our purpose is to help your organization execute its strategy. We can help you do that with:
Consulting through the entire Balanced Scorecard or operational <small>■</small>
manual updates or database integration
<b>clIents receIve a fUll-featUred excel-Based Balanced scorecard or operatIonal dashBoard</b>
<small>Our consulting engagements usually include a fully functioning Balanced Scorecard or operational dashboard. These systems can either use manually updated data or be integrated with your data sources.</small>
Balanced Scorecard Audits and Updates
It may have been two years ago that you developed a Balanced Scorecard — haps you need to bring it up to date. Or maybe your organization has attempted to develop a Balanced Scorecard but has had less than satisfactory results. If your organization faces a situation similar to these, you may benefit from an audit of your Balanced Scorecard.
</div><span class="text_page_counter">Trang 30</span><div class="page_container" data-page="30"><b>per-xxviii Introduction</b>
Operational Dashboard Consulting and Workshops
If you need to improve operational performance, we conduct in-house shops to train teams on operational mapping methods, defining the “critical few” metrics, and developing Excel dashboards. These workshops commonly work on the actual business issues you need to resolve.
</div><span class="text_page_counter">Trang 31</span><div class="page_container" data-page="31"><b>Chapter 1:</b> Accelerating Strategic Performance
<b>Chapter 2:</b> Developing Your Strategic Foundation
<b>Chapter 3:</b> Preparing to Build Your Balanced Scorecard
<b>Chapter 4:</b> Step-by-Step to Building Your Strategy Map
<b>Chapter 5:</b> Step-by-Step from Strategy to Action
<b>Chapter 6:</b> Step-by-Step to Selecting Metrics and Setting Targets
<b>Chapter 7:</b> Step-by-Step to Developing Your Implementation Plan
<b>Chapter 8:</b> Step-by-Step to Roll-Out and Strategic Reviews
</div><span class="text_page_counter">Trang 33</span><div class="page_container" data-page="33">C h a P t e r
Accelerating Strategic Performance
<i><small>The essence of strategy is choosing what not to do.</small></i>
<small>Michael Porter</small>
The rate of change in the business world is accelerating. To get ahead — in fact, to just keep up — organizations of all types must accelerate their strategic performance.
They have to work with higher performance, more precise focus, and better strategic alignment. For this to happen, all parts of the organization must clearly understand and be firmly aligned with strategic goals.
In the last two decades, a strategic management system has been developed that enables organizations to achieve the clarity and alignment necessary to accelerate strategic performance. That system is the Balanced Scorecard.
Managing with a 500-Year-Old System
Until recently organizations have used the same accounting system to track assets and value production that was used 500 years ago in Venice, Italy. In 1494 Fra Luca Pacioli, Franciscan monk and friend of Leonardo da Vinci, wrote
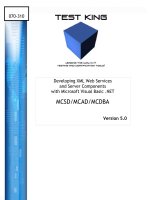
<i>Everything about Arithmetic, Geometry, and Proportions </i>(see Figure 1.1). It was the first best-selling business book to come off of Gutenberg’s printing press.
</div><span class="text_page_counter">Trang 34</span><div class="page_container" data-page="34"><b>4 Part I </b><small>n</small><b> Strategic Performance with Balanced Scorecards</b>
<small>Luca Pacioli’s Portrait, Gallery of Museum of Capodimonte, Naples</small>
<b><small>Figure 1.1: Over 500 years ago, Fra Luca Pacioli, on the left, </small></b>
<small>documented the double-entry accounting system we still use today.</small>
What made his book such a best-seller throughout Europe was that it tained detailed instructions on how the merchants of Venice kept their accounts using double-entry accounting. His book included sections on:
con-Modern accounting cycles<small>■</small>
Double-entry accounting<small>■</small>
Trial balances<small>■</small>
The reason his book blazed through the halls of commerce in Europe was because for the first time it gave businesspeople a way to value their tangible assets and measure how they were producing value. But what is surprising is that we still use the same accounting system used by the merchants of Venice 500 years ago.
The Failure of Modern Management Systems
Research by Margaret Blair of the Brookings Institute into the market value of corporations listed in the Compustat database shows that the market value of U.S. corporations has shifted significantly from tangible to intangible assets. In the
</div><span class="text_page_counter">Trang 35</span><div class="page_container" data-page="35"><b>Chapter 1 </b><small>n</small><b> Accelerating Strategic Performance 5</b>
ten years from 1982 to 1992, the contribution of intangible assets to market value has risen from 32 percent to 68 percent. As shown in Table 1.1, subsequent studies from multiple sources estimate that since 1998, intangible assets’ contribution to corporate value is approximately 85 percent.<small>1</small>
<b><small>Table 1.1: The growth of intangible asset contribution to corporate value</small></b>
How can intangible assets such as people, processes, patents, and data be monitored and managed effectively using a 500-year old system designed for use with tangible assets?
<i>Ram Charan, international consultant and co-author of Execution,</i><small>2</small> wrote an
<i>article in Fortune magazine titled “Why CEOs Fail.” In writing about highly </i>
experienced, well-known CEOs who lead their companies into failure, he said, “In the majority of cases — we estimate 70% — the real problem isn’t the high-concept boners the boffins love to talk about. It’s bad execution.”<small>3</small>
Charan goes on to write how most CEOs are hard-working, experienced, brilliant people. His research found one problem common to all the failures:
“Yes, strategy matters. A good, clear strategy is necessary for success — but not sufficient for survival. So look again at all those derailed CEOs on the cover [of the magazine]. They’re smart people who worried deeply about a lot of things. They just weren’t worrying enough about the right things: execution, decisiveness, follow-through, delivering on commitments.”
So executives and managers face two serious problems. First, the source of value production has switched from tangible assets that can be monitored with current accounting systems to intangible assets that are difficult to manage. Second, most corporations fail at executing their strategy.
A Modern Strategic Management System
In 1992 Harvard professor Robert Kaplan and consultant David Norton published the article, “The Balanced Scorecard — Measures That Drive Performance,”
<i>in the Harvard Business Review.</i><small>4</small> The ideas in this article sowed the seeds of a strategic management system to translate strategy into action, to monitor stra-tegic execution, and to align organizations around strategy.
</div><span class="text_page_counter">Trang 36</span><div class="page_container" data-page="36"><b>6 Part I </b><small>n</small><b> Strategic Performance with Balanced Scorecards</b>
Initial attempts to use the Balanced Scorecard seemed to either propel nizations to success or burden them with administrative overhead and dismal results. The difference between failure and success was often in the selection of metrics used to measure strategic execution. In 2000 Kaplan and Norton
<i>orga-published another article in the Harvard Business Review titled, “Having Trouble </i>
with Your Strategy? Then Map It.”<small>5</small> This article outlined how to build a visual map that shows the objectives and causal links necessary to execute a strategy. It was these causal links that enabled executives to identify the key metrics that drive success. The combination of these two ideas, the Strategy Map and the Balanced Scorecard, combined with more recent developments, has built a strategic management system that is an important part of modern business management.
The Strategy Map is a visual map of how an organization will execute its strategy. The Strategy Map shows the objectives needed to execute the strategy and the causal links between objectives. The Strategy Map is a tool for clear communication and helps identify the “critical few” metrics to monitor strategic execution. You can learn more about Strategy Maps in Chapter 4, “Step-by-Step to Building Your Strategy Map.”
The Balanced Scorecard is part of a system that translates strategy into action. The Balanced Scorecard gives a balanced view in four perspectives of how well an organization is driving execution and how successful the results are. The four perspectives in the Balanced Scorecard and Strategy Map give executives a more balanced view of their organizations, going beyond financial measures to include finance, customer and marketplace, internal operations, and learn-ing and growth — which includes people, culture, intellectual property, and IT infrastructure.
The Strategy Map and Balanced Scorecard can take one to three years to implement in an organization, but the results can be impressive. The effects of a Balanced Scorecard are:
<b>Clarifying Strategy.</b>
<small>n</small> The discussions and thought that go into developing the Strategy Map bring clarity and understanding to the executive team in terms of the strategy and interplay between departmental silos. The graphical Strategy Map pinpoints for employees how they contribute to strategic success.
<b>Translating Strategy into Action and Executing It.</b>
combined with a Tactical Action Plan and Implementation Plan, give a clear roadmap to everyone showing how the strategy will be translated into action. The Balanced Scorecard is used to stay on track and to moni-tor execution.
</div><span class="text_page_counter">Trang 37</span><div class="page_container" data-page="37"><b>Chapter 1 </b><small>n</small><b> Accelerating Strategic Performance 7Aligning Business Units around the Strategy.</b>
develop “silos,” functional departments or divisions that are more cerned with their own success than they are with achieving success for the entire organization. But developing the Strategy Map and Tactical Action Plan requires that the walls between silos come down. Focusing on Strategic Themes forces departments to work together, breaking down silos even more.
<b>con-Communicating the Strategy to All Levels.</b>
the Balanced Scorecard through the organization gives each level the opportunity to contribute to organizational success. It gives executives the ability to communicate with functional managers about how to achieve strategic goals. It gives functional managers the ability to provide feed-back to executives about capability and capacity.
<b>Monitoring and Managing Strategic Execution.</b>
most executive staff spend less than 10 percent of their time monitoring strategy and execution. Instead of leading through strategy, executive staff often become embroiled in operational performance, something better left to managers. Using the Balanced Scorecard as an agenda gives executive meetings a central focus on strategic leadership.
Why Use a Balanced Scorecard?
Building a Strategy Map and Balanced Scorecard for an organization follows much the same process as taking a trip to a specific location. To take a trip you need to:
Select a destination<small>■</small>
Stay on course<small>■</small>
Leading a business in our high-speed world isn’t that different from flying a high-speed jet. Imagine boarding a small jet, pausing at the entry, and asking the pilot a few questions:
<i>You: “What is our destination?”</i>
<i>Pilot: “The crew got together and talked about a destination. We couldn’t come to an exact agreement, so we decided to go somewhere out West. If something better comes up while we’re en route, we might change direction.”</i>
</div><span class="text_page_counter">Trang 38</span><div class="page_container" data-page="38"><b>8 Part I </b><small>n</small><b> Strategic Performance with Balanced Scorecards</b>
<i>You: “What route will we be taking?” (Maybe I’ll still go. It sounds adventurous, although it could be a waste of time and fuel. It shouldn’t be too dangerous.) Pilot: “Well, we aren’t sure about the exact route, but I’ve been that general direc-tion before, so I don’t need maps. I’m experienced.”</i>
<i>You: “I notice that your cockpit dashboard seems a bit sparse. There aren’t any flight instruments — just stacks of paper. How will you monitor the flight?” (This is starting to sound a bit iffy. The pilot may be experienced, but how will she com-municate her experience to the copilot, the flight engineer, the steward, the ground crew, other aircraft, and the Federal Aviation Administration?)</i>
<i>Pilot: “Well, we’re comfortable with the detail of printed reports. While we’re in flight, I can request a short stack of printed reports that give me airspeed, altitude, attitude, and heading. The copilot gets a larger stack with operational data about radio settings, fuel, hydraulics, and technical details. We have to ask for the data, but it only takes a few minutes to get new reports — so we’re in pretty good shape as long as everything stays stable and we don’t have mechanical, weather, or crew problems.”</i>
<i>You: “Sounds like quite an adventure you’re about to embark on. Sorry I won’t be able to go with you.” </i>
The metaphor isn’t that far from how some organizations manage. Many ups and high-tech companies make their strategy going after any opportunity. Although the idea of a pilot flying with reference only to printed reports seems outlandish, consider how many organizations manage while looking only at financial reports. Financials show only lagging results from efforts that may date months before. Doing this is almost the same as flying by printed reports alone.
start-We know, and recent research confirms, that executives and managers with over ten years’ experience in an industry can have a good “gut instinct” for making decisions, but how can they communicate that “gut instinct” to the hundreds or thousands of people they must lead and manage? How can employ-ees and managers without such experience understand the strategy and make good decisions?
The Strategy Map gives an organization an excellent visual tool to explain what is important for strategic success and how and where in the strategy each employee contributes. Executives and managers at multiple levels can use the Balanced Scorecard to monitor whether they are actually driving strategic suc-cess. If the results aren’t happening as planned, then the Strategy Map, Strategic Objectives, and Balanced Scorecard need to be revised until the organization has a valid model of what works.
</div><span class="text_page_counter">Trang 39</span><div class="page_container" data-page="39"><b>Chapter 1 </b><small>n</small><b> Accelerating Strategic Performance 9</b>
Building a Balanced Scorecard
The trip activities listed in the scenario in the previous section correspond to similar activities in building a Strategy Map and Balanced Scorecard, as shown in Table 1.2.
<b><small>Table 1.2: Building a Balanced Scorecard is a journey. </small></b>
<b><small>TrAvelBAlAnCed SCoreCArdInTenT</small></b>
<small>Select a destination</small>
<small>Destination StatementState in one page what your zation wants to be at the end of your strategic horizon.</small>
<small>organi-Agree on the type of trip</small>
<small>Strategic ThemesYour trip’s journey might have a theme of speed or low cost. Your Balanced Scorecard might have Strategic Themes such as customer intimacy or operational excellence. How you execute your Strategic Themes differentiates you from your competitors.</small>
<small>Agree on the route</small>
<small>Executive and Division Alignment</small>
<small>Leaders, managers, and ees must all be going in the same direction.</small>
<small>employ-Map the routeStrategy MapIdentify the route and objectives that will get you to your destination.Plan time and </small>
<small>Stay on trackBalanced ScorecardMonitor your Balanced Scorecard to make sure your organization is on track.</small>
Does the Balanced Scorecard Guarantee Business Success?
There is no killer methodology that guarantees success in business. The Strategy Map and Balanced Scorecard do not guarantee success. Organizations can still fail by having the wrong strategy, by having a poorly built Strategy Map and Balanced Scorecard, by failing to use the Balanced Scorecard once it is imple-mented, or by failing to modify the Balanced Scorecard if their hypothesis of what works is wrong.
</div><span class="text_page_counter">Trang 40</span><div class="page_container" data-page="40"><b>10 Part I </b><small>n</small><b> Strategic Performance with Balanced Scorecards</b>
I occasionally meet consultants and executives who proclaim, “We tried a Balanced Scorecard and it didn’t work.” Their perception may be true — some research shows that approximately 30 percent of Balanced Scorecard attempts fail.
There are many reasons for failure, and the Balanced Scorecard fails in panies for a variety of reasons. Some of the most common are:
<b>com-Lack of senior executive commitment.</b>
<small>n</small> An executive at the highest level in the strategic business unit must sponsor the Balanced Scorecard. Without the commitment of the senior executive, managers and employees feel that the Balanced Scorecard is just another “management fad of the month.” The senior executive must make a case for change in the organization that will light a fire under everyone.
<b>Lack of a case for change.</b>
<small>n</small> Organizations are difficult to change. The Balanced Scorecard is used to create a culture of high performance, trans-lating strategy into action. Without a driving need for change, and an organization-wide awareness of the need, the Balanced Scorecard will become just another performance management system that will fade.
<b>Lack of an experienced consultant or facilitator.</b>
imple-menting a Balanced Scorecard is difficult. It is critical to use an enced facilitator or consultant to guide initial development and to train internal facilitators and managers who can carry on the work. You are betting the strategic success of your organization on this effort. You don’t
<i>experi-want to use a general business consultant who has read a book or Harvard </i>
<i>Business Review</i> article on Balanced Scorecards. There are many bear traps to avoid, and you want someone who knows how to avoid them.
<b>Too many metrics. </b>
<small>n</small> Too many metrics can create a confusing model of what drives strategic success. The Balanced Scorecard becomes an Operational Dashboard.
perfor-Some executives and consultants have asked me if the Balanced Scorecard replaces Six Sigma, if it’s more productive than LEAN, or if it coordinates proj-ects better than a Project Management Office. A Balanced Scorecard does not
</div>


![iphone with microsoft exchange server 2010 [electronic resource] business integration and deployment](https://media.store123doc.com/images/document/14/y/ee/medium_eez1401381274.jpg)