analysis of the financial report of hoa phat group from 2017 2021
Bạn đang xem bản rút gọn của tài liệu. Xem và tải ngay bản đầy đủ của tài liệu tại đây (1.84 MB, 25 trang )
<span class="text_page_counter">Trang 1</span><div class="page_container" data-page="1">
ANALYSIS OF THE FINANCIAL REPORT OF HOA PHAT GROUP
Lecturer: Nguyen Quang Minh Nhi
THE UNIVERSITY OF ECONOMICS – UNIVERSITY OF DANANG COURSE: CORPORATE FINANCE
Group 1 46K01.2 –1. Truong Ngoc Dieu An2. Vo Thi Thien An 3. Bui Le Nhu Hoa 4. Tran Thi Thao Nhi 5. Huynh Trong Tin
</div><span class="text_page_counter">Trang 2</span><div class="page_container" data-page="2">II/ CAPITAL STRUCTURE RATIOS ... 6
1. Total debt ratio ... 6
4. Days’ sales in receivable ... 11
5. Fixed asset turnover ... 12
6. Total asset turnover ... 13
IV/ PROFITABILITY RATIOS ... 14
1. Profit margins ... 14
2. ROA ... 15
3. ROE ... 16
4. ROI ... 17
V/ MARKET VALUE RATIOS ... 18
1. Earnings per share ... 18
2. Price / earnings ratio ... 19
3. Market- -book ratio ... to 20 C. SUMMARY OF THE FINANCIAL PERFORMANCE OF HOA PHAT ... 21
D. EVALUATION FORM ... 22
E. APPENDIX ... 22
F. REFERENCES ... 23
</div><span class="text_page_counter">Trang 3</span><div class="page_container" data-page="3">Group 1 Hoa Phat Group
2
<b>A. Description of company 1. Company name: </b>Hoa Phat Group - HPG
<b>2. Type of business structure: </b>Corporation<b> 3. Ownership/management team </b>
- Ơng Trần Đình Long (Chairman of the board of directors); - Ơng Dỗn Gia Cường (Vice Chairman of the Board of Directors); - Ông Nguy n M nh Tu n (Vice Chairman of the Board of Directors); ễ ạ ấ- Ông Trần Tuấn Dương (Vice Chairman of the Board of Directors)- Ơng Hồng Quang Việt (Member of the Board of Directors)- Ông Nguy n Ng c Quang (Member of the Board of Directors) ễ ọ
- Ông Nguy n Vi t Th ng (General Manager/Member of the Board of Directors) ễ ệ ắ- Bà Nguy n Th ễ ị Thảo Nguyên (Deputy General Manager)
- Bà Ph m Th Kim Oanh (Chief Accountant/ Chief Financial Officer) ạ ị- Bà Bùi Th H i Vân (Heị ả ad of the Board of Supervisors)
- Bà Lê Minh Th y (Member of the Board of Supervisors) ủ- Bà Ngô Lan Anh (Member of the Board of Supervisors)
- Bà Thái Th L c (Member of the Board of Supervisors) (Hoa Phat Group) ị ộ
<b>4. Location: </b>Pho Noi A Industrial Zone, Giai Pham Ward, Yen My District, Hung Yen Province (Hoa Phat Group).
<b>5. Company history </b>
- 1992: Established Hoa Phat Equipment and Accessories Co., Ltd. - The first company of Hoa Phat brand.
- 2004: Established Hoa Phat Trading Co., Ltd
- February 2017: Established Hoa Phat Dung Quat Steel Joint Stock Company, deploying Hoa Phat Dung Quat Iron and Steel Integrated Complex in Quang Ngai Province.
</div><span class="text_page_counter">Trang 4</span><div class="page_container" data-page="4">Group 1 Hoa Phat Group
Hoa Phat maintained and continued to affirm its No.1 position in terms of market share in Vietnam with over 31% market share. With a record output is the most successful affirmation of Hoa Phat steel in investing in expanding production in the direction of focusing on products and optimizing the value of the product chain from steel. Nowadays, Hoa Phat is gradually transforming digitally with effective and responsive overall management solutions use of information technology in management organization.
<b>9. Target markets </b>
• External customers: Business related to steel, billet, household goods manufacture; shipyards; irrigation, road construction; construction contractors; etc. not only in Vietnam but also in ASEAN, and even some foreign markets such as JIS (Japan), ASTM (USA), BS EN (UK) …This group of customers requires high standards of size and volume (AMIS MISA, 2022). • Internal customers: These are member companies of Hoa Phat group such as steel company, equipment parts company, refrigeration company, furniture company. Although the number of internal customers cannot be compared with external customers, they are loyal and long-term users of the company's products (AMIS MISA, 2022).
<b>10. Key competitors </b>
Hoa Phat’s competitors can be listed as VNSteel, Vina Kyoei, Pomina, PY Vina, TISCO,... who are big and reputable steel manufacturer (Brade Mar, 2022).
</div><span class="text_page_counter">Trang 5</span><div class="page_container" data-page="5">Group 1 Hoa Phat G
<b>B. ANALYSIS OF FINANCIAL STATEMENTS OF HOA PHAT GROUP I/ LIQUIDITY RATIOS </b>
Current ratio
</div><span class="text_page_counter">Trang 6</span><div class="page_container" data-page="6">Group 1 Hoa Phat G
short-term liabilities. However, the current ratio can only be determined at any point in time about a business's ability to pay its de"outline" will not reflect the long-term solvency of the business. that profession.
<b>2. Quick ratio =</b><small>𝒄𝒖𝒓𝒓𝒆𝒏𝒕 𝒂𝒔𝒔𝒆𝒕𝒔−𝒊𝒏𝒗𝒆𝒏𝒕𝒐𝒓𝒚𝒄𝒖𝒓𝒓𝒆𝒏𝒕 𝒍𝒊𝒂𝒃𝒊𝒍𝒊𝒕𝒊𝒆𝒔</small>
<b>Year <sup>Current assets </sup>(mil VND) </b>
<b>Current liabilities (mil VND) </b>
<b>Inventory (mil VND) </b>
<b>Quick ratio </b>
Compared to the industry average quick ratio in 2021 of 0.39%, the company's ratio is more than double with 0.708%. That showis completely capable of paying off the company's short-term debts immediately.
Quick ratio
</div><span class="text_page_counter">Trang 7</span><div class="page_container" data-page="7">Group 1 Hoa Phat G
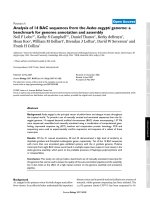
<b>II/ CAPITAL STRUCTURE RATIOS 1. Total debt ratio =</b><small>𝒕𝒐𝒕𝒂𝒍 𝒂𝒔𝒔𝒆𝒕𝒔−𝒕𝒐𝒕𝒂𝒍 𝒆𝒒𝒖𝒊𝒕𝒚</small>
<small>𝒕𝒐𝒕𝒂𝒍 𝒂𝒔𝒔𝒆𝒕𝒔</small>
<b>Year <sup>Total assets </sup>(mil VND) </b>
<b>Total equity (mil VND) </b>
<b>Total debt ratio (%) </b>
As we can see, this ratio increased gradually from 38.9% in 2017 to 55.0% in 2020, which means the firm needed to use more dassets as a proportion year by year. After that, this ratio decreased to 49.1% in 2021 due to the significant increase of total assets brise of total debt, which means the company operations were less dependent on debt.
In these 5 years, these ratios were all lower than the average total debt ratios of the steel industry which were 52.73%, 55.87%, 57.52.91% respectively. It can be seen that in 2017, the difference between the average data (52.73%) and the actual one (38.9%) wwhich could be implied that the company didn’t take the advantage of financial leverage as well as its peers. Therefore, in the newould notice the increase in using debt to finance for the total assets, and from 2018 to 2021, these ratios became nearly equal tdata of the industry, which could mean the company put their effort into using financial leverage effectively to gain more return.
Total debt ratio (%)
</div><span class="text_page_counter">Trang 8</span><div class="page_container" data-page="8">Group 1 Hoa Phat G
<b>2. Debt/equity ratio =</b> <small>𝒕𝒐𝒕𝒂𝒍 𝒅𝒆𝒃𝒕𝒕𝒐𝒕𝒂𝒍 𝒆𝒒𝒖𝒊𝒕𝒚</small><b> </b>
<b>Year <sup>Total debt </sup>(mil VND) </b>
However, during the period 5 years except 2017, Hoa Phat tried to balance the usage of debt and equity which can be seen froequal-1 of the data. Compared to the average debt to equity ratio of steel industry which were 1.1155, 1.2658, 1.3340, 1.3180, 1.123
Debt/equity ratio
</div><span class="text_page_counter">Trang 9</span><div class="page_container" data-page="9">Group 1 Hoa Phat G
from 2017 to 2021, the data of Hoa Phat Corporation were all lower. Similar to debt ratio, in 2017, it was much lower than avindustry. Because, compared to peers it was mainly funded by equity, but the gap has narrowed in the following years, which couldthat the company has had a tendency to depend more on debt than on equity.
<b>III/ TURNOVER RATIOS </b>
Inventory turnover (times)
</div><span class="text_page_counter">Trang 10</span><div class="page_container" data-page="10">Group 1 Hoa Phat G
to sell, leading to a lot of inventory, causing the ratio to drop. From 2019 to 2021, the ratio has increased or decreased, fluctsignificantly, still remained at a stable level, showing that the company's business activities are keeping at a stable level. The industry average in 2021 reached 3.6 times, the company's ratio that year is lower with 3.174 times. This is a sign that tbusiness is not doing well, the sales volume is not high or the inventory is still high. The company needs to have trade promotiopromote the exchange of goods, to free up inventory so that it can find better signs in the company's business activities in the com
<b>2. Days’ sales in inventory =</b> <small>𝟑𝟔𝟓 𝒅𝒂𝒚𝒔𝒊𝒏𝒗𝒆𝒏𝒕𝒐𝒓𝒚 𝒕𝒖𝒓𝒏𝒐𝒗𝒆𝒓</small>
<b>Year <sup>Inventory turnover </sup>(times) </b>
<small>20172018201920202021</small>Days' sales in inventory (days)
</div><span class="text_page_counter">Trang 11</span><div class="page_container" data-page="11">Group 1 Hoa Phat G
However, compared to the industry average in 2021 with the ratio at 101.50 days, the firm has a higher ratio at 115.011 days. Ththe company's trade flow is stable but still not really effective. The company needs to accelerate sales, expand the scope of goods it can shorten the company's inventory liquidation ratio.
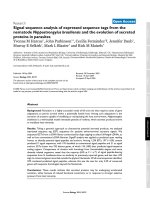
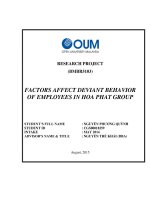
<b>3. Receivable turnover =</b> <small>𝒔𝒂𝒍𝒆𝒔𝒂𝒄𝒄𝒐𝒖𝒏𝒕𝒔 𝒓𝒆𝒄𝒆𝒊𝒗𝒂𝒃𝒍𝒆</small><b> </b>
<b>Year Sales (mil VND) <sup>Account receivable </sup><sub>(mil VND) </sub><sub>turnover (times) </sub><sup>Receivable </sup></b>
The bar chart above shows the change in the company's receivable turnover ratio in the 5 years from 2017 to 2021. It can be clearthe first 2 years of 2017 and 2018, the company's ratio was at a low level (10.315 times and 11.435 times) compared to industr16.47 times and 13.06 times, indicating that the company has a poor collection process, a bad credit policy or the inability of itspay. Often a company with a low receivables turnover ratio should revise its credit policy to ensure a timely recovery. However, from 2018 to 2019, the company saw a spike in its receivable turnover from 11.435 times to 18.801 times, doubling inIt can be seen that, after noticing bad signals from low receivable turnover in previous years, the company has focused on adjus
Receivable turnover (times)
</div><span class="text_page_counter">Trang 12</span><div class="page_container" data-page="12">Group 1 Hoa Phat G
policy to become more effective. That has made the ability to collect receivables and debts from customers become more effectivthe increase in revenue nearly 10 times higher than the increase in receivables. The high receivables turnover ratio also shows thais cautious in granting credit to customers. A prudent credit policy can be beneficial because it helps a company to somewhat prerisk.
From 2019 to 2021, this ratio of the company remains high and tends to increase. By 2021, the company's receivable turnover rattimes. It can be seen that the company's credit policy is more interested in adjusting and perfecting to achieve the highest benefto the industry average of 21.27 times, the company's ratio is slightly better, which is a good sign to assess that the company's cappropriate and beneficial to the company.
<b>4. Days’ sales in receivable =</b> <small>𝟑𝟔𝟓 𝒅𝒂𝒚𝒔𝒓𝒆𝒄𝒆𝒊𝒗𝒂𝒃𝒍𝒆 𝒕𝒖𝒓𝒏𝒐𝒗𝒆𝒓</small><b> </b>
Days’ sales in receivable is calculated as the average number of days it takes a company to collect cash payments after sales ha(Kenton, 2022).
<b>Year <sup>Receivable turnover </sup>(times) </b>
Days' sales in receivable (days)
</div><span class="text_page_counter">Trang 15</span><div class="page_container" data-page="15">Group 1 Hoa Phat G
<b>Year <sup>Sales (mil </sup>VND) </b>
<b>Total asset (mil VND) </b>
<b>Total asset turnover (times) </b>
Total asset turnover (times)
Profit Margin (%)
</div><span class="text_page_counter">Trang 16</span><div class="page_container" data-page="16">Group 1 Hoa Phat G
Profit margin is the percentage indicating how many VND of profit Hoa Phat has generated for each VND of sale (Segal, 2022). Looking in the table, we can see that there was a trend of decline of profit margin in the period from 2017 to 2019, and thenincreased in the period 2019 to 2021, up to almost 2 times (2021 to 2019). In the year 2019, net income is the lowest because thsteel industry faces a stormy reality, with the raw prices of Steel-making fuels such as iron ore, coals and selling prices of Stfluctuating very sensitive to the world market, difficult to predict and mostly stay in the high ranges. High sales, but the value is rso net income is not very high. Even though sales gradually increase over the years, the drop in net income leads to the profit mbeing the lowest. In comparison with 2019, each VND in sales of Hoa Phat in 2021 generated more profit, which meant an ueffectiveness of cost management. And Hoa Phat the profit margin is slightly higher than the industry’s average which is 0.22 scontinue to accelerate the distance higher.
ROA is a financial ratio that indicates how profitable a company is in relation to its total assets (Hargrave, 2022).
This chart illustrates the proportion of the return on assets of Hoa Phat between 2017 and 2021. Overall, there was a gradual declinbetween 2017 and 2019. Starting at 18.6% in 2017, Hoa Phat’s ROA ratio witnessed a decrease of 18.6%, and 13.1% in 20
ROA (%)
</div><span class="text_page_counter">Trang 17</span><div class="page_container" data-page="17">Group 1 Hoa Phat G
respectively, before ending the period at 8.4% in 2019. This phenomenon described the fact that Vinamilk's assets were not reeffectively in the period between 2017 to 2019, especially in 2029 when the net income has a major decrease because of the highvalue of finished goods, plus the spike in the material prices. After that is a considerable comeback, rising from 8.4% to 22.3% in And in 2021, Hoa Phat’s ROA is higher than the industry’s average ROA in the same year which is 19.9%. This shows that in th
<b>2019 to 2021 Hoa Phat has exploited its assets significantly more effectively. </b>
<b>3. ROE =</b><small>𝑵𝒆𝒕 𝑰𝒏𝒄𝒐𝒎𝒆𝑻𝒐𝒕𝒂𝒍 𝑬𝒒𝒖𝒊𝒕𝒚</small><b>× 𝟏𝟎𝟎% </b>
<b>Year <sup>Total equity </sup>(mil VND) </b>
ROE is a financial ratio that indicates how profitable a company is in relation to its total assets (Fernando, 2022).
The profit generated by using the equity in the year 2019 has a drop, an immense rise of almost 1.8 times in the next year, 202equity has steadily increased in the period 2017 to 2020, and in the year 2021, there is a spike of 1,4 times equity compared to 20equity kept increasing, the drop in the profit in the year 2019 brought a noticeable decrease in the ROE ratio, which means thequity wasn’t being managed effectively in 2019. And Hoa Phat’s ROE is slightly higher than the industry’s average in the yearyears after Hoa Phat shows that equity was used more effectively than in the previous period.
ROE (%)
</div><span class="text_page_counter">Trang 18</span><div class="page_container" data-page="18">Group 1 Hoa Phat G
ROI is a profitability metric used to evaluate how well an investment has performed (Fernando, 2022).
Observing the chart, there is an overall decline in the profit generated by using the equity of Hoa Phat in the period 2017 to 201in 2017 to 10.8% in 2019, and quickly increased in the period after, from 2019 to 2021, with 10.8%, 14.7%; and 24.3% in 2019, 2respectively. The assets increase accordingly year by year, while EBIT's sudden drop in 2019 because of the rise in the materstaying in the high ranges, has led to a decline in the ROI ratio. Hoa Phat has not been managing the shareholder’s money prophave not taken full advantage of it for investments to increase the shareholder’s assets. But they have managed to turn back in 20which shows progress in managing the money of Hoa Phat.
ROI (%)
</div><span class="text_page_counter">Trang 19</span><div class="page_container" data-page="19">Group 1 Hoa Phat G
<b>V/ MARKET VALUE RATIOS </b>
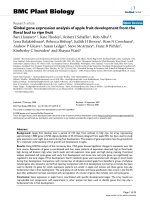
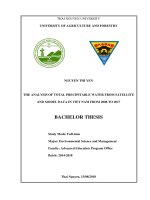
<b>1. Earnings per share =</b><small>𝒑𝒓𝒐𝒇𝒊𝒕 𝒂𝒕𝒕𝒓𝒊𝒃𝒖𝒕𝒂𝒃𝒍𝒆 𝒕𝒐 𝒐𝒓𝒅𝒊𝒏𝒂𝒓𝒚 𝒔𝒉𝒂𝒓𝒆𝒉𝒐𝒍𝒅𝒆𝒓𝒔𝒏𝒖𝒎𝒃𝒆𝒓 𝒐𝒇 𝒐𝒓𝒅𝒊𝒏𝒂𝒓𝒚 𝒔𝒉𝒂𝒓𝒆𝒉𝒐𝒍𝒅𝒆𝒓𝒔</small>
<b>Year </b>
<b>Profit attributable to ordinary shareholders (mil </b>
<b>VND) </b>
<b>Number of ordinary shares in issue (shares) </b>
<b>Earnings per share (VND) </b>
EPS is the portion of a company’s profit that is allocated to every individual share of the stock (Economictimes).
As clearly as it can be seen, from 2017 to 2019, EPS of Hoa Phat decreased considerably from nearly 6,000 VND to less than 3,0fall in EPS indicates that there was a significant decrease in profit that the firm attributed to ordinary shareholders. The reasons fboth the increase of the numbers of ordinary shares and the decrease in profit that the firm attributed to ordinary shareholders of tHowever, after that period, the EPS of Hoa Phat recovered and started to increase. After one year, 2020, EPS increased from 2And at the end of the next year, 2021, EPS reached 7,166, which almost doubled compared to the previous year. This shows therise in the profit attributable to ordinary shareholders. As EPS increased, the investment in the company is perceived to be more is considered a savvy endeavor.
Earnings per share (EPS) (VND)
</div><span class="text_page_counter">Trang 20</span><div class="page_container" data-page="20">Group 1 Hoa Phat G
Compared to the average EPS of the steel industry, which were 5.751, 3.508, 2.179, 3.739, 8.133 respectively, the one of Hoa Phigher, except for the year of 2021 even though the profit attributed in this year had increased more than two times compared proved that both Hoa Phat and the steel industry of Vietnam had a booming year and a promising potential for development in 20
<b>2. Price / earnings ratio =</b> <small>𝒑𝒓𝒊𝒄𝒆 𝒑𝒆𝒓 𝒔𝒉𝒂𝒓𝒆𝒆𝒂𝒓𝒏𝒊𝒏𝒈𝒔 𝒑𝒆𝒓 𝒔𝒉𝒂𝒓𝒆</small>
<b>Year <sub>share (VND) </sub><sup>Price per </sup><sup>Earnings per </sup><sub>share (VND) </sub><sup>Price/earnings </sup><sub>ratio (times) </sub></b>
In relation to the average P/E ratio of the industry, the one of Hoa Phat is usually higher, except for the year of 2021. This shoperiod from 2017 - 2020, Hoa Phat might have not operated its business as efficiently as other competitors in the field. Another
Price/earning ratio
</div>