study on synthesis of nitrogen doped graphene quantum dots and their optical properties
Bạn đang xem bản rút gọn của tài liệu. Xem và tải ngay bản đầy đủ của tài liệu tại đây (3.75 MB, 131 trang )
<span class="text_page_counter">Trang 1</span><div class="page_container" data-page="1">
VIET NAM NATIONAL UNIVERSITY HO CHI MINH CITY
<b>HO CHI MINH CITY UNIVERSITY OF TECHNOLOGY </b>
TRUONG TUNG KHUONG
<b>STUDY ON SYNTHESIS OF NITROGEN-DOPED GRAPHENE QUANTUM DOTS AND THEIR OPTICAL </b>
</div><span class="text_page_counter">Trang 2</span><div class="page_container" data-page="2">THIS THESIS IS COMPLETED AT
HO CHI MINH CITY UNIVERSITY OF TECHNOLOGY – VNU-HCM
<b>Supervisor: Assoc. Prof. Dr. Tran Van Khai ……….. </b>
(Please fill in the supervisor’s full name, academic rank and signature)
<b>Examiner 1: Assoc. Prof. Dr. Ha Thuc Chi Nhan ……….. </b>
(Please fill in the examiner’s full name, academic rank and signature)
<b>Examiner 2: Dr. Vo Nguyen Dang Khoa ……….. </b>
(Please fill in the examiner’s full name, academic rank and signature)
This master’s thesis was defended at HCM City University of Technology, VNU- HCM City on December 14<small>th</small>, 2023.
Master’s Thesis Committee:
(Please write down the full name and academic rank of each member of the Master’s Thesis Committee)
1. Chair of Thesis Committee: Assoc. Prof. Dr. Nguyen Nhi Tru 2. Examiner 1: Assoc. Prof. Dr. Ha Thuc Chi Nhan
3. Examiner 2: Dr. Vo Nguyen Dang Khoa 4. Commissioner: Dr. Tran Thanh Tam
5. Secretary: Assoc. Prof. Dr. Pham Trung Kien
Approval of the Chair of Master’s Thesis Committee and Dean of Faculty of Materials Technology after the thesis is corrected (If any).
<b>CHAIR OF THESIS COMMITTEE </b>
(Full name and signature)
<b>DEAN OF FACULTY OF MATERIALS TECHNOLOGY </b>
(Full name and signature)
<b>Assoc. Prof. Dr. Nguyen Nhi Tru </b>
</div><span class="text_page_counter">Trang 3</span><div class="page_container" data-page="3">VIETNAM NATIONAL UNIVERSITY HO CHI MINH CITY
<b>HO CHI MINH CITY UNIVERSITY OF TECHNOLOGY </b>
<b>SOCIALIST REPUBLIC OF VIET NAM Independence - Freedom - Happiness </b>
<b>MASTER'S THESIS ASSIGNMENT </b>
Student’s full name: Truong Tung Khuong Student ID: 2170184 Date of birth: November 2nd, 1996 Place of birth: Tien Giang
<i>Ho Chi Minh City, ………….………….…. 2023 </i>
<b>Assoc. Prof. Dr. Tran Van Khai Assoc. Prof. Dr. Tran Van Khai </b>
<b>DEAN OF FACULTY OF MATERIALS TECHNOLOGY</b>
</div><span class="text_page_counter">Trang 4</span><div class="page_container" data-page="4"><b>ACKNOWLEDGEMENTS </b>
Firstly, I would like to express my deepest gratitude to my thesis supervisor, Assoc. Prof. Dr. Tran Van Khai, for his sage guidance, profound wisdom, and patient mentorship during the research process. His scholarly dedication has been a guiding light throughout this research journey. I am also thankful to the members of my thesis committee for their valuable corrections and feedback that greatly enriched the quality of this work. Besides, I appreciate the support and suggestions from many of my labmates, which accelerated my experimental and writing tasks.
My sincere appreciation goes to my friends and family for their patience, encouragement, and understanding during the demanding phases of experimental work and thesis writing. Your unwavering belief in me kept me motivated.
I am grateful to Department of Metal and Alloy Materials, as well as various resources and references that have guided my understanding and provided the foundation for this thesis.
Lastly, I extend my gratitude to other individuals and organizations, whose contributions and cooperation made this research possible.
This work would not have been possible without the collective support and contributions of all those mentioned above.
Ho Chi Minh, October 2023
<b>Master's student </b>
Truong Tung Khuong
</div><span class="text_page_counter">Trang 5</span><div class="page_container" data-page="5"><b>ABSTRACT </b>
Graphene quantum dots (GQDs) have emerged as promising nanomaterials due to their unique electronic, optical, and chemical properties, making them suitable for a range of applications. This thesis focuses on synthesizing GQDs derived from graphene oxide (GO) and investigating their optical properties. The modified Hummers' method was employed to produce GO, while GQDs were obtained by using a solvothermal method with the involvement of dimethylformamide (DMF). The impacts of increasing heating temperature or interval were observed by synthesizing GQD samples with controlled conditions. The role of DMF in the synthesis procedure was clarified by comparing DMF-involved samples with reference samples in which DMF was replaced by double distilled water. Additionally, the study explored the performance of as-synthesized GQDs in the photocatalytic degradation of methylene blue (MB) solution under irradiation.
Characterization methods, including transmission electron microscopy (TEM), X-ray diffraction (XRD) and several spectroscopy techniques, like Raman, Fourier transform infrared (FTIR), UV-visible absorption and photoluminescence (PL), were employed to analyze the morphological, structural, and optical properties of the synthesized GQDs.
The PL results revealed that DMF-involved GQD solutions were dependent and showed the strongest peak with excitation of 380, 400 or 420 nm in the blue-green region. Experiments demonstrated the capability of GQDs to catalyze the photodegradation of MB solution with a degradation rate of ca. 25% after 120 minutes of exposure.
</div><span class="text_page_counter">Trang 6</span><div class="page_container" data-page="6"><b>excitation-TÓM TẮT LUẬN VĂN </b>
Chấm lượng tử graphene (GQDs) đã nổi lên như là vật liệu nano hứa hẹn do tính chất điện tử, quang học và hóa học độc đáo của chúng, làm cho chúng phù hợp cho nhiều ứng dụng khác nhau. Luận văn này tập trung vào việc tổng hợp GQDs từ graphene oxit (GO) và nghiên cứu về tính chất quang học của chúng. Phương pháp Hummers cải tiến đã được sử dụng để chuẩn bị GO, trong khi GQDs thu được thông qua phương pháp solvothermal với sự tham gia của dimethylformamide (DMF). Ảnh hưởng của việc tăng nhiệt độ hoặc thời gian gia nhiệt đã được khảo sát thông qua việc tổng hợp các mẫu GQD với điều kiện kiểm soát. Vai trị của DMF trong quy trình tởng hợp đã được làm rõ bằng cách so sánh các mẫu thử nghiệm có sự tham gia của DMF với các mẫu tham chiếu mà DMF được thay thế bằng nước cất hai lần. Ngồi ra, các thí nghiệm đã khám phá hiệu quả của GQDs trong quá trình phân hủy của dung dịch methylene blue (MB) dưới điều kiện chiếu sáng.
Các phương pháp phân tích, bao gồm kính hiển vi điện tử truyền qua (TEM), nhiễu xạ tia X (XRD) và một số phương pháp phổ như Raman, Fourier chuyển đổi hồng ngoại (FTIR), hấp thụ tử ngoại – khả kiến và quang phát quang (PL), đã được sử dụng để phân tích tính hình thái, cấu trúc và tính chất quang học của GQDs được tởng hợp.
Kết quả PL cho thấy rằng các dung dịch GQD có sự tham gia của DMF thể hiện sự phụ thuộc vào bước sóng kích thích và có đỉnh phát xạ mạnh nhất trong vùng ánh sáng lam-lục với sóng kích thích là 380, 400 hoặc 420 nm. Các thí nghiệm đã chứng minh khả năng của GQDs để xúc tác quá trình quang phân hủy của dung dịch MB với tỷ lệ phân hủy khoảng 25% sau 120 phút chiếu sáng.
</div><span class="text_page_counter">Trang 7</span><div class="page_container" data-page="7"><b>THE COMMITMENT OF THE THESIS’ AUTHOR </b>
I hereby declare that this thesis is my original work and has not been submitted for any other degree or diploma. Any ideas, data, or information obtained from other sources have been cited and referenced appropriately. The research presented in this thesis results from my independent work, and the conclusions and recommendations are based on my own analysis and interpretation of the data. I confirm that this thesis represents my own views and opinions, and that any opinions or views expressed by others are clearly attributed. I acknowledge the support and guidance of my supervisor and committee members throughout the research process, but any errors or omissions in this thesis are my own responsibility.
<b>Thesis’s author </b>
Truong Tung Khuong
</div><span class="text_page_counter">Trang 8</span><div class="page_container" data-page="8"><b>TABLE OF CONTENTS </b>
<b>ACKNOWLEDGEMENTS ... III ABSTRACT ... IV TÓM TẮT LUẬN VĂN ... V THE COMMITMENT OF THE THESIS’ AUTHOR ... VI TABLE OF CONTENTS ... VII TABLE OF FIGURES ... XI TABLE OF TABLES ... XVII LIST OF ABBREVIATIONS... XVIII </b>
<b> OVERVIEW ... 1 </b>
<b>1.1. Introduction to graphene quantum dots ... 1 </b>
1.1.1. Graphene and graphene oxide ... 1
1.1.2. Graphene quantum dots (GQDs) ... 2
1.1.3. Light absorption ability of GQDs ... 3
</div><span class="text_page_counter">Trang 9</span><div class="page_container" data-page="9">1.4.1. Reasons for using heteroatoms to modify GQDs ... 21
1.4.2. Impacts of doping nitrogen into GQDs ... 21
<b>1.5. The photodegradation of methylene blue (MB) ... 22 </b>
1.5.1. General information about MB ... 22
1.5.2. Photocatalysis for decomposing MB ... 23
<b>1.6. Research status and urgency of research ... 25 </b>
<b>1.8. Approaches for material synthesis ... 28 </b>
<b>1.9. Novelty and major contributions ... 29 </b>
<b> FACILITIES AND EXPERIMENTS ... 30 </b>
<b>2.1. Chemicals ... 30 </b>
<b>2.2. Laboratory apparatuses for materials production and sample preparation ... 30 </b>
2.2.1. Teflon lined hydrothermal autoclave ... 30
2.2.2. Magnetic laboratory stirrer ... 31
2.2.3. Analytical balance... 32
2.2.4. UV LED panel ... 32
2.2.5. Centrifuge ... 33
2.2.6. Ultrasonic cleaning unit ... 34
2.2.7. Rotary evaporator system ... 35
</div><span class="text_page_counter">Trang 10</span><div class="page_container" data-page="10"><b>2.3. Instruments for material characterizations ... 36 </b>
2.3.1. X-ray diffraction (XRD) ... 36
2.3.2. Raman spectroscopy ... 38
2.3.3. High-resolution transmission electron microscopy (HRTEM) ... 39
2.3.4. Fourier transform infrared (FTIR) spectroscopy ... 40
<b>2.6. Testing catalytic efficiency of GQDs via the photodegradation of MB... 50 </b>
<b> SYNTHESIS AND CHARACTERIZATION RESULTS ... 52 </b>
<b>3.1. Visual results of GO synthesis ... 52 </b>
<b>3.2. Characteristics of as-synthesized GO ... 53 </b>
<b>3.3. Visual results of GQDs synthesis ... 57 </b>
<b>3.4. Size and shapes of GQDs ... 60 </b>
<b>3.5. Impacts of hydrothermal time on GQDs’s properties ... 61 </b>
3.5.1. XRD patterns of Q1, Q2, Q3, Q4 and Q2r ... 61
3.5.2. Raman spectra of Q1, Q2, Q3 and Q4 ... 62
3.5.3. FTIR spectra of Q1, Q2, Q3 and Q4 ... 65
3.5.4. UV-Vis analysis of Q1, Q2, Q3 and Q4 ... 66
3.5.5. PL results of Q1, Q2, Q3 and Q4 ... 67
3.5.6. Mechanism of PL ... 70
</div><span class="text_page_counter">Trang 11</span><div class="page_container" data-page="11">3.5.7. Mechanism of photodegradation of MB ... 76
3.5.8. Results of catalyzing the photodegradation of MB by GQDs ... 77
<b>3.6. Impacts of hydrothermal temperature on GQDs’ properties ... 81 </b>
3.6.1. XRD patterns of Q3, Q5 and Q6 ... 81
3.6.2. Raman spectra of Q3, Q5 and Q6 ... 82
3.6.3. FTIR spectra of Q3, Q5 and Q6 ... 83
3.6.4. UV-Vis analysis of Q3, Q5 and Q6 ... 84
</div><span class="text_page_counter">Trang 12</span><div class="page_container" data-page="12"><b>TABLE OF FIGURES </b>
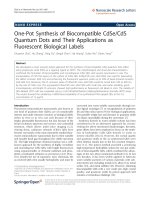
Figure 1.1. UV-Vis absorption spectra of GQDs dispersed in water, featuring an average size of 12, 17, and 22 nm, alongside a graphene sheet for comparison. The filled circles on the absorption spectra represent the positions of the absorption peaks for GQDs. The inset graph presents the relationship between the absorption peak
<i>energy and the average size of GQDs. According to Kim et al. [26]. ... 3</i>
Figure 1.2. UV−Vis spectra of GQDs A, B, and C, corresponding to synthesized reaction temperature at 120, 100, and 80°C, respectively. The inset is a photograph
<i>of these GQDs under the excitation of 365 nm UV light. According to Peng et al. </i>
[29]. ... 4
Figure 1.3. Illustrative scheme demonstrating the measured results and analysis of
<i>GQDs based on size and morphology. According to Tian et al. [31]. ... 5</i>
Figure 1.4. (a) Chart of size distributions of 4 GQDs samples determined by TEM. (b) The plots depicting band gap enlargement with the shrink of the size of GQDs;
<i>the inset shows the PL colors corresponding to the size of GQDs. According to Ye et al. [43]. ... 8</i>
Figure 1.5. Optimized structure of the smallest unit of four GQDs types (left). The graph demonstrating the energy gap as a function of the total number of conjugated carbon atoms corresponding to 4 types of morphologies (right). According to Mandal
<i>et al. [44]. ... 9</i>
Figure 1.6. Inherent effects, properties, and corresponding applications of GQDs [31]. ... 10
Figure 1.7. Proposed explanation for the roles of DOX/GQD conjugates in DOX
<i>delivery. According to Wang et al. [89]. ... 12</i>
Figure 1.8. Scheme showing the synthesis of DOX-loaded HER-labeled GQD-based nanocarriers and its drug release via cellular uptake for active targeting of breast
<i>cancer cells. According to Ko et al. [90]. ... 13</i>
</div><span class="text_page_counter">Trang 13</span><div class="page_container" data-page="13">Figure 1.9. Raw materials and two major approaches for producing GQDs [31]. ... 18
Figure 1.10. Bonding types of nitrogen atoms in N-GQDs. ... 22
Figure 1.11. The model and the structure of MB molecule [153]. ... 23
Figure 1.12. The overall statistics (based on the Scopus database) for based research in terms of (a) total number of publications (2000-2020), (b) citations of these published works (2010-2020), and (c) application fields for CQDs/GQDs (July 26, 2020) [185]. ... 25
CQD/GQD-Figure 1.13. The number of publications involving the word “graphene quantum dots” in the title, abstract, or keywords (from 2000 to 2021) [186]. Source: Scopus database. ... 26
Figure 2.1. Teflon lined hydrothermal autoclave (150 mL). ... 31
Figure 2.2. RSM-02HS magnetic laboratory stirrer. ... 31
Figure 2.3. Precisa XB 220A analytical balance. ... 32
Figure 2.4. UVZD150-Pro LED panel: (left) off and (right) on. ... 33
Figure 2.5. Z 206 A centrifuge. ... 34
Figure 2.6. MIKRO 200 centrifuge. ... 34
Figure 2.7. Ultrasonic cleaning unit TI-H-10 (Elma, Germany). ... 35
Figure 2.8 V-700 vacuum pump (left), R-215 rotary evaporator (middle), B-491 heating bath (right) provided by BUCHI. ... 36
Figure 2.9. Digital image of Bruker D2 Phaser system. ... 37
Figure 2.10. XploRA ONE™ Raman microscope (Horiba Scientific)... 39
Figure 2.11. JEM-2100F analytical electron microscope. ... 40
Figure 2.12. Platinum ATR Alpha II spectrometer (Bruker, Germany). ... 41
Figure 2.13. STECH 754N UV-Vis spectrophotometer. ... 42
</div><span class="text_page_counter">Trang 14</span><div class="page_container" data-page="14">Figure 2.14. Cary Eclipse fluorescence spectrometer and the connected computer
system. ... 43
Figure 2.15. Scheme of GO preparation. ... 45
Figure 2.16. Diagram showing 3 stages of converting bulk graphite into GO, along with sample appearances or respective micrographic pictures at each stage. Broad blue lines indicate H<small>2</small>SO<small>4</small>/HSO<small>4</small><sup> –</sup> intercalant; broad purple lines indicate a layer of the combination of H<small>2</small>SO<small>4</small>/HSO<small>4</small><sup> –</sup> intercalant with the reduced form of oxidizing agent; solid black lines represent graphene layers; dotted black lines represent single layers of GO. According to Dimiev and Tour (2014). ... 46
Figure 2.17. Scheme for synthesis procedure of GQDs. ... 47
Figure 2.18. Schematic illustrations for (a) the reaction mechanism between ∙OH and <i>hydroxyl and (b) ∙OH as a scissor to break C-C bonds, according to Tian et al. [198].</i> ... 49
<i>Figure 2.19. Hydrolysis products of DMF, according to Sun et al. [195]. ... 50</i>
Figure 2.20. Illustrating scheme of the nitrogen-doping mechanism with the products <i>of DMF hydrolysis, according to Sun et al. [195]. ... 50</i>
Figure 3.1. Digital images of (a) H<small>2</small>SO<small>4</small> - H<small>3</small>PO<small>4</small> solution, (b) reaction mixture right after adding KMnO<small>4</small>, (c) reaction mixture after heating a few hours, (d) reaction mixture naturally cooled after the heating period, (d) reaction mixture after dropping some distilled H<small>2</small>O<small>2</small> in an ice bath, and (f) the final bright yellow mixture. ... 52
Figure 3.2. Digital images of (a) centrifuge tubes of GO, (b) GO breaker for sonication, and (c) GO after sonication. ... 53
Figure 3.3. XRD patterns of graphite and prepared GO. ... 54
Figure 3.4. Raman spectrum of GO and graphite powder. ... 55
Figure 3.5. FTIR spectrum of GO. ... 56
Figure 3.6. UV-Vis spectrum of GO. ... 56
</div><span class="text_page_counter">Trang 15</span><div class="page_container" data-page="15">Figure 3.7. Digital pictures of GQD samples ... 58
Figure 3.8. Digital pictures of GQD samples dispersed in a quartz cuvette used to measure UV-Vis spectra under white neon lights (left) and a 365 nm UV light (right). ... 58
Figure 3.9. TEM images of GQDs with circular marks of some separate dots. ... 59
Figure 3.10. Size distribution of GQDs ... 60
Figure 3.11. HRTEM images of GQDs. ... 61
Figure 3.12. XRD patterns of GQDs (Q1, Q2, Q3 and Q4), GO and graphite powder. ... 62
Figure 3.13. Raman spectra of Q1, Q2, Q3 and Q4. ... 63
Figure 3.14. Illustration of DMF decomposition reaction. ... 64
Figure 3.15. Size dependence of (a) shift, (b) FWHM of the G band, and (c) peak intensity ratio (I<small>D</small>/I<small>G</small><i>) of D to G bands for GQDs. According to Kim et al. [229]. ... 65</i>
Figure 3.16. FTIR spectra of Q1, Q2, Q3, Q4 and Q2r. ... 66
Figure 3.17. UV-Vis absorption spectra of GQD samples. ... 67
Figure 3.18. PL spectra of GQDs excited by different wavelengths ranging from 360 to 480 nm (Q1, Q2, Q3, Q4 and Q2r). ... 68
Figure 3.19. Energy gap of – * transitions calculated based on DFT as a function of the number of fused aromatic rings (N). The inset illustrates the structures of the graphene molecules used for calculation. According to Eda’s group [37]. ... 70
<i>Figure 3.20. Colloidal GQDs prepared by Li et al. [246]. ... 71</i>
Figure 3.21. (a) The suggested energy levels of C<small>42</small>H<small>18</small>, C<small>96</small>H<small>30</small>, C132 and C<small>222</small>H<small>42</small>(the energy level of C132 was determined from the reported paper [246]). (b) The structures of C<small>42</small>H<small>18</small>, C<small>96</small>H<small>30</small>, C<small>132</small>H<small>34</small> and C<small>222</small>H<small>42</small><i>. According to Zhu et al. [247]. .. 72</i>
Figure 3.22. Scheme of PL of GQDs induced by the energy levels of surface state [237]. ... 73
</div><span class="text_page_counter">Trang 16</span><div class="page_container" data-page="16">Figure 3.23. Proposed energy level structures explaining the optical behaviors of photoexcited electrons in GQDs. The radiative recombination from discrete sp2-related states and continuous defect states correlates with blue and red PL, respectively. Electrons have a possibility of being thermally activated into nonradiative traps or non-radiatively relaxing from higher- to lower-lying defect
<i>states. According to Xu et al. [248]. ... 74</i>
Figure 3.24. Energy diagrams demonstrating possible mechanisms for the PL of (a) GQDs and (b) N-GQDs. The energy states between the valence and conduction bands are attributed to functional groups and/or the introduction of heteroatoms into <i>graphene core. According to Rocha et al. [250]. ... 75</i>
Figure 3.25. Mechanism for GQDs photocatalyzing the degradation of MB dye. <i>According to Kumar et al. [210]. ... 77</i>
Figure 3.26. Absorption spectra (left) and photodegradation rate of pure MB dye solution over time. ... 78
Figure 3.27. Absorption spectra of aqueous solutions of MB-Q1 over time (1st run) and the graph of C/C<small>O</small> by intervals for 3 cycles. ... 78
Figure 3.28. Absorption spectra of aqueous solution of MB-Q3 over time (1st run) and the graph of C/C<small>O</small> by intervals for 3 cycles. ... 79
Figure 3.29. Absorption spectra of aqueous solution of MB-Q4 over time (1st run) and the graph of C/C<small>O</small> by intervals for 3 cycles. ... 79
Figure 3.30. XRD patterns of Q3, Q5 and Q6. ... 81
Figure 3.31. Raman spectra of Q3, Q5 and Q6. ... 82
Figure 3.32. FTIR spectra of Q3, Q5 and Q6. ... 83
Figure 3.33. UV-Vis absorption spectra of Q3, Q5 and Q6. ... 84
Figure 3.34. PL spectra of GQDs excited by different wavelengths ranging from 360 to 480 nm (Q5 and Q6). ... 85
</div><span class="text_page_counter">Trang 17</span><div class="page_container" data-page="17">Figure 3.35. Absorption spectra of aqueous solution of MB-Q4 over time (1st run) and the graph of C/C<small>O</small> by intervals for 3 cycles. ... 86
Figure 3.36. Absorption spectra of aqueous solution of MB-Q4 over time (1st run) and the graph of C/C<small>O</small> by intervals for 3 cycles. ... 87
</div><span class="text_page_counter">Trang 18</span><div class="page_container" data-page="18"><b>TABLE OF TABLES </b>
Table 1.1. Demonstrating example of quantum yield calculation. According to Tian
<i>et al. [38]. ... 7</i>
Table 1.2. Overview of top-down synthesis methods for GQDs and their applications.
<i>According to Kumar et al. [16]. ... 19</i>
Table 1.3. Overview of bottom-up synthesis routes for GQDs and their applications.
<i>According to Kumar et al. [16]. ... 20</i>
Table 2.1. Synthesis parameters of as-synthesized samples. ... 48
<b>Table 3.1. Positions of D and G bands in Raman spectra and the respective ratio </b>
</div><span class="text_page_counter">Trang 19</span><div class="page_container" data-page="19"><b>LIST OF ABBREVIATIONS </b>
CNTs Carbon nanotubes
CQDs Carbon quantum dots
DDW Double distilled water
FTIR Fourier-transforms infrared
FWHM The full width at half maximum
GQDs Graphene quantum dots
HOMO Highest occupied molecular orbital
LED Light-emitting diode
LUMO Lowest unoccupied molecular orbital
</div><span class="text_page_counter">Trang 20</span><div class="page_container" data-page="20">β-CD β-cyclodextrin
</div><span class="text_page_counter">Trang 21</span><div class="page_container" data-page="21">Literally, graphene only consists of a flat monolayer of sp<sup>2</sup> hybridized carbon atoms arranged in a hexagonal lattice with a distance of 0.142 nm between adjacent carbon atoms [3]. It has the capability to transform into three-dimensional (3-D) graphite through stacking, one-dimensional (1-D) nanotubes by rolling [4], or even zero-dimensional (0-D) fullerenes by wrapping. Graphene possesses remarkable properties, such as exceptional electrical, mechanical, and thermal characteristics, which are attributed to its π-conjugation [5]. Graphene surpasses most materials in terms of current density and thermal conductivity. With a specific surface area of 2630 m<small>2</small>/g, comparable to activated carbon but exceeding that of carbon black (less than 900 m<small>2</small>/g) and carbon nanotubes (CNTs, ranging from 100 to 1000 m<small>2</small>/g), graphene finds extensive applications in nanosystems and nanodevices [6].
Graphene oxide (GO), a functionalized derivative of graphene obtained through graphite exfoliation, has garnered significant interest due to its impressive attributes, including mechanical stability, a large surface area, and adjustable electrical and optical properties [7-9]. GO is particularly well-suited for interactions with other molecules or materials, thanks to the presence of essential functional groups on its surface, such as hydroxyl, carboxyl, and epoxy groups. With diverse structural possibilities, GO and its composites have found applications in energy storage and
</div><span class="text_page_counter">Trang 22</span><div class="page_container" data-page="22">environmental protection, encompassing roles as photocatalysts for water splitting, water purification, and the removal of air pollutants [10-13].
<b>1.1.2. Graphene quantum dots (GQDs) </b>
Along with new publications on graphene, researchers gradually realized the limitations of graphene, including zero bandgap and low absorption ability. Therefore, research related to the structural transformation of graphene has been carried out to compensate for its inherent limitations. Among these, the successful synthesis of GQDs by Ponomarenko’s group in 2008 must be mentioned [14]. Compared to carbon quantum dots (CQDs), which are typically quasi-spherical carbon nanoparticles smaller than 10 nm, GQDs possess the structure of the graphene network inside each dot and typically have sizes below 100 nm with less than 10
<i>layers (in terms of thickness) [15]. Kumar et al. [16] reported that the size of these </i>
nanometer fragments of graphene typically ranged from 1.5 to 60 nm. To be precise, ideal GQDs have only one layer and are made up of only carbon atoms. However, in reality, synthesized GQDs still contain other elements, such as oxygen and hydrogen, and they usually have a few layers [17].
The unique structural characteristics of GQDs are accompanied by many novel properties, including unique fluorescence (due to the influence of the quantum confinement effect), which was first observed by Pan and colleagues in 2010 [18]. Additionally, compared to CNTs, GQDs have better solubility due to their large edge effect - a factor that can be adjusted through functional groups [19]. These two effects are consequences of the transition from 2D graphene to GQDs - a zero-dimensional (0D) material, with significantly altered electron distribution due to the reduction of crystal size to the nanometer level. These two effects make GQDs no longer a zero bandgap material like graphene, which has been observed in both theoretical calculations and experimental measurements. Specifically, graphene with semi-metallic properties can be transformed into semiconductor or insulator GQDs with a bandgap ranging from 0 to 6 eV by changing the 2D size or chemical properties of the surface [20-23]. Since the ability to control these properties is considered very
</div><span class="text_page_counter">Trang 23</span><div class="page_container" data-page="23">important for their potential applications, many methods for adjusting the physical and chemical properties of GQDs, including surface chemical modifications, have been experimented with [24, 25].
<b>1.1.3. Light absorption ability of GQDs </b>
The optical characteristics of QGDs are crucial when these dots are used in applications such as solar cells, bioimaging, and photocatalysis. GQDs’ optical properties are influenced by many factors like defects, doping, and the presence of surface functional groups. GQDs exhibit strong light absorption in the ultraviolet
<i>region and can also absorb in the visible region. Kim et al. [26] reported that the size </i>
of GQDs significantly affects their ultraviolet-visible (UV-Vis) absorption spectrum due to the quantum confinement effect. Accordingly, as the size of GQDs decreases, their absorption peak shifts toward shorter wavelengths, or "blue-shifts," as shown in Figure 1.1. The inset in that figure illustrates the relationship between the absorption peak energy and the average diameter of GQDs. As the diameter of GQDs increases from 5 to 35 nm, the peak energy steadily decreases from approximately 6.2 to about 4.6 eV, approaching that of a single graphene sheet.
<i>Figure 1.1. UV-Vis absorption spectra of GQDs dispersed in water, featuring an average size of 12, 17, and 22 nm, alongside a graphene sheet for comparison. The filled circles on the absorption spectra represent the positions of the absorption peaks for GQDs. The inset graph presents the relationship between the absorption peak energy and the average size of GQDs. According to Kim et al. [26]. </i>
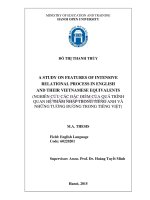
</div><span class="text_page_counter">Trang 24</span><div class="page_container" data-page="24">Importantly, the different synthesis methods of GQDs can lead to variations in their UV-Vis absorption spectra since each synthesis technique yields GQDs with distinct surface states. For instance, GQDs with a diameter of 9.6 nm synthesized via hydrothermal methods exhibit a UV absorption peak at 320 nm [18], similar to GQDs with average sizes of 3 nm and 5.3 nm obtained through a solvothermal route with dimethylformamide (DMF) as the solvent [27]. In contrast, GQDs with a 3 nm diameter, obtained by electrochemically exfoliating graphite, exhibit a characteristic π-π٭ absorption peak at 227 nm [28]. Besides, three GQD samples derived from carbon fiber with increasing reaction temperatures (80, 100 and 120<sup>o</sup>C) showed "blue-shifts" in their UV absorption spectra (Figure 1.2) [29]. The light emission of the three samples also shifted from yellow to blue hues under a 365 nm UV light as rising reaction temperature. By adjusting alkali hydroxide concentration (0.15 – 0.4
<i>M) in the electrolyte, Ahirwar et al. [30] produced 4 GQD samples with the π-π٭ </i>
absorption peaks between 253 and 279 nm.
<i>Figure 1.2. UV−Vis spectra of GQDs A, B, and C, corresponding to synthesized reaction temperature at 120, 100, and 80°C, respectively. The inset is a photograph of these GQDs under the excitation of 365 nm UV light. According to Peng et al. [29]. </i>
</div><span class="text_page_counter">Trang 25</span><div class="page_container" data-page="25"><b>1.1.4. Photoluminescence (PL) properties of GQDs </b>
PL stands as a crucial characteristic of GQDs, and quantum confinement becomes significant in this aspect. Prior studies have noted that GQDs can exhibit PL emissions across a broad spectrum, spanning from ultraviolet to red. In fact, the opening of a band gap and the associated PL behavior are highly reliant on the size
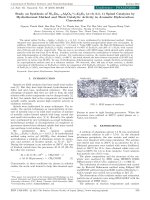
<i>of GQDs. In Figure 1.3, Tian’s group [31] demonstrate a common trend in PL </i>
emissions concerning changes in GQDs' size [31]. Accordingly, when the size of GQDs enlarges, the energy band gap tends to extend, and the emission light shifts
<i>toward red region. As for shape factor, an interesting observation by Kim et al. [26] </i>
highlighted unusual size-dependent variations in visible PL emissions, which might be attributed to differences in GQDs' shapes (circular, polygonal, irregular, etc.) and edge states (zigzag, armchair and mixed). The author group observed nonmonotonic PL behaviors of GQDs when their sizes increase from 5 to 35 nm, although the corresponding absorption peak in UV-Vis spectra monotonically shifts to red light region.
<i>Figure 1.3. Illustrative scheme demonstrating the measured results and analysis of GQDs based on size and morphology. According to Tian et al. [31]. </i>
Nevertheless, it is essential to note that the PL properties of GQDs are not solely determined by their size and shape, as they are also influenced by external factors,
</div><span class="text_page_counter">Trang 26</span><div class="page_container" data-page="26"><i>including experimental conditions and the microenvironment. For instance, Li et al. </i>
[32] conducted a comprehensive investigation into the temperature's impact on PL properties at various excitation wavelengths. They observed a significant reduction (over 50%) in the normalized PL intensity when excited at wavelengths of 310 nm, 340 nm, and 365 nm within a temperature range below 80 °C. Interactions between GQDs and their surroundings play a crucial role in their PL spectra. When GQDs were encapsulated within zeolitic imidazolate framework nanocrystals, their PL spectra showed a 32 nm redshift, primarily attributed to interactions between GQDs and zeolitic imidazolate framework nanocrystals [33]. Furthermore, it has been documented that the pH of the solution can influence the fluorescent spectra of GQDs.
<i>For instance, Fan et al. electrochemically synthesized GQDs that exhibit a PL </i>
emission peak at 480 nm at pH 6.7, while this peak shifts to 440 nm at pH 6.8 [34].
<i>Yang et al. also observed pH-dependent fluorescence in GQDs ranging from 2 to </i>
5 nm [35], where an increase in pH correlated with an increase in GQDs' fluorescence intensity. The underlying mechanisms behind these pH-dependent fluorescent properties of GQDs have been described elsewhere [36, 37].
The optical properties of GQDs hold significant importance in various applications, including biosensors, bioimaging, and photovoltaics. To effectively utilize the PL properties of GQDs, it is not only their fluorescence that matters, but also their quantum yield, which signifies the fraction of molecules emitting photons upon direct excitation by a source. The calculation of quantum yield with an indirect approach has been described in many works [38-40]. Although each word presented a slightly different way to call physical quantities, the nature of the formula is
<i>unchanged. Take the work of Tian et al. as an example [38], the quantum yield of </i>
GQDs in water was measured by:
</div><span class="text_page_counter">Trang 27</span><div class="page_container" data-page="27">refers to the refractive index of the solvent. The subscript “u” means the sample, and “s” means the reference standard with known quantum yield. In this case, the excitation wavelength (for PL spectra) was 350 nm, so the value of A must be measured at the same wavelength. The author group chose quinine sulfate in 0.1M sulfuric acid solution (Y<small>s</small>=57.7%) as a standard. All required figures and the final result are provided in Table 1.1. It is also noticeable that the absorbance of GQDs solution and quinine sulfate standard solution were kept below 0.1 in order to eliminate the multiple absorption effect. In some works, such figures were preferable to be lower than 0.05.
<i>Table 1.1. Demonstrating example of quantum yield calculation. According to Tian et al. [38]. </i>
<b>1.1.5. Band gap of GQDs </b>
The optical characteristics of GQDs find their explanation in alterations to the electronic structure of these nanomaterials. The inherent zero band gap of pristine graphene hinders its applications in most electronic devices. However, the band gap of graphene can be adjusted through techniques such as introducing heteroatoms (doping), modifying size and altering surface chemistry. Similarly, GQDs' band gap can be controlled by incorporating appropriate dopants and surface functional groups.
<i>An example of this tunability is illustrated by Feng et al. when they tuned the </i>
electrical properties of GQDs through selective boronization [41]. Additionally, Chen
<i>et al. defined a connection between the size of GQDs and their band gap by </i>
employing density-functional theory and time-dependent density-functional theory calculations [42]. They found that the band gap extends as the size of GQDs
<b>Sample </b>
<b>Integrated </b>
<b>emission intensity (F) </b>
<b>Abs. at 350 nm (A) </b>
<b>Refractive index of solvent (G) </b>
<b>Quantum yields (Y%) </b>
</div><span class="text_page_counter">Trang 28</span><div class="page_container" data-page="28">decreases, showcasing the direct relationship between these two factors. Tailoring GQDs' band gap has been explored not only theoretically but also experimentally. Ye
<i>et al. published an interesting work confirming the relationship between bandgap and </i>
size or molecular weight cutoff [43]. They prepared 04 GQDs samples with the size distribution as depicted in Figure 1.4.a. As can be seen from Figure 1.4.b, when the average GQDs size drops from 70 to 4.5 nm, these quantum dots solutions emit light across the majority of the visible spectrum from orange-red (∼1.9 eV) to green (∼2.4 eV) regions under a 365 nm UV light. At the same time, the emission peak shows "blue-shifts" from ∼620 to ∼520 nm, which is in accordance with the quantum confinement effect.
<i>Figure 1.4. (a) Chart of size distributions of 4 GQDs samples determined by TEM. (b) The plots depicting band gap enlargement with the shrink of the size of GQDs; the inset shows the PL colors corresponding to the size of GQDs. According to Ye et al. [43]. </i>
In a separate study, Mandal and co-workers theoretically investigated the morphology-dependent band gap of GQDs [44]. They introduced 4 distinct types of GQDs with optimized structures obtained by the conjugate gradient algorithm, as presented in Figure 1.5. Their analysis revealed a shift in the highest occupied molecular orbital (HOMO) and lowest unoccupied molecular orbital (LUMO) to higher and lower energy levels, respectively, when the dot sizes grow. In other words, increasing the number of carbon atoms in all 4 types of GQDs leads to the reduction of HOMO–LUMO gap. The author’s group also delved into the impact of organic
</div><span class="text_page_counter">Trang 29</span><div class="page_container" data-page="29">functional groups on GQDs' band gap and found that different functional groups (either electron-withdrawing or electron-donating) have an obvious effect on the HOMO, LUMO levels, but no significant alteration in the HOMO–LUMO gap is observed. Numerous authors have conducted in-depth examinations of the electronic properties of GQDs, as detailed in previous publications [45-48].
<i>Figure 1.5. Optimized structure of the smallest unit of four GQDs types (left). The graph demonstrating the energy gap as a function of the total number of conjugated carbon atoms corresponding to 4 types of morphologies (right). According to Mandal et al. [44]. </i>
<b>1.2. Applications of GQDs </b>
GQDs have been widely studied in recent years due to their outstanding characteristic properties, including electrical, optical, and optoelectronic properties. One advantage of this type of quantum dot materials is their physical stability, based on the inherent inert nature of carbon materials. Additionally, GQDs exhibit environmental friendliness due to their nearly non-toxic and good biocompatibility [49-51]. The superior properties of GQDs and related modified materials open up potential applications in various fields and attract the interest of researchers and industries worldwide [31]. As presented in Figure 1.6, some potential fields for GQDs include medicine [52-54], optics (luminescence, photoluminescence, photocatalysis, etc.) [55-58], and energy [59-61].
</div><span class="text_page_counter">Trang 30</span><div class="page_container" data-page="30"><i><b>Figure 1.6. Inherent effects, properties, and corresponding applications of GQDs [31]. </b></i>
However, to tailor GQDs for specific applications such as biological imaging [62, 63], drug delivery [64, 65], or photodetectors [66, 67], their properties and structures need to be adjusted accordingly. Currently, common approaches to achieve this include controlling the degree of oxidation [68-70], surface functionalization [71-73], and heteroatom doping [74-77].
<b>1.2.1. Bioimaging and biosensing applications </b>
Given their exceptional and adjustable optical, electrical, and structural characteristics, GQDs represent a novel class of molecules that have recently
</div><span class="text_page_counter">Trang 31</span><div class="page_container" data-page="31">garnered substantial research interest [78]. GQDs have become a focal point of extensive research investigations primarily due to their environmentally friendly nature and significantly lower toxicity when compared to heavy metal-based QDs, which are known for their high toxicity, raising critical concerns for the environment and human health [79]. Furthermore, the tiny size and high oxygen content of GQDs
<i>contribute to their low cytotoxicity in in vitro experiments. Similarly, in vivo studies </i>
regarding the biodistribution of GQDs in major organs, such as kidneys, have revealed rapid clearance without any noticeable accumulation in mice [80]. Both experimental and simulation studies have aligned closely when examining the size-dependent toxicity of GQDs on lipid membranes. It has been observed that smaller GQDs can penetrate these membranes with low toxicity, while larger dots efficiently rupture lipid bilayers, underscoring the importance of size in toxicity considerations [81].
Due to their exceptional characteristics, GQDs emerge as promising candidates for various applications, including sensor materials, bioimaging tools, and drug delivery systems. Furthermore, they are widely employed as fluorescent probes for a variety of analytes due to their remarkable attributes, which include resistance to photobleaching, low cytotoxicity, strong biocompatibility, stable PL, and high solubility in aqueous environment [82]. Notably, the most intriguing aspect of GQDs is their PL, which can be customized by managing factors such as size, surface modifications, and chemical doping [83]. The adaptable and robust PL, coupled with the confirmed eco-friendly and low toxicity profile, positions GQDs as promising candidates for bioimaging field. Moreover, surface functionalization enhances the biocompatibility of GQDs, representing a burgeoning area of research with diverse applications in the biomedical field [84, 85]. Additionally, edge functionalization of GQDs with functional groups like carboxyl, carbonyl, epoxy, and hydroxyl, enables interactions with various biological molecules such as proteins, antibodies, and enzymes [86]. Researchers have reported that graphene surface of GQDs can covalently link and conjugate with antibodies, proteins, nucleic acids and polymers
</div><span class="text_page_counter">Trang 32</span><div class="page_container" data-page="32">via π−π interaction, facilitating highly selective and sensitive biosensors capable of identifying biomarkers associated with numerous types of cancers [87, 88].
<b>1.2.2. Drug delivery </b>
As mentioned above, GQDs have found applications in biomedicine and pharmaceuticals, such as photothermal therapy, biosensors, drug delivery, and molecular imaging. They are emerging as strong contenders in the quest to create efficient drug delivery systems, including theragnostic agents, because GQDs possess a range of desirable qualities, such as low cytotoxicity, an abundance of peripheral -COOH groups, and stable PL properties under various chemical and thermal conditions. However, an inherent challenge of GQDs applications is their hydrophobic nature induced by carbon structure. In order to address this hydrophobicity, various strategies have been explored to mitigate hydrophobic surface interactions and enhance GQDs' biocompatibility. These strategies include chemical PEGylation, oxidation, reducing the size of the QDs, and so on [16].
<i>Figure 1.7. Proposed explanation for the roles of DOX/GQD conjugates in DOX delivery. According to Wang et al. [89]. </i>
As for utilizing GQDs in drug delivery, there are some noticeable publications
<i>that can be referred to. Wang et al. [89] were the first to highlight the remarkable </i>
</div><span class="text_page_counter">Trang 33</span><div class="page_container" data-page="33">potential of GQDs, not only for delivering the anticancer drug doxorubicin (DOX) but also for enhancing its anticancer effectiveness against breast cancer MCF-C cells. The GQDs-DOX conjugate was observed to follow distinct nuclear and cellular internalization pathways compared to pristine drugs, consequently enhancing drug delivery efficiency, as illustrated in Figure 1.7. Intriguingly, these GQDs-DOX conjugates exhibited a substantial increase in nuclear uptake and cytotoxicity of DOX against drug-resistant cancer cells. This evidence suggests that combining anticancer drugs with GQDs may enhance the chemotherapeutic efficacy of such drugs, particularly in cases of suboptimal performance due to drug resistance.
<i>Figure 1.8. Scheme showing the synthesis of DOX-loaded HER-labeled GQD-based nanocarriers and its drug release via cellular uptake for active targeting of breast cancer cells. According to Ko et al. [90]. </i>
<i>In a related study, Ko et al. [90] cleverly designed GQDs-based nanocarriers for </i>
breast cancer diagnosis and treatment, and labeled them with Herceptin (HER) and β-cyclodextrin (β-CD). Within these nanovesicles, HER served as an active targeting agent for HER2-overexpressed breast cancer, β-CD provided a hydrophobic site for loading DOX via host-guest chemistry, and GQDs functioned as diagnostic agents due to their pH-sensitive blue emission in the acidic environment of cancer cells
</div><span class="text_page_counter">Trang 34</span><div class="page_container" data-page="34">(Figure 1.8). These GQDs-based multifunctional drug delivery carriers resulted in an enhanced anticancer approach with both diagnostic and treatment capabilities.
<i>Additionally, Dong et al. [91] designed DOX-loaded amino acid (AA)-conjugated </i>
GQDs with stable fluorescence properties and utilized them for dye-free imaging, as well as for tracking and monitoring drug delivery. The inherent fluorescence properties of GQDs allowed for efficient real-time monitoring of the cellular uptake of DOX-GQDs-AA nanocarriers and subsequent drug release. Furthermore, the nano-assemblies exhibited pH-dependent drug release characteristics.
<b>1.2.3. Photocatalysis </b>
Photocatalysis is a process in which the chemical reaction speed is significantly enhanced thanks to the presence of a catalyst under light exposure. This field of science holds great significance for a sustainable future, particularly in the context of transitioning to renewable energy sources as alternatives to traditional fossil fuels. However, the primary challenge of widely employing photocatalysis is the requirement of a catalyst capable of efficiently harnessing sunlight to drive enhanced chemical reactions. A secondary challenge is to produce an efficient photocatalyst through a cost-effective and large-scale production process. The effectiveness of a material for catalytic applications is determined by key factors such as its electronic structure, morphology, and atomic arrangement [16].
GQDs are considered promising for photocatalysis and electrocatalysis applications since they possess distinctive qualities, including high stability, solubility, an enlarged surface area, good conductivity, and non-toxicity. Furthermore, GQDs offer the ability to adjust their band gap by varying particle size and introducing heteroatom dopants, chemical groups with defects, and edge configurations. As for photocatalysis, the introduction of heteroatoms like N, P, and S allows researchers to modify the solar-absorption properties of GQDs, optimizing their performance. GQDs, either alone or in conjunction with other inorganic materials, have been employed in various photocatalytic reactions, including H<small>2</small>
</div><span class="text_page_counter">Trang 35</span><div class="page_container" data-page="35">generation [92-94], organic pollutants degradation [95-101], CO<small>2</small> reduction [102, 103], and more.
Yeh and colleagues [104] successfully developed GQDs with a narrow band gap, thereby improving their ability to absorb visible light, which in turn enhances their capacity for generating hydrogen and reducing carbon dioxide. The group achieved this via chemical modifications to the GQDs. The presence of electron-withdrawing groups, such as -COOH, and electron-donating groups, such as -NH<small>2</small>, results in the GQDs with p-type and n-type conductivity, respectively. The author group explained the noticeable efficiency of producing H<small>2</small> and reducing CO<small>2</small> by the efficient p-n type intramolecular photochemical reaction, resulting from ohmic contact between n-type and p-type GQDs.
<i>Lei et al. [105] exemplified the utilization of GQD composites in the case of </i>
CdS/GQDs nanohybrid, which has proven to be a highly effective, strongly coupled photocatalyst with notable photocatalytic capabilities for hydrogen production. Compared to CdS alone, the CdS/GQDs nanohybrid composites, containing 1.0 wt % of GQDs, displayed a 2.7-fold increase in photocatalytic efficiency. This enhanced performance was supposed to originate from the augmented light absorption facilitated by GQDs. Besides this work, several research groups have also employed the remarkable ability of GQDs to significantly enhance the response to visible light in photocatalytic processes. Many GQDs-based composites with materials like Bi<small>2</small>MoO<small>6</small> [106], ZnO [107], and TiO<small>2</small> [97, 101] have been synthesized and confirmed that they displayed superior photocatalytic activity compared to the bare oxides.
On the other hand, various research teams have explored GQDs-based composites involving organic polymers or organic/inorganic polymers aiming for
<i>diverse photocatalytic purposes. For example, Fan et al. [108] obtained a </i>
GQDs-polyvinyl pyrrolidone-CdS nanocomposite via a one-step hydrothermal method. This composite efficiently degraded methyl orange under visible light, and its enhanced photocatalytic activity was attributed to GQDs' upconversion property and the effective charge transfer between CdS and GQDs. Moreover, GQDs modified with
</div><span class="text_page_counter">Trang 36</span><div class="page_container" data-page="36">polymers have been engineered to effectively degrade methylene blue under a light source with a 400 nm cutoff filter [109]. Polymers such as polyethylenimine and polyethylene glycol were employed for this purpose. These investigations indicated that the type of polymer influences the absorption properties of GQDs/polymer composites, making them suitable for the photocatalytic degradation of numerous organic compounds [108, 110].
<b>1.2.4. Energy harvesting </b>
<i><b>1.2.4.1. Solar cells </b></i>
Utilizing GQDs presents a straightforward and efficient method to significantly enhance the power conversion efficiencies of various solar cells. GQDs can serve as selective carrier window layers in solar cells, and when incorporated into traditional window layers, they can enhance their performance. GQDs can contribute to increased light absorption within the active layer/material of solar cells and simultaneously improve hole extraction efficiency. Importantly, by engineering the functional groups, the band gap, light transmission/absorption, and electrical properties of GQDs can be tailored over a broad range to meet specific performance requirements [16]. In practice, the usage of GQDs has led to performance enhancements in various types of solar cells, including organic photovoltaics (OPVs) [111, 112], dye-sensitized solar cells (DSSCs) [113, 114], perovskite solar cells (PSCs) [115, 116], silicon solar cells (SSCs) [117, 118], and other innovative heterojunction solar cell designs [119, 120].
<i><b>1.2.4.2. Piezoelectric and triboelectric nanogenerator </b></i>
Lately, nanogenerators have emerged as a means to transform mechanical energy from various sources, such as vibrations, ultrasonic waves, air/liquid pressures, and sound waves, into electricity. These nanogenerators find application in diverse fields, including energy generation, transducers, sensors, and actuators. Flexible nanogenerators capable of scavenging different forms of mechanical energy show tremendous promise for powering nanosystems and low-power portable
</div><span class="text_page_counter">Trang 37</span><div class="page_container" data-page="37">devices. Efforts to create transparent and flexible nanogenerators have led to the use of carbon-based materials like graphene, CNTs, and GQDs as fillers or conducting substrates [121-123]. A notable work by Lu’s group [123] introduced a straightforward method for constructing a piezoelectric nanogenerator using GQDs and poly(vinylidene fluoride) (PVDF). They achieved a self-powered piezoelectric composite that efficiently converts mechanical, vibrational, and hydraulic energy into electricity without the need for electrical poling. The findings clearly indicate that both the voltage and current increased almost proportionally as the GQD loadings were raised. This underscores the GQDs' remarkable capacity to finely adjust the electrical output of GQD/PVDF composites. Notably, a GQD/PVDF sample with a 3 wt% GQD loading achieved an open-circuit voltage of 0.75 V and a short-circuit current of 25.7 nA. These values were more than four times greater than those observed in the pure PVDF.
In addition to piezoelectric nanogenerators, a new category of mechanical energy harvesting devices, triboelectric nanogenerators, has emerged based on the triboelectric and electrostatic effects. These devices convert electric energy through contact or rubbing between two materials with different triboelectric polarities [124, 125]. In these devices, nanoparticles are often distributed on materials’ surface (metal or polymer) to strengthen the contact surface area and energy conversion process.
<i>Typically, Xu et al. fabricated a triboelectric electronic skin system based on GQDs, </i>
towards the use in self-powered, smart artificial fingers [126]. Their design created micro-gaps and rendered the electronic skin highly responsive to a range of mechanical stimuli, such as pressing, stretching, folding, and twisting. To achieve this, they employed Ag nanowires coated with GQDs, serving as the electrode for the triboelectric nanogenerator and the friction layer. The resulting electronic skin, which is transparent and lightweight, has an ultra-lightweight quality with an areal density of around 130 g/m<sup>2</sup>, rendering it satisfactory for portable and wearable electronic gadgets. When subjected to a pressure of 10 N from the electronic skin, the GQDs-based nanogenerator yielded an output short-circuit current density of around 10 mA/cm², nearly 20 times higher than that of the reference device without GQDs. It
</div><span class="text_page_counter">Trang 38</span><div class="page_container" data-page="38">was also revealed that the output performance showed enhancement with an increase in load and GQDs content.
<b>1.3. Synthesis strategies of GQDs </b>
Basically, there are two main approaches for obtaining GQDs, as illustrated in Figure 1.9. True to their names, top-down methods involve breaking down carbon materials, including bulk forms, graphene, fullerenes, and CNTs, into nano-sized GQDs using various tools such as oxidative cleavage, hydrothermal or solvothermal processes, electrochemical oxidation, ultrasonic-assisted or microwave-assisted processes, chemical vapor deposition (CVD), and laser ablation [127]. This approach has the advantage of using abundant raw materials and often results in oxygen-containing functional groups at the edges of GQDs, increasing their solubility and functionality. However, some limitations of the top-down approach include low yield, high defect density, and difficulty controlling the size and shape of the products.
<i>Figure 1.9. Raw materials and two major approaches for producing GQDs [31]. </i>
</div><span class="text_page_counter">Trang 39</span><div class="page_container" data-page="39">In contrast, the bottom-up approach, sometimes referred to as carbonization, utilizes small molecules or suitable polymers as precursors. Through processes like dehydration and carbonization, GQDs are formed and tend to have fewer defects compared to the top-down approach. However, they often have poor solubility, low uniformity (high polydispersity), and may encounter aggregation issues with small-sized dots [31].
<i>Tables 1.2 and 1.3 were extracted from a detailed review of Kumar et al. [16] </i>
to briefly summarize typical publications on top-down and bottom-up methods.
<i>Table 1.2. Overview of top-down synthesis methods for GQDs and their applications. According to Kumar et al. [16]. </i>
<b>Method Source Size (nm) </b>
<b>Quantum Yield (%) </b>
<b>Application Ref. </b>
Microwave Irradiation
imaging
[128]
Microwave hydrothermal
biolabeling
[129]
Microwave irradiation
Sonochemical and microwave heating
Microwave-Glucose ∼3.4 7–11 Blue and LED
White-[132]
assisted
Microwave-Urea and Glucose
<15 11–32 Removal of triazine
Amino-Oxidized graphene Sheets
∼2.5 19–29 LED and Bioimaging
[134]
</div><span class="text_page_counter">Trang 40</span><div class="page_container" data-page="40"><b>Method Source Size (nm) </b>
<b>Quantum Yield (%) </b>
<b>Application Ref. </b>
Solvothermal Expanded graphite
electronic devices
[38]
Solvothermal Graphite 2.5–50
8.8 Detection of Eu<sup>3+</sup> and Tb<sup>3+</sup>
[135]
Electrochemical MWCNTs 3–8.2 5.1–6.3 Biomarkers and nanoelectronic devices
[138]
Chemical oxidation Carbon black
15–18
2.4–4.0 Bioimaging and biolabeling
∼1.3 3.6 Fluorescent cell imaging
[143]
Pyrolysis Melamine powder
</div>