financial analysis report requirement analyze the financial statement of binh thanh import export production trade jsc
Bạn đang xem bản rút gọn của tài liệu. Xem và tải ngay bản đầy đủ của tài liệu tại đây (683.54 KB, 34 trang )
<span class="text_page_counter">Trang 1</span><div class="page_container" data-page="1">
<b> HANOI UNIVERSITY OF SCIENCE AND TECHNOLOGY---ECONOMICS AND MANAGEMENT---</b>
<b> FINANCIAL ANALYSIS REPORT</b>
<b>Course: Corporate Finance (EM3519E)</b>
<i><b>REQUIREMENT: Analyze the financial statement of Binh Thanh</b></i>
<b>Professor : Nguyễn Thúc Hương GiangStudent : Trần Thị Thuỳ LinhClass : 141135</b>
<b>Student ID : 20213070</b>
<b>Hà Nội, 15 July 2023</b>
</div><span class="text_page_counter">Trang 2</span><div class="page_container" data-page="2"><b>2.3. General analysis of the financial situation of the enterprise:...21</b>
<b>PART 3: FINANCIAL INDEX ANALYSIS:...21</b>
<b>3.1. Paying indicators analysis:...21</b>
<b>3.2. Performance analysis:...24</b>
<b>3.3. Profitability and capital use:...27</b>
<b>PART 4: DUPONT ANALYSIS:...31</b>
<b>PART 5: CONCLUSION:...32</b>
<small>2</small>
</div><span class="text_page_counter">Trang 3</span><div class="page_container" data-page="3">In this day and age, Vietnam’s economy is increasingly opening up tothe global market, creating a range of opportunities for integration andeconomic development to compete with world powers. The opening of theeconomy also poses numerous challenges for the overall economy andindividual businesses, requiring companies to improve and enhance variousaspects from production to business management. Among them, the analysisof a company’s financial statements plays a crucial role in overall businessoperations and financial management.
Effective financial analysis is essential for sustainable businessoperations and development, as it enables managers to make informed andtimely decisions. It sets the requirement for financial analysts to analyzecorporate financial reports, considering it as a solution for the existence andgrowth of the company. Understanding the company’s situation and financialperformance helps in making decisions that enhance the company’scompetitiveness, minimize costs, maximize profits, and increase revenue.Additionally, it helps identify and mitigate financial risks for the business.
Recognizing the importance of financial analysis, this report willprovide a clear presentation of the analysis of the financial statements of BinhThanh Import – Export Production & Trade JSC over the years 2020, 2021,and 2022.
<small>3</small>
</div><span class="text_page_counter">Trang 4</span><div class="page_container" data-page="4">In 2002, the listing of Gilimex on the Ho Chi Minh Stock Exchange withthe stock code GIL has confirmed the successful business performance of thecompany which resulted utterly from the collective development staff efforts,the acumen of an innovative spirit, and the creativity in product diversification.
With 15 subsidiaries and 02 strategic affiliates, along with a team of morethan 5,000 highly skilled workers, Gilimex is confident to have the facilities andproduction capacity to fully meet the requirements and commitments of bothdomestic and foreign partners on processing time, product quality, productdevelopment as well as coordination of production and business activities.
<b>1.2. Business sectors and services:</b>
Producing, processing, and exporting agricultural, forestry, aquaticproducts, handicrafts, garments, leather goods, rubber, grains, food, equipment,machinery, various building materials, and other products. Import of machinery,equipment, raw materials, supplies, transportation vehicles, consumer goods,electrical and electronic appliances, commercial services, pawnshop services,construction, interior decoration, land reclamation, real estate business,investment cooperation in the tourism sector, restaurants, and hotels.
<small>4</small>
</div><span class="text_page_counter">Trang 5</span><div class="page_container" data-page="5">The company has successfully improved its quality-focused managementsystem, adhering to the international standard ISO 9001:2015. This has built thecompany’s reputation and gained customer trust. The company has securedvaluable and long-term contracts, leading to promising development prospects.It has expanded into the European, Taiwanese, and Japanese markets, and hasestablished partnerships with reputable global customers such as IKEA PTELTD from Sweden and Goshoku from Japan.
<b>1.3. Authorized capital:</b>
The predecessor of Binh Thanh Production, Trading, Import, and ExportCompany (GILIMEX) was a state-owned enterprise under the administration ofthe People’s Committee of Ho Chi Minh City, which underwent equitizationaccording to Decision No. 134/2000/QD-TTg issued by the Government on24/11/2000, regarding the transformation of Binh Thanh Production, Trading,Import, and Export Company into Binh Thanh Import – Export Production andTrading Joint Stock Company.
According to the first-time business registration certificateNo.4103000253 issued on 29/12/2000, and the 24th amendment to the businessregistration certificate No.030218166 issued on 17/11/2022, by the Ho ChiMinh Department of Planning and Investment.
The charter capital of the company as stated in the business registrationcertificate is 690.000.000.000 VND.
The contributed capital of the company on 31/12/2022 is690.000.000.000 VND.
<small>5</small>
</div><span class="text_page_counter">Trang 6</span><div class="page_container" data-page="6"><b>PART 2: FINANCIAL ANALYSIS:2.1. Horizontal analysis:</b>
2.1.1. Property Situation:
BALANCE SHEET HORIZONTAL ANALYSIS (million VND)
<b><small>202020212022</small><sup>Increase (Decrese)</sup><small>2021/2020</small></b>
<b><small>Increase (Decrease)2022/2021million</small></b>
<b><small>VND</small><sup>million</sup><small>VND</small><sup>million</sup><small>VNDmillion VND%million VND%A-CURRENT ASSETS</small></b>
<b><small> 2.160.533</small></b>
<b><small> 3.153.040</small></b>
<b><small> </small></b>
<b><small>3.492.442 992.507 45,94 339.402 10,76</small></b>
<small>I. Cash and cash equivalents 586.830 </small>
<small> 762.047 </small>
<small> </small>
<small>759.065 175.217 29,86 (2.982)-0,39II. Short-term financial </small>
<small> 357.146 </small>
<small> 479.207 </small>
<small> </small>
<small>997.223 122.061 34,18 518.016 108,10</small>
<small>III. Short-term receivables 630.046 </small>
<small> 1.022.775</small>
<small> </small>
<small>283.167 392.729 62,33 (739.608)-72,31</small>
<small>IV. Inventories</small>
<small> 511.203 </small>
<small> 749.348 </small>
<small> </small>
<small>1.253.926 238.145 46,59 504.578 67,34</small>
<small>V. Other short-term assets</small>
<small> 75.308 </small>
<small> 139.663 </small>
<small> </small>
<small>199.061 64.355 85,46 59.398 42,53</small>
<b><small>B-NON-CURRENT ASSETS 548.029 </small></b>
<b><small> 612.761 </small></b>
<b><small> </small></b>
<b><small>495.895 64.732 11,81 (116.866)-19,07</small></b>
<small>I. Long-term receivables</small>
<small> 26.431 </small>
<small> 29.254 </small>
<small> </small>
<small>28.956 2.823 10,68 (298)-1,02</small>
<small>II. Fixed assets</small>
<small> 185.462 </small>
<small> 259.185 </small>
<small> </small>
<small>255.624 73.723 39,75 (3.561)-1,37</small>
<small>III. Long-term assets in progress 18.070 </small>
<small> 14.102 </small>
<small> </small>
<small>17.061 (3.968)-21,96 2.959 20,98IV. Long-term financial </small>
<small> 154.812 </small>
<small> 122.475 </small>
<small> </small>
<small>21.964 (32.337)-20,89 (100.511)-82,07</small>
<small>V. Other long-term assets 163.254 </small>
<small> 187.745 </small>
<small> </small>
<small>172.290 24.491 15,00 (15.455)-8,23</small>
<b><small>TOTAL ASSETS</small></b>
<b><small> 2.708.562</small></b>
<b><small> 3.765.801</small></b>
<b><small> </small></b>
<b><small>3.988.337 1.057.239 39,03 222.536 5,91RESOURCES</small></b>
<b><small>2020</small><sub>2021</sub><sub>2022</sub><sup>Increase (Decrese)</sup><small>2021/2020</small></b>
<b><small>Increase (Decrease)2021/2022 million</small></b>
<b><small>VND million</small></b>
<b><small>VND million</small></b>
<b><small>VND million VND % million VND%C-LIABILITIES</small></b>
<b><small> 1.418.574</small></b>
<b><small> 2.155.362</small></b>
<b><small> </small></b>
<b><small>1.476.678 736.788 51,94 (678.684)-31,49</small></b>
<small>I. Current liabilities</small>
<small> 1.415.974</small>
<small> 2.084.756</small>
<small> </small>
<small>1.329.859 668.782 47,23 (754.897)-36,21</small>
<small>II. Long-term liablities</small>
<small> 2.600 </small>
<small> 70.606 </small>
<small> </small>
<small>146.819 68.006 2615,62 76.213 107,94</small>
<b><small> 1.289.988</small></b>
<b><small> 1.610.439</small></b>
<b><small> </small></b>
<b><small>2.511.659 320.451 24,84 901.220 55,96</small></b>
<small>I. Owners' equity</small>
<small> 1.289.988</small>
<small> 1.610.439</small>
<small> </small>
<small>2.511.659 320.451 24,84 901.220 55,96</small>
<b><small>TOTAL RESOURCES 2.708.562</small></b>
<b><small> 3.765.801</small></b>
<b><small> </small></b>
<b><small>3.988.337 1.057.239 39,03 222.536 5,91</small></b>
<small>6</small>
</div><span class="text_page_counter">Trang 7</span><div class="page_container" data-page="7">First, in terms of current assets, there was a significant increase in 2021,reaching 45.94%, equivalent to 992,507 million VND compared to 2020.However, in 2022, the short-term assets decreased to only 10.76%, equivalent to339,402 million VND. Specifically, it can be detailed as follows:
In 2021, cash and cash equivalents increased by over 175 billionVND, representing a growth of approximately 30% compared to2020. Short-term financial investments also increased by over 120billion VND, reflecting a growth of more than 24% compared to2020. This increase in cash and cash equivalents, along with short-term financial investments, reflects the company’s ỉmprovedliquidity and ability to generate short-term returns on its excessfunds. It suggests that the company may have experienced positivecash flows, increased profitability, or successful investmentactivities in the short-term financial market.
On the other hand, in 2022, cash and cash equivalents experienceda significant decrease of -1.02%, equivalent to a reduction ofnearly 300 million VND compared to 2021.
<small> - 200,000 400,000 600,000 800,000 1,000,000 1,200,000 </small>
<small> 357,146 </small>
<small> 479,207 </small>
<small> 997,223 </small>
Short-term financial investments
<small>7</small>
</div><span class="text_page_counter">Trang 8</span><div class="page_container" data-page="8">The short-term financial investments in 2022 increased by108.10%, equivalent to nearly 520 billion VND. Meanwhile, cashand cash equivalents decreased. This indicates that the companyhas utilized its available cash for various purposes such asinvesting in short-term financial instruments or funding operationalactivities. By reducing cash holdings and increasing short-termfinancial investments, the company aims to optimize its liquidityposition while seeking higher returns on its available funds.
Then, short-term receivables in 2021 increased remarkably by62.3%, equivalent to more than 1,000 billion VND. This suggeststhat the company experienced substantial growth in sales on creditor had a higher volume of outstanding invoices. This could be aresult of increased business activities, new customer acquisitions,or extended credit terms to clients. However, the subsequentdecrease in short-term receivables to 200 million indicates that thecompany managed to collect a significant portion of its outstandingreceivables during the period.
Inventories in 2021 increased to 46.6%, equivalent to an increaseof 238,145 million VND compared to 2020, then this numbercontinued to climb to 67.3%, equivalent to 504,578 million VNDin 2022. The increase in inventory for an import-export companysuggests a growth in the volume and value of goods held by thecompany, reflecting its efforts to meet both domestic andinternational market demands.
Other short-term assets in 2021 increased by about 85%, equivalentto an increase of nearly 140 billion VND compared to 2020. Andin 2022, they continued to increase by 42%, equivalent to anincrease of nearly 200 billion VND. The rise in other short-term
<small>8</small>
</div><span class="text_page_counter">Trang 9</span><div class="page_container" data-page="9">assets could include prepaid expenses, advances to supplies, orshort-term investments. It indicates that the company has investedfunds in various short-term assets to support its operations. Thiscould be a strategic move to secure favorable terms with suppliers,invest in marketable securities, or prepay expenses to benefit fromdiscounts, or ensure uninterrupted business activities.
Long-term assets in 2021 compared to 2020 increased by 11.81%,equivalent to about 65 billion VND. The number of long term-assets increasedmainly because the company invested in fixed assets at an increasing rate, in2021 compared to 2022 increased by nearly 40%, equivalent to more than 73billion VND. This shows that the company has purchased additional equipmentand machinery and owns stable long-term assets of high value to help increasethe productivity and operational efficiency of the company. However, in 2022,long-term assets decreased by 19.07%, equivalent to 116,866 million VND, andfixed assets also fell to 1.37%. This may indicate a reduction in the company’sinvestment in tangible assets used for long-term operations.
<small>9</small>
</div><span class="text_page_counter">Trang 10</span><div class="page_container" data-page="10"><small>202020212022 - </small>
<small> 500,000 1,000,000 1,500,000 2,000,000 2,500,000 3,000,000 3,500,000 4,000,000 </small>
<small> 2,160,533 </small>
<small> 3,153,040 </small> <sup> 3,492,442 </sup><small> 548,029 </small>
<small> 612,761 </small>
<small> 495,895 </small>
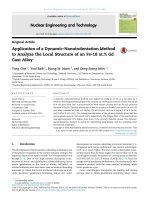
The company’s total assets over the past three years have grown,increasing by 40% in 2021 and 5% in 2022, respectively, showing that thecompany has tried to expand production and business. The year 2021 showedstrong growth and unceasing expansion of production despite a lot of pressurefrom the Covid-19 epidemic. In 2022, while the slight increase in total assetssuggests a continuation of positive growth, it may also indicate a potentialslowdown or stabilization in the company’s asset expansion. It can be seen thatin 2021, Gilimex is a company that is worth investing in, however, we will needto take a closer look at investment options in year 2022.
2.1.2. Capital Situation:
<small>10</small>
</div><span class="text_page_counter">Trang 11</span><div class="page_container" data-page="11"><small>202020212022 - </small>
<small> 500,000 1,000,000 1,500,000 2,000,000 2,500,000 3,000,000 3,500,000 4,000,000 </small>
<small> 1,418,574 </small>
<small> 2,155,362 </small>
<small> 1,476,678 1,289,988 </small>
<small>11</small>
</div><span class="text_page_counter">Trang 12</span><div class="page_container" data-page="12">The company’s long-term liabilities tend to increase year by year.Specifically, the number of long-term liabilities in 2021 compared to 2020 hasskyrocketed to 2615.52%, equivalent to 68 billion VND, in 2022 it continued toincrease by 107%, equivalent to more than 76 billion VND. The sharp increasein 2021 suggests that the company has taken on substantial debt to fundinvestment projects, business expansion, or acquisitions. On the other hand,Gilimex has been investing in the fields of industrial park real estate, whichrequires long-term financing. The increase in non-current liabilities could be aresult of borrowing to finance this investment.
The significant increase in long-term liabilities can indicate a higher levelof leverage or financial risk for the company. It implies greater reliance onborrowed funds, which may result in higher interest expenses and debt servicingobligations. However, on the other hand, although the debt is high, if thecompany’s business activities achieve high efficiency and have good cash flowcontrol plans, it will hardly become a big risk for the company to be afraid of.
Owner’s equity increases year by year, different from the fluctuation ofliabilities. Accordingly, the equity of 2021 compared to 2020 has increased bynearly 25%, equivalent to 320 billion VND, then this figure continued toincrease to 55%, equivalent to 900 billion VND. This shows that Gilimex isincreasingly expanding its scale to increase profits, but there is no sign ofshrinking.
<b>Period 2020-2021: Firstly, increases in current assets, non-current assets,</b>
and total assets can indicate growth and expansion of the company’s corebusiness. The company may have invested in ramping up production, expandingmarkets, or upgrading infrastructure. Secondly, a decrease in long-termfinancial investments indicated that Gilimex shifting its focus from investing to
<small>12</small>
</div><span class="text_page_counter">Trang 13</span><div class="page_container" data-page="13">its core business or short-term procurement. 2021 is the year company is doingwell.
<b>Period 2021-2022: The decrease in current assets, non-current assets, and</b>
total assets reflects difficulties in the company’s business operations. Gilimexmay have been facing financial pressure and having difficulty maintaining aproductive business. A decrease in liabilities, current liabilities, and currentassets reflects an adjustment in the financial structure of the company. Gilimexmay be focusing on reducing debt and enhancing liquidity to ensure financialstability and reduce risk.
<b><small> 3.166.709 </small></b>
<b><small> 693.575 </small><sup>20,06</sup></b>
<b><small> (983.611)</small><sup>-23,70</sup></b>
<small> - </small>
<small> - </small>
<small> 35 </small>
<b><small> 4.150.320 </small></b>
<b><small> 3.166.674 </small></b>
<b><small> 693.575 </small><sup>20,06</sup></b>
<b><small> (983.646)</small><sup>-23,70</sup></b>
<small>Cost of sales</small>
<small> 2.820.903 </small>
<small> 3.395.858 </small>
<small> 2.671.500 </small>
<small> </small>
<small> (724.358)</small> <sup>-21,33</sup>
<b><small>5</small><sup>Gross profit from goods </sup><small>sold and services rendered</small></b>
<b><small> 635.842 </small></b>
<b><small> 754.462 </small></b>
<b><small> 495.174 </small></b>
<b><small> 118.620 </small><sup>18,66</sup></b>
<b><small> (259.288)</small><sup>-34,37</sup></b>
<small>Financial income</small>
<small> 62.205 </small>
<small> 85.092 </small>
<small> 445.633 </small>
<small> </small>
<small> 360.541 </small> <sup>423,71</sup><small>6a</small> <sup>Share of net profit from </sup>
<small> (21.762)</small>
<small> (32.337)</small>
<small> (41)</small>
<small> (10.575)</small> <sup>-48,59</sup>
<small> 62.962 </small>
<small> 236.152 </small>
<small> </small>
<small> 173.190 </small> <sup>275,07</sup>
<small>In which: Interest expense 14.756 </small>
<small> 16.230 </small>
<small> 20.954 </small>
<small> 155.965 </small>
<small> 61.437 </small>
<small> </small>
<small> (94.528)</small> <sup>-60,61</sup><small>9</small> <sup>General and administration </sup>
<small> 110.666 </small>
<small> 156.289 </small>
<small> 184.319 </small>
<b><small> 432.001 </small></b>
<b><small> 458.858 </small></b>
<b><small> 36.199 </small><sup>9,15</sup></b>
<b><small> 26.857 </small><sup>6,22</sup></b>
<small>Other income</small>
<small> 3.092 </small>
<small> 8.321 </small>
<small> 4.251 </small>
<small> 6.986 </small>
<small> 4.208 </small>
<b><small> 1.335 </small></b>
<b><small> 43 </small></b>
<b><small> 1.921 </small><sup>-327,82</sup></b>
<b><small> (1.292)</small><sup>-96,78</sup></b>
<small>13</small>
</div><span class="text_page_counter">Trang 14</span><div class="page_container" data-page="14"><small> 110.367 </small>
<small> 84.574 </small>
<small> </small>
<small> (25.793)</small> <sup>-23,37</sup>
<b><small>16</small><sup>Net profit after corporate </sup><small>income tax</small></b>
<b><small> 309.277 </small></b>
<b><small> 330.633 </small></b>
<b><small> 361.393 </small></b>
<b><small> 21.356 </small><sup>6,91</sup></b>
<b><small> 30.760 </small><sup>9,30</sup></b>
Gross revenue from goods sold and services rendered in 2021 increasedby 20% compared to 2020, corresponding to an amount of 4,150,320 millionVND. The increase in sales shows that Gilimex is effective in business activitiesand achieves growth in product consumption or service provision. Thereby,showing us that the business is operating effectively. The company has appliedsales policies effectively to bring about revenue growth over the years.However, by 2022, gross revenue from goods sold and services renderedsuddenly decreased by 23.7%, equivalent to nearly 1,000 billion VNDcompared to 2021. A sharp drop in sales indicated that the company is havingdifficulty selling products and providing services.
Financial income in 2021 compared to 2020 increased by 36.79%,equivalent to an amount of nearly 120 billion VND, and revenue from financialactivities in 2022 compared to 2021 is an increase of 423.71%, corresponding toan amount of more than 360 billion VND. As we can see, Gilimex also has aninvestment in the financial sector and also brings a profit for the business, thevalue of this profit is very high, as shown that in 2022 short-term financialinvestments made a profit.
The share of net profit from associates reduced in 2021, down by nearly50% compared to 2020, but in 2022, it increased by nearly 100% compared to2021. Although there is an increase, this is still negative cash. This indicatesthat these companies are not achieving the expected business performance orare not sufficient to contribute to the profit of the owner company. The decreasein 2021 shows the significant impact of the Covid-19 epidemic on Gilimex. Theepidemic has narrowed the scope of activities of some business lines of jointventure companies.
<small>14</small>
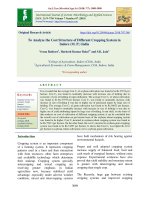
</div><span class="text_page_counter">Trang 15</span><div class="page_container" data-page="15"><b>Structure diagram property of Gilimex</b>
The structure of the company’s assets includes 2 parts: Current assets andNon-current assets. Looking at the chart of the asset structure of Gilimex, wesee that the company’s current assets account for more structure than non-current assets and over the past 3 years 2020, 2021, and 2022 structure.
The current assets structure of the company increase steadily yearby year, accounting for 79.8% in 2020, 83.7% in 2021, and 87.6%in 2022.
Cash and cash equivalents year over year both hold at around 20%reflecting the company’s financial capacity to meet short-termneeds and manage financial risks. At the same time, it also showsthe consideration in the investment and payment of the business.
Short-term financial investment over 3 years 2020, 2021, and 2022accounted for 13.2%, 12.7%, and 25%, respectively. It shows thatGilimex are tending to invest in short-term financials. This is anitem worth investing in because the first is still profitable, and the<small>17</small>
</div><span class="text_page_counter">Trang 16</span><div class="page_container" data-page="16">second is a highly liquid item after money. Thus, the use offinancial leverage is guarantee to pay off.
Short-term receivables of Gilimex in 2020 accounted for 23.3%then increased to 27.2% in 2021, but decreased to only 7% in 2022.The sharp decrease reflects improved debt management, enhancedfinancial performance and customer management, as well asenhanced risk management.
Besides, inventories and other short-term assets accounted for aquite large proportion. This is a true reflection of the company’sfield of operation.
The proportion of non-current assets decreased over the years,reflecting strategic adjustments, and the need for money andfunding. This shows that businesses are adjusting their financesand assets to respond quickly to new requirements and challengesin business operations.
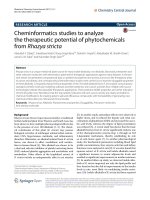
<b>Structure diagram capital and debt of Gilimex</b>
<small>18</small>
</div><span class="text_page_counter">Trang 17</span><div class="page_container" data-page="17">In 2020, the capital structure of Gilimex shows that the structure ofliabilities and equity is almost equally divided 50:50. In 2021, the structure ofliabilities accounts for more than 57% higher than equity, this is because in2021, the company has short-term debt increased to more than 2 trillion, upmore than 47% compared to the previous year 2020. It is this that makes thecapital structure have a strong change in 2021.
By contrast, in 2022, the enterprise’s equity accounted for 63%, nearlydouble liabilities (37%). This reflects the strengthening of capital sources andthe management of liabilities. This can mean balancing the finances andcreating favorable conditions for the growth and stability of the business in thelong term. It can be seen that with the difficulty of reducing revenue, thebusiness has good debt management and reacts quickly to changes.
However, in the structure of liabilities, the structure of short-term debtaccounts for most, this will cause pressures for managers because if financialleverage is short-term debt, the time to bring profit must be short, and effective,because of the short repayment period.
<small> - 500,000 1,000,000 1,500,000 2,000,000 2,500,000 3,000,000 </small>
Value Comparison Chart
<small>Current liabilitiesNon-current liabilitiesOwner's equity19</small>
</div>