PHOSPHORUS IN THE ENVIRONMENT: Natural Flows and Human Interferences pot
Bạn đang xem bản rút gọn của tài liệu. Xem và tải ngay bản đầy đủ của tài liệu tại đây (475.48 KB, 36 trang )
Annu. Rev. Energy Environ. 2000. 25:53–88
Copyright
c
2000 by Annual Reviews. All rights reserved
PHOSPHORUS IN THE ENVIRONMENT: Natural
Flows and Human Interferences
Vaclav Smil
Department of Geography, University of Manitoba, Winnipeg, Manitoba R3T 2N2
Canada; e-mail:
Key Words biogeochemical cycling, phosphates, fertilizers, eutrophication
■ Abstract Phosphorushasanumberof indispensablebiochemical roles,butitdoes
not have a rapid global cycle akin to the circulations of C or N. Natural mobilization of
the element, a part of the grand geotectonic denudation-uplift cycle, is slow, and low
solubility of phosphates and their rapid transformation to insoluble forms make the
element commonly the growth-limiting nutrient, particularly in aquatic ecosystems.
Humanactivities haveintensifiedreleases ofP. Bytheyear 2000theglobal mobilization
of the nutrient has roughly tripled compared to its natural flows: Increased soil erosion
and runoff from fields, recycling of crop residues and manures, discharges of urban
and industrial wastes, and above all, applications of inorganic fertilizers (15 million
tonnes P/year) are the major causes of this increase. Global food production is now
highly dependent on the continuing use of phosphates, which account for 50–60% of
all P supply; although crops use the nutrient with relatively high efficiency, lost P that
reaches water is commonly the main cause of eutrophication. This undesirable process
affects fresh and ocean waters in many parts of the world. More efficient fertilization
can lower nonpoint P losses. Although P in sewage can be effectively controlled, such
measures are often not taken, and elevated P is common in treated wastewater whose
N was lowered by denitrification. Long-term prospects of inorganic P supply and its
environmental consequences remain a matter of concern.
CONTENTS
1. AN ESSENTIAL ELEMENT OF LIFE 54
2. BIOGEOCHEMICAL CYCLING OF PHOSPHORUS
55
2.1 Natural Reservoirs of Phosphorus
57
2.2 Annual fluxes
60
3. HUMAN INTENSIFICATION OF PHOSPHORUS FLOWS
61
3.1 Accelerated Erosion, Runoff, and Leaching
61
3.2 Production and Recycling of Organic Wastes
62
3.3 Sewage and Detergents
63
3.4 Inorganic Fertilizers
65
3.5 Summarizing the Human Impact
67
4. PHOSPHORUS IN AGRICULTURE
69
1056-3466/00/1129-0053$14.00
53
54 SMIL
4.1 Phosphorus Uptake and Applications 69
4.2 Phosphorus in Soils
71
5. PHOSPHORUS IN WATERS
73
5.1 Losses of Dissolved Phosphorus
73
5.2 Eutrophication
74
6. REDUCING ANTHROPOGENIC IMPACTS
76
7. LONG-TERM PERSPECTIVES
80
1. AN ESSENTIAL ELEMENT OF LIFE
Life’s dependence on phosphorus is, even more so than in the case of nitrogen, a
matter of quality rather than quantity. Theelementisratherscarce in the biosphere:
In mass terms it does not rank among the first 10 either on land or in water. Its
eleventh place in the lithosphere (at 1180 ppm) puts it behind Al and just ahead
of Cl, and its thirteenth place in seawater (at a mere 70 ppb) places it between N
and I (1). The bulk of the Earth’s biomass is stored in forest phytomass, which
contains only small amounts of P. The element is entirely absent in cellulose and
hemicellulose, as well as in lignin, the three polymers that make up most of the
woody phytomass. Whereas C accounts for about 45% of all forest phytomass,
and N contributes 0.2–0.3%, P accumulated in tree trunks of coniferous trees may
be just 0.005% of that biomass, and above-ground forest phytomass averages no
more than 0.025% P (2).
The element is also absent in the N-rich amino acids that make up proteins
of all living organisms. However, neither proteins nor carbohydrate polymers can
be made without P (3). Phosphodiester bonds link mononucleotide units forming
long chains of DNA and RNA, the nucleic acids that store and replicate all genetic
information; the synthesis of all complex molecules of life is powered by energy
released by the phosphate bond reversibly moving between adenosine diphosphate
(ADP) and adenosine triphosphate (ATP). ATP is thus the biospheric currency of
metabolism. In Deevey’s memorable phrasing (4), the photosynthetic fixation of
carbon “would be a fruitless tour de force if it were not followed by the phospho-
rylation of the sugar produced” (p. 156). Thus, although neither ADP nor ATP
contains much phosphorus, one phosphorus atom per molecule of adenosine is
absolutely essential. No life (including microbial life) is possible without it (4).
Compared with its general biospheric scarcity, P is relatively abundant in ver-
tebrate bodies because bones and teeth are composite materials comprised mostly
of the P-rich ceramic constituent—hydroxyapatite, Ca
10
(PO
4
)
6
(OH)
2
, containing
18.5% P and making up almost 60% of bone and 70% of teeth—and fibrous col-
lagen, a biopolymer (5). An adult weighing 70 kg with 5 kg of bones (dry weight)
will thus store about 550gPinthemineral. In order to get the whole body P
content, this total must be extended by about 15% in order to account for P stored
in soft tissues in soluble phosphate, nucleic acids, and enzymes.
Lower average body mass and a higher share of children in the total population
of low-income countries mean the weighted global mean of human body mass is
PHOSPHORUS IN THE ENVIRONMENT 55
only about 45 kg/capita and the average total body P content is around 400 g/capita.
Consequently, the globalanthropomass contains approximately 2.5 milliontonnes
(Mt) P, the reservoir less than half as massive as that of the anthropomass N (6).
Phosphorus is, obviously, an essential human nutrient, but unlike other micronu-
trients (Ca, Fe, I, Mg, Zn), whose dietary intakes are often inadequate, it is almost
never in short supply. Its typical daily consumption is about 1.5 g/capita for adults,
well above the recommended daily allowances, which are 800mg/capita for adults
over 24 years of age and children, and 1.2 g for young adults (7). Dairy foods,
meat, and cereals are the largest dietary sources of the element.
Rising production of food—be it in order to meet the growing demand of
larger populations or to satisfy the nearly universal human preference for more
meat—has been the main cause of the intensifying mobilization of P. Commercial
production of inorganic fertilizers began just before the middle of the nineteenth
century, and their applications have been essential for the unprecedented rise of
food production during the twentieth century. However, this rewarding process
has undesirable environmental consequences once some of the fertilizer P leaves
the fields and reaches rivers, freshwater bodies, and coastal seas. Dissolved and
particulate P from point sources—above all in untreated, or inadequately treated,
urban sewage—is an equally unwelcome input into aquatic ecosystems.
Before I concentrate on these anthropogenic interferences in general, and on
P in agriculture in particular, I first offer a concise look at the element’s natural
terrestrial and marine reservoirs, and at its global cycling. I conclude—after a
closer look at P requirements in cropping, the element’s fate in soils, and its
role in eutrophication of waters—by reviewing ways to reduce the anthropogenic
mobilization of P and to moderate its losses to the environment, and by outlining
some long-term concerns regarding P use.
2. BIOGEOCHEMICAL CYCLING OF PHOSPHORUS
The global P cycle has received a small fraction of the attention that has been
devoted to the cycles of C, N, and S, the three doubly mobile elements. Although
there is no shortage of comprehensive books on global C, N, and S cycles (8–12),
there is only one recent volume solely devoted to various aspects of P in the
global environment (13); another book focuses on P in subtropical ecosystems
(14). Because C, N, and S compounds are transported not only in water but also
by the atmosphere, human interference in these cycles has become rather rapidly
discernible on the global level (as is demonstrated by rising concentrations of
CO
2
,CH
4
, and N
2
O) or, as in the case of atmospheric deposition of sulfates and
nitrates, ithashadnotableimpacts onlarge regionalorcontinentalscales. Problems
arising from these interferences—potentially rapid global warming, widespread
acidification of soils and waters, and growing N enrichment of ecosystems—are
among the most intractableenvironmental challengesfacing humanity. Biological
and agricultural databases indicate that more than 1000 papers were published
56 SMIL
on all aspects of the biospheric N cycle between 1970 and 1999, but fewer than
100 were devoted to the P cycle. Fewer intricate interactions with biota, and
simpler environmental transfers help to explain why the cycle has been so much
less studied.
Livingorganisms are important to the P cycle: Decompositionofdeadbiomass,
solubilization of otherwise unavailable soil phosphates by several species of bac-
teria, and enhanced release of P from soil apatites by oxalic acid-producing my-
corrhizal fungi are especially critical during later stages of soil development when
primary minerals have weathered away (15, 16). However, unlike C and N cycles,
which are driven by microorganisms and plants, the P cycle is not dominated by
biota, and the element’s physical transfers are greatly curtailed because it does not
form any long-lived gaseous compounds. Consequently, the atmospheric reservoir
of P is minuscule, biospheric Pflows have no atmosphericlink from ocean to land,
and increased anthropogenic mobilization of the element has no direct atmospheric
consequences.
On the civilizational timescale (10
3
years), the grand natural global P cycle
appears to be just a one-way flow, with minor interruptions owing to temporary
absorption of a small fraction of the transiting element by biota: Mineralization,
weathering, erosion, and runoff transfer soluble and particulate P to the ocean
where it eventually sinks into sediments. Recycling of these sediments depends
on the slow reshaping of the Earth’s surface as the primary, inorganic, P cycle
piggybacks on the tectonic uplift, and the circle closes after 10
7
to 10
8
years as the
P-containing rocks are re-exposed to denudation.
In contrast, the secondary, land- and water-based, cycling of organic P has
rapid turnover times of just 10
−2
to 10
0
years. Myriads of small-scale, land-based
cycles move phosphates present in soils to plants and then return a large share of
the assimilated nutrient back to soils when plant litter, dead microorganisms, and
other biomass are mineralized and their elements become available once again for
autotrophic production. This cycling must be highly efficient. As there is neither
anybioticmobilization of theelement(akinto nitrogen fixation)noranysubstantial
inputfromatmosphericdeposition(whichprovidesrelativelylarge amountsofboth
nitrogen and sulfur to some ecosystems), thenutrient inevitably lost from the rapid
soil-plant cycling can be naturally replaced only by slow weathering of P-bearing
rocks.
However, P in rocks is present in poorly soluble forms, above all in calcium
phosphate minerals of which apatite—Ca
10
(PO
4
)
6
X
2
(X being F in fluorapatite,
OH in hydroxyapatite, or Cl in chlorapatite)—is the most common, containing
some 95% of all P in the Earth’s crust. Moreover, soluble phosphates released
by weathering are usually rapidly immobilized (fixed) into insoluble forms (17).
Precipitation with Al determines the upper limit of dissolved phosphate at low
pH, whereas reactions with Ca set the maxima in alkaline soils. As a result, only
a minuscule fraction of P present in soils is available to plants as a dissolved
oxy-anion (PO
3
−4
), and the element is commonly the growth-limiting nutrient in
terrestrial ecosystems in general and in Oxisols and Ultisols in particular (18).
PHOSPHORUS IN THE ENVIRONMENT 57
The nutrient’s scarcity is usually even greater in aquatic ecosystems. Only in
shallow waters can phosphates circulate easily between sediments (which, too,
contain P mostly in poorly soluble calcium minerals) and aquatic biota; in deep
oceans P is relatively abundant only in the regions of vigorous upwelling. Again,
efficient small-scale recycling of organic P is a must, but even so, the scarcity of
the nutrient is pervasive and its availability is the most widespread factor limiting
photosynthesis in many freshwater bodies, and external P inputs control longer-
term primary production in the global ocean (19).
Comprehensive quantifications of the global P cycle, and particularly those ac-
counting for both of its continental and marine segments, have been infrequent
(20–29). Perhaps nothing illustrates the relative paucity of such exercises better
than the fact that so many estimates of P stores and flows used during the 1990s
have been either straight citations or minor adjustments of figures published for
the first time during the 1970s (22, 30). This is in contrast with major revisions and
frequent updating of many estimates concerning reservoirs and fluxes of global
cycles of C, N, and S. My new estimates for biotic reservoirs and fluxes of P should
be helpful in assessing the extent of human interventions in the cycle. All major
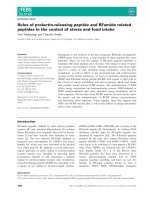
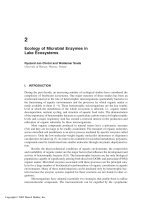
biospheric reservoirs and fluxes of P are charted in Figure 1 and summarized in
Tables 1 and 2.
2.1 Natural Reservoirs of Phosphorus
Lithospheric stores of P are dominated by marine and freshwater sediments; meta-
morphic and volcanic rocks contain a much smaller mass of the element. All
but a minuscule fraction of this immense reservoir, containing some 4 × 10
15
tP,
lies beyond the reach ofplants, as well as beyond our extractive capabilities. Since
TABLE 1 Major biospheric reservoirs of phosphorus
Total Storage
P Reservoirs (Mt P)
Ocean 93000
Surface 8000
Deep 85000
Soils 40–50
Inorganic P 35–40
Organic P 5–10
Phytomass 570–625
Terrestrial 500–550
Marine 70–75
Zoomass 30–50
Anthropomass 3
58 SMIL
Figure 1 Global phosphorus cycle. (Based on a graph in Reference 26.)
PHOSPHORUS IN THE ENVIRONMENT 59
TABLE 2 Major biospheric fluxes of phosphorus (all rates are in Mt P/year)
Annual Rate
P Fluxes (Mt P/year)
Atmospheric deposition 3–4
Erosion and runoff 25–30
Particulate P 18–22
Dissolved P 2–3
Plant uptake
Terrestrial 70–100
Marine 900–1200
Burial in marine sediments 20–35
Tectonic uplift 15–25
the middle of the nineteenth century, however, we have been mining some of the
richest and most accessible deposits of phosphate rock in order to secure P for fer-
tilizers and industrial uses (for details see section 3.4). By far the largest reservoir
of P potentially accessible by plants is in soils.
Assuming an average of 0.05% of total P in the top 50 cm of soil (31) yields
about 50 gigatonnes (Gt) P, or roughly 3.75 t P/hectare (ha). Organically bound P,
primarily in phytates and in nucleic acids, can make up anywhere between 5 and
95% of the element present in soils, and its presence is, naturally, well correlated
with that of organic nitrogen. Assuming at least5toforganic N/ha and average soil
N:P mass ratio of 12:1, the global reservoir of organic soil P would be about 5.5 Gt
(roughly 400 kg P/ha). These totals are in excellent agreement with the latest
figures used by Mackenzie et al (29), 36 Gt for inorganic and 5 Gt for organic soil
P; in contrast, the earlier estimates of 96–200 Gt of soil P are clear exaggerations
(22, 25). Phosphorus in 1.5 Gha (1 Gha = 1 billion hectares) of arable soils most
likely amounts to 5–6 Gt.
Estimates of P in biota have generally relied on global averages of elemental
ratios in phytomass. In 1934, Redfield set the average C:N:S:P ratio for marine
phytoplankton at 106:16:1.7:1 (32). This ratio has been confirmed, with small
variations, by many subsequent analyses. Applying it to the best recent estimate
of standing marine phytomass [about 3 Gt C (33)] results in some 70–75 Mt P
stored in the ocean’s phytoplankton (with an average turnover of just weeks) and,
to a much lesser extent, in marine macrophyta.
Estimates of P stored in land plants have relied on atomic C:P ratios set by
Stumm [550:1 (21)], Deevey [882:1 (4)], and Delwiche & Likens [510:1 (24)];
their published totals range from 1.95 to 3 Gt P. C:P ratios between 500:1 and
900:1 are representative of Pcontent in new leaves, but they greatly exaggerate the
nutrient’s presence in wood, which stores most of the world’s phytomass. De-
tailed analysis of 27 sites studied by the International Biological Programme
60 SMIL
resulted in average C:P mass ratio of the above-ground phytomass ranging from
about 1450:1 in boreal conifers to 2030:1 in temperate coniferous forests (2). A
global C:P mass ratio of 1800:1 for extratropical forest phytomass is perhaps most
representative.
This translates to about 0.025% P in dry above-groundphytomass, and analyses
from three continents show a very similar average for tropical forests (34). As
expected, grassland phytomass has considerably higher average P content, as do
crops, with shares around 0.2% P being common (35,36). A liberal weighted
mean of 0.05% P (forests store some 90% of all standing phytomass) results in
global storage of some 500 Mt P in the above-ground phytomass. Adding P in
global land zoomass (maximum of 10 Gt of dry weight containing less than 50 Mt
P) and anthropomass (about 3 Mt P) makes little difference to the global biomass
P total, which is definitely below 1 Gt P. Estimates of total P stores in terrestrial
biota ranging between 1.8–3 Gt P (22,25,27,29) appear exaggerated.
The surface ocean (the top 300 m) contains less than a tenth of all P in the sea,
about 8 out of 93 Gt P (29). Other published estimates of marine P range from
totals of 80 to 128 Gt P (23, 25). Less than 0.2% of all oceanic P is in coastal waters
where P levels can reach as much as 0.3 mg/L, whereas dissolved P is often nearly
undetectable in surface waters of the open ocean.
2.2 Annual fluxes
Phosphine (PH
3
), a colorless and extremely poisonous gas with a garlic-like odor,
is the only gaseous P compound that can be produced in minute amounts by some
microorganisms, but its tropospheric presence is usually undetectable. Thismeans
that, unlike C, N, or S whose stable gaseous compoundsare generated in relatively
large quantities by biota, P enters the atmosphere mostly due to wind erosion.
However, even such strong dust-bearing surface winds as the Saharan harmattan
may not deposit more than 0.1 kg P/ha on downwind areas (37). Combustion of
fossil fuels, burning of the biomass, and ocean spray are minor contributions of P
to the atmosphere.
Biomass consumed annually infires—almost 9 Gt of woody matter and grasses
(38), with averagemass C:P ratio at 1500—contains about 2.5 Mt P; combustionof
fossil fuels—about 6 Gt C/year, with C:P mass ratio at 9000—contributes 0.7 Mt
P. In both cases, however, only a small fraction of P-containing particles becomes
airborne, and theatmospheric deposition of P amounts onlyto 3–3.5 Mt/year, with
more than 90% attributable to wind-eroded particles.
Rainfall contains usually between 0.01 and 0.06 mg P/L, which means that
most places in the temperate zone would not receive annually more than 0.5–0.7
kg P/ha; actual reported values for P inputs in precipitation range from 0.05 to just
over 1 kg P/ha (39–41). Meybeck put the annual dry and wet deposition on land
at just 1 Mt P, or a mere 75 g P/ha (41). Given the low solubility of phosphates,
it is not surprising that annual losses of the element owing to leaching and runoff
have been just 0.01–0.6 kg P/ha in forests and grasslands (2, 42–44). Assuming
PHOSPHORUS IN THE ENVIRONMENT 61
that P dissolved in pristine rivers averaged no more than 40 µg P/L, the natural
riverborne transfer to the ocean was about 1 Mt P/year (11).
With no volatilization and with usually very low leaching losses, erosion and
runoff are by far the most important sources of the nutrient carried in inorganic
and organic particulates by streams to the ocean. Mean lithosperic content of
0.1% P and an average global denudation rate of around 750 kg/ha (45) would
release about 10 Mt P annually from P-bearing rocks. Iestimate the anthropogenic
intensification of this flow in the next section.
International Biological Programme forest studies foundthe average mass ratio
of C:P uptake at about 700:1 in boreal and temperate biomes (2). Similar ratios
apply to growing tropical forests and grasslands. As the best recent estimates
of terrestrial primary productivity range between 48 and 68 Gt C (46–48), the
C:P mass ratio of around 700:1 implies annual assimilation of 70 and 100 Mt P.
Using Redfield’s atomic C:P ratio of 106:1 and oceanic productivity of 36 and
46 Gt C/year (49) results in an annual uptake, and a rapid remineralization, of
roughly 900 and 1200 Mt P, the flux an order of magnitude higher than in the
terrestrial photosynthesis with its much slower cycling. Surface P eventually ends
up at the sea bottom: The rate of P burial in ocean sediments may add up to over
30 Mt P/year (29,50). Although it is unclear what drives the fluctuations, analyses
of deep sea sedimentary cores indicate that the burial rate of P has a statistically
significant periodicity of 33 million years (51).
3. HUMAN INTENSIFICATION
OF PHOSPHORUS FLOWS
Human interferences in the P cycle belong to four major categories. (a) Acceler-
ated erosion and runoff owingtothe conversionofforests and grasslands havebeen
going on for millennia, but the process has intensified since the mid-nineteenth
century with the expansion of cropping and with advancing urbanization. (b) Re-
cycling of organic wastes was quite intensive in many traditional agricultural
systems, and the practice remains a desirable component of modern farming.
(c) Untreated human wastes became a major source of P only with the emergence
of large cities, and today urban sewage, also containing phosphate detergents, rep-
resents the largest point source of the nutrient. (d) Finally, applications of inorganic
fertilizers—prepared by the treatment of phosphate rock that began in the mid-
dle of the nineteenth century—were substantially expanded after 1950 and now
amount to 13–16 Mt P/year.
3.1 Accelerated Erosion, Runoff, and Leaching
Grasslands and forests have negligible soil erosion rates compared to the land
planted to annual crops: Consequently, 75–80%, and often more than 90%, of all
soil erosion from crop fields is the consequence of losing the canopies, litter layer,
62 SMIL
and dense roots of the natural vegetation whose protective effect minimizes the
soil loss. Quantifying nutrient losses in eroding agricultural soils is a particularly
uncertain task as the erosion rates vary widely even within a single field, and as
only a few nations have comprehensive, periodical inventories of their soil loss.
US national surveys showed combined totals of water (sheet and rill) and wind
erosion ranging mostly between 10 and 25 t/ha, and the recent mean just below
15 t/ha (52,53). The global average is higher, at least 20 t/ha (6), implying an
annual loss of 10 kg P/ha and 15 Mt P/year from the world’s crop fields. Erosion
has also been greatly increased by overgrazing, which now affects more than half
(that is, at least 1.7 Gha) of the world’s permanent pastures; an erosion rate of at
least 15 t/ha would release about 13 Mt P annually from overgrazed land. Adding
more than 2 Mt P eroded annually from undisturbed land brings the global total to
some 30 Mt P/year.
Subtracting about 3 Mt P/year carried away by wind would leave 27 Mt of
waterborne P; not all of this nutrient reaches the ocean, as at least 25% of it is
redeposited on adjacent cropland and grassland or on more distant alluvia (6).
Consequently, riverborne input of particulate organic and inorganic P into the
ocean is most likely about 20 Mt/year. Howarth et al used a different reasoning to
arrive at the same result (54). To this must be added the losses of dissolved P.
Conversion of roughly 1.5 Gha of forests and grasslands to cropfields and
settlements, accompanied by an increase of 0.2 kg P/ha in solution (from 0.1 to
0.3 kg P/ha) would have added about 0.3 Mt P/year; a similar loss from 1.7 Gha
of overgrazed pastures would have doubled that loss. Even if inorganic fertilizers
were to lose 2% of their P owing to leaching, the additional burden would be
less than 0.4 Mt P/year. Enhanced urban loss owing to the leaching of lawn and
garden fertilizers, would bring up the total to just over 1 Mt P/year, doubling the
preagricultural rate to over2 Mt P/year. The grand total of particulate and dissolved
P transfer to the ocean would then be 22 Mt/year.
3.2 Production and Recycling of Organic Wastes
With average daily excretion of 98% of the ingested P (i.e. mostly between 1.2
and 1.4 g P/capita), the world’s preindustrial population of one billion people
generated about 0.5 Mt P/year at the beginning of the nineteenth century. Given
the relatively low population densities in overwhelmingly rural societies, this flux
prorated typically to just 1–3 kg P/ha, and it surpassed 5 kg P/ha only in the most
intensively cultivated parts of Asia where most of these wastes—as well as all
crop residues not used for fuel or in manufacturing and nearly all animal wastes
produced in confinement—were recycled.
Fresh manure applications of 5–10 t/ha (with solids amounting to about 15%)
were common both in Europe and in Asia, which means that such fields received
5–10 kg P/ha annually. The highest applications—30 to 40 t/ha in the Netherlands
(55) and in excess of 100 t/ha in the dike-and-pond region of the Pearl River Delta
in Guangdong (56)—transferred, respectively, up to 40 kg P/ha and over 100 kg
PHOSPHORUS IN THE ENVIRONMENT 63
P/ha. Animal wastes remain a relatively large source of recyclable P in modern
agriculture. Their total annual worldwide output is now about 2 Gt of dry matter,
of which about 40% is produced in confinement and recycled to fields (6, 57).
Dairy manures generally have the lowest, and poultry wastes have the high-
est P content; shares between 1–1.5% P in dry matter are common for well-fed
animals (58). With a conservative range of 0.8–1% of P, animal wastes contain
at least 16–20 Mt P/year, and field applications of 6–8 Mt P are equivalent to
roughly 40–50% of the P now distributed in inorganic fertilizers. With an even
distribution, every hectare of arable land would receive only around 4.5 kg P/ha,
but manures contribute much more in some regions with high concentrations of
domestic animals.
Animal manures contain almost half of all P available for the agricultural use
in Western Europe, and a quarter of all P available in the United States (59), but
because of their bulkiness, uneven distribution, and prohibitive cost of application
beyond a limited radius, they supply much smaller fractions of the overall need.
The Netherlands is perhaps the most obvious exception: Because of the country’s
large animal husbandry supported by imports of concentrate feeds, P in Dutch
manure surpasses crop requirements even on the national average, and the nutrient
voided in confinement is about twice the mass applied annually in phosphatic
fertilizers; consequently, the Dutch manuring should be more accurately called
land disposal of enormous volumes of waste (60).
Some fields thus receive applications in excess of 200 kg P/ha every year, and
even with washout rates of no more than 1–2% several kg P/ha can be lost every
year. Similarly, P recycled in manures during low-density grazing amounts to just
1–2 kg P/ha, but with high cattle densities (up to three heads/ha of pasture) the
annual deposition may be up to 12 kg P/ha, and the runoff on compacted soils
may carry away more than 0.5 kg P/ha. Much higher losses of the nutrient are
associated with huge feedlots holding thousands of animals: These lots generate
the nutrient with densities of hundreds of kg P/ha, and the runoff losses under
unfavorable conditions may amount to several kg P/ha.
Recyclingofcropresiduesisa much smaller input of P into theworld’scropping
than is the application of manures. Roughly half of the annual output of 3.75 Gt of
dry biomass of crop residues (mostly cereal straws) is not removed from fields (6),
and with P content ranging mostly between 0.05 and 0.1% they recycle between
1–2 Mt P. Also, an organic source of P that was actually the first widely used
commercialfertilizerisnow entirelynegligiblein the globalbalanceofthenutrient:
Guano, solidified bird excrements accumulated on arid tropical and subtropical
islands, has relatively high (typically 4–5%) P content, and it was used most
intensively (largely for its relatively high N content) between 1840 and 1870 (61).
3.3 Sewage and Detergents
Centralized wastewater treatment, an innovation that began in large cities of the
late nineteenth-century Europe and North America, shifted the disposal of human
64 SMIL
waste from land to water. As a result, a multitude of previously small and diffuse
sources of water pollution was replaced by a smaller number of large waste outlets
to the nearest stream or a water body. The same process has been going on during
thepasttwogenerationsin growingurbanareasofAsia,LatinAmerica,andAfrica.
In 2000 the global population of just over 6 billion people released almost 3 Mt P
in its wastes. Nationwide generation rates are as highas 9 kg P/haof cultivated and
settled land in such densely inhabited countries as Egypt and Japan. The mean
in the US is only 0.7 kg, and the global average is about 2 kg P/ha. With the
exception of Africa, most of this waste now comes from cities rather from rural
areas.
Sewering of urban wastes is still far from universal. Although it has been the
norm in European and North American cities for more than a century, large shares
of the poorest urban inhabitants in low-income countries, particularly those living
in makeshift periurban settlements, have no sewage connections. Lessappreciated
is the fact that in Japan, one of theworld’s most urbanized countries (about80% of
Japanese live in cities), the share of all households connected to sewers surpassed
50% only in 1993 (62).
To 1.2 g P/capita discharged daily from food must be added 1.3–1.8 g P/capita
from other urban sources, above all from industrial and household detergents. The
recent decline in the P content of clothes-washing detergents has been partially
offset by the increased use of dishwashing compounds, and so it is unlikely that
per capita discharges in affluent countries will fall below 2 g P/day (63). Annual
output—at least 0.75 kg P/capita—then translates to 100–150 kg P/ha in most large
Western urban areas where virtually all wastes are sewered; in such extremely
crowded urban areas as Shanghai’s core or Hong Kong’s Mongkok, the annual
waste generation goes up to 200 kg P/ha (26).
Primary sedimentation of urban sewage removes only 5–10% of all P and it
retains much of the element in organic form, and return of the sludge to crop fields
is generally limited owing to the common presence of heavy metals (64, 65). Use
of trickling filters captures l0–20% of all P, but aeration used during the secondary
water treatment transforms nearly all of the organic P into soluble phosphate, and
the waste stream can thus contain 10–25 mg P/L. Phosphates in solution can be
precipitated in insoluble salts by adding flocculating compounds, usually salts of
Fe (FeCl
3
or FeCl
2
) to produce FePO
4
,Al(Al
2
(SO
4
)
3
) to produce AlPO
4
, or lime
(CaO) to generate Ca
5
(PO
4
)
3
OH (66). Addition of the reagents before the primary
sedimentation removes 70–90% of all P, and 80–95% removal is possible with
repeated dispensation.
This treatment is expensive, however, and it increases sludge mass by 50% and
volumeby up to 150%, and even if there were no heavy metals in the sludge it is not
a suitable fertilizer, as the excess Fe or Al can remove dissolved phosphates (67).
That is why bacterial P removal is now the preferred way of treatment: Standard
activated sludge treatment removes15–40%ofallP, andwhentheactivated sewage
sludge is subjected to vigorous aeration it can sequester more phosphate than is
required for its microbial activity (68).
PHOSPHORUS IN THE ENVIRONMENT 65
If half of all human wastes were eventually released to waters (the rest being
incorporated into soils and removed in sludges) the annual waterborne burden
wouldbearound1.5Mt P.TothismustbeaddedP releases from theuseofsynthetic
detergents. Sodium tripolyphosphate (Na
5
P
3
O
10
) and potassium pyrophosphate
(K
4
P
2
O
7
) are low-cost compounds that have been widely used in production of,
respectively, solid and liquid detergents. They were commercially introduced in
1933, but their use grew rapidly only after World War II: By 1953 they accounted
for more than 50% of the US sales of cleaners; a decade later they reached 75%
of the market, and during the 1960s, they contributed about 33% of all P released
into sewage water in large US cities (69). Since the early 1970s their use has
been banned or restricted in many countries, but there are indications that the
alternatives are hardly more acceptable from the environmental point of view
(70).
3.4 Inorganic Fertilizers
The modern fertilizer industry actually began with the production of phosphatic
compounds based on Liebig’s idea that P would be more soluble in water if bones
were treated with H
2
SO
4
(71). James Murray became the first commercial vendor
to use this process in 1841 (72). Two years later John Bennett Lawes’s factory at
Deptford on Thames started producing the calcium phosphate—Ca(H
2
PO
4
)
2
,now
commonly known as ordinary superphosphate (OSP)—by treating P-containing
rocks with dilute sulfuric acid. Coprolites from Gloucestershire and, later, from
East Anglia, were the first raw material and were used until the end of the century.
Expansion of the OSP industry stimulated search for phosphate deposits. They
are found either as igneous or sedimentary rocks: The first category is made up
of the three primary species of apatite, whereas varieties of carbonate-fluorapatite
(francolite) dominate both marine and freshwater sediments (73). Extraction of
high-quality apatite started in 1851 in Norway; phosphate mining in the United
States began in North Carolina in the late-1860s, but Florida extraction became
dominantin1888,andthe UnitedStateshasbeenbyfartheworld’s largestproducer
of phosphate rock ever since (74,75).
Depending on the treated mineral, the OSP contained between 7–10% (8.7%
was the standard) of available P, an order of magnitude more than the commonly
recycled P-rich manures. (Agricultural literature almost always uses the phospho-
ric oxide, P
2
O
5
, rather than P as the common denominator when comparing P
fertilizers: In order to convert P
2
O
5
to P, multiply by 0.4364. Table 3 lists major P
fertilizerswiththeirPcontent.) OSP wasalsoa richersourceofthenutrientthanthe
basic slag, available as a by-product of smelting phosphatic iron ores, which was
commercially introduced during the 1870s and contained 2–6.5% P. Treating the
phosphate rock with phosphoric acid, a process that began in Europe during the
1870s, increased the share of soluble P two to three times above the level in
OSP, and the compound generally known as triple superphosphate (TSP) contains
20% P.
66 SMIL
TABLE 3 Major phosphate fertilizers
Nutrient content
Compound Acronyms Formulas (% P)
Monocalcium phosphate MCP Ca (H
2
PO
4
)
2
8–9
or ordinary superphosphate OSP
Dicalcium phosphate DCP CaHPO
4
· H
2
O17
Triple superphosphate TSP Ca (H
2
PO
4
)
2
19–20
Monoammonium phosphate MAP NH
4
H
2
PO
4
21–24
Diammonium phosphate DAP (NH
4
)
2
HPO
4
20–23
Monopotassium phosphate MKP KH
2
PO
4
17
Two of the world’s three largest producers of phosphate rock were added be-
tween the world wars. Huge Moroccan deposits were discovered in 1914 and their
extraction started in 1921. They are the prime example of marine phosphorites—
formed either in areas of upwelling ocean currents along the western coasts of
continents (besides Morocco, most notably in Namibia, California, and Peru) or
along the eastern coasts where poleward-moving warm currents meet cool coastal
countercurrents (Florida, Nauru)—which contain the bulk of the world’s phos-
phate. The former USSR opened its high-grade apatite mines in the Khibini tundra
of the Kola Peninsula in 1930. Such deposits, associated with alkaline igneous
rocks, are much less abundant. Palabora, South African is another major location.
The only sizeable discoveries after World War II occurred in China and Jordan.
More than 30 countries are now extracting phosphate rock, but the global output
is highly skewed: The top 12 producers account for 95% of the total, the top 3
(United States, China, and Morocco) for 66%, and the United States alone for 33%.
Florida extraction has also the lowest production cost among the major producers.
Between 1880 and 1988 extraction of phosphate rock grew exponentially, passing
the 1 Mt/year mark in 1890, 10 Mt/year in the early 1920s, 100 Mt/year by the
mid-1970s, and 150 Mt/year in 1985; during the late 1990s, the annual output
averaged about 140 Mt P, but capacity was over 190 Mt P (76). The mined rock
(80% of it come from sedimentary deposits, and more than 75% from surface
mines) contains anywhere between more than 40% to less than 5% of phosphate,
and after beneficiation the rock concentrate has 11–15% P.
As with many other mineral resources, the average richness of mined phosphate
rock has been slowly declining, from just above 15% P in the early 1970s to just
below 13% P in 1996 (59). Less than 2% of the extracted rock is applied directly
to acidic soils as a fertilizer (77). Preparation of enriched fertilizers claims about
80% of the beneficiated rock, and the rest is used mostly to produce detergents
(12%) and as additives to animal feeds (about 5%).
Global consumption of all P fertilizers surpassed 1 Mt P/year during the late-
1930s, reached 5 Mt P/year by 1960 and over 14 Mt P/year in 1980 (26). The
PHOSPHORUS IN THE ENVIRONMENT 67
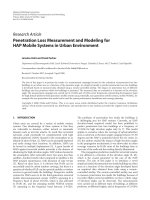
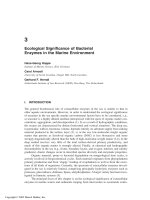
Figure 2 Consumption of inorganic phosphatic fertilizers, 1900–2000. (Based on data from
References 76, 79.)
peak consumption of about 16.5 Mt P/year in 1988 was followed by a nearly
25% decline to 12.6 Mt P/year by 1993 (Figure 2), (78,79). This was due to
a combination of declining fertilization rates in the European Union, Japan, and
North America, and sharply lower fertilizer use in post-communist economies of
the former Soviet Union and Europe. Slow growthofthe global extraction resumed
in 1994, but the peak level of 1988 may notbe reached before the year 2005. Low-
income countries now consume just over 60% of all P fertilizers, and they also use
about 50% more P per average hectare of farmland than do affluent nations—but
still less than half than the amount in per capita terms.
Cumulative anthropogenic transfer of P from rocks to the biosphere can be
quantified fairly accurately because relatively reliable global statistics on the pro-
duction of P fertilizers havebeen available since the very beginning of the industry.
Between 1850 and 2000, the Earth’s agricultural soils received about 550 Mt P, an
equivalent of almost 10% of arable soils’ total P content.
3.5 Summarizing the Human Impact
At the beginning of the nineteenth century, crop harvests assimilated about 1 Mt
P/year, and anthropogenic erosion and runoff were at least 5 Mt P/year in ex-
cess of the natural denudation rate. In contrast, in 2000 the global crop harvest
incorporated about 12 Mt P, and increased soil erosion from crop fields and de-
graded pastures mobilized about twice as much P as did the natural denudation
(Table 4).
In 1800 the preindustrial population of 1 billion people generated about 0.5 Mt P
in human wastes; domestic animals voided over 1 Mt P, and recycled organic
matter returned less than 0.5 Mt P to agricultural soils. In 2000, 6 billion people
generate about 3 Mt P/year in human waste, and more than 4 billion domesticated
mammals and more than 10 billion domesticated birds void more than 16 Mt P
in their urine and feces. At least 7, and up to 10, Mt P/year are returned to soils
68 SMIL
TABLE 4 Human intensification of the global phosphorus cycle (all values are in
Mt P/year)
Preindustrial Recent
Fluxes Natural (1800) (2000)
Natural fluxes intensified by human actions
Erosion >10 >15 >30
Wind <2 <3 >3
Water >8 >12 >27
River transport >7 >9 >22
Particulate P >6 >8 >20
Dissolved P >1 <2 >2
Biomass combustion <0.1 <0.2 <0.3
Anthropogenic fluxes
Crop uptake — 1 12
Animal wastes — >1 >15
Human wastes — 0.5 3
Organic recycling — <0.5 >6
Inorganic fertilizers — — 15
in recycled organic matter, and around 15 Mt P are applied annually in inorganic
fertilizers.
Thepasttwocenturieshavethusseenaroughly 12-fold expansionoftheamount
of nutrient assimilated by crops, of the total mass of animal wastes, and of the
amountofrecycledorganicmatter.In1800,anthropogenicmobilizationofP owing
to increased erosion was equal to about 33% of the total continental flux of the
nutrient. At the beginning of the twenty-first century, erosion and runoff in excess
of the natural rate and applications of inorganic fertilizers account for at least 75%
of the continental flows of the nutrient (Table 4).
Natural losses of P from soils to air and waters amounted to about 10 Mt/year.
In contrast, in 2000 intensified erosion introduces on the order of 30 Mt P into the
global environment, mainly because human actions have roughly tripled the rate
at which the nutrient reaches the streams (Table 4). A variable part of this input is
deposited before it enters the sea, but the total annual riverborne transfer of P into
the ocean has at least doubled; its regional rate is now approaching 1.5 kg/ha in
the Northeastern United States, and it is over 1 kg P/ha both in Northwestern
Europe and in the part of the Iberian peninsula draining to the Atlantic Ocean (80).
However, the study of the riverine N and P budgets in the North Atlantic Ocean
that determined these rates also concluded that almost 70% of the region’s P flux
comes from the Amazon and Tocantins basins, largely particulate P resulting from
high erosion rates in the Andes. In contrast, old, denuded landscapes of East-
ern North America contribute relatively little P—the Hudson’s Bay watershed
discharges a mere 45 g P/ha/year (80)—and most of the region’s riverborne P
PHOSPHORUS IN THE ENVIRONMENT 69
must be attributed to conversion of natural ecosystems to cropland, to still ad-
vancing urbanization, and to now stabilized, but relatively high, applications of P
fertilizers.
4. PHOSPHORUS IN AGRICULTURE
Besides its irreplaceable role in fundamental biochemical reactions, adequate
amounts of P in plants also increase the response to applications of N and K.
The nutrient is especially important for young tissues in order to promote root
growth, flowering, fruiting, and seed formation. Good P supply also improves the
rate of nitrogen biofixation and maintenance of soil organic matter, whose pres-
ence enhances the soil’s water-holding capacity and reduces erosion (81). Phos-
phorus deficiencies are not usually marked by specific signs but rather by overall
stunting.
Predictably, both the P uptakes and average applications of P fertilizers vary
fairly widely withspecies, cultivars, and yields. Althoughthe average applications
of inorganic P have stabilized, or declined, in nearly all high-income countries
they remain very inadequate throughout most of the poor world. The fate of P
in agricultural soils has been among the key concerns of soil science, and a new
consensus that has emerged during the last generation has overturned the tradi-
tional paradigm that saw inorganic P applications as extraordinarily inefficient.
However, given the sensitive response of aquatic autotrophs to P enrichment, even
relatively small losses of agricultural P to waters may contribute to undesirable
eutrophication.
4.1 Phosphorus Uptake and Applications
Large post-1950 increases in yields mean that today’s best cultivars remove 2–3
times as much P as they did two generations ago: For example, English wheat
removed about 7 kg P/ha in 1950, 13 kg P/ha in 1975, and 20 kg P/ha in 1995
(82). Typical harvests now take up (in grains and straws) between 15–35 kg P/ha
of cereals, 15–25 kg P/ha in leguminous and root crops, and 5–15 kg P/ha in
vegetables and fruits (83). The highest rates can top 45 kg P/ha for corn, sugar
beets, and sugar cane. The total based on separate calculations for all major field
crops shows that the global crop harvest (including forages grown on arable land
butnot the phytomass produced on permanent pastures) assimilates annually about
12 Mt P in crops and their residues (Table 5). Cereals and legumes account for
most of the flux, containing 0.25–0.45% P in their grains (only soybeans have
0.6% P), and mostly only 0.05–0.1% P in their straws (81).
In contrast, weathering and atmospheric deposition most likely supplied no
more than 4 Mt P to the world’s croplands (Table 6). Consequently, organic recy-
cling and applications of P fertilizers are essential for producing today’s harvests—
and as the use of manures and crop residues is limited by the number of animals,
size of the harvest, and cost of recycling, dependence on inorganic fertilizers will
70 SMIL
TABLE 5 Annual assimilation of phosphorus by the world’s
crop harvest during the mid-1990s
Crop
Harvest P residues P P uptake
Crops (Mt) (%) (Mt) (%) (Mt P)
Cereals 1670 0.3 2500 0.1 7.5
Sugar crops 450 0.1 350 0.2 1.2
Roots, tubers 130 0.1 200 0.1 0.3
Vegetables 60 0.1 100 0.1 0.2
Fruits 60 0.1 100 0.1 0.2
Legumes 190 0.5 200 0.1 1.1
Oil crops 110 0.1 100 0.1 0.2
Other crops 80 0.1 200 0.1 0.3
Forages 500 0.2 1.0
Total 3250 3750 12.0
TABLE 6 Phosphorus budget for the world’s
cropland during the mid-1990s
Annual flows
Flows (Mt P)
Inputs 24–29
Weathering 2
Atmospheric deposition 1–2
Organic recycling 7–10
Crop residues 1–2
Animal manures 6–8
Synthetic fertilizers 14–15
Removals 11–12
Crops 8–9
Crop residues 3
Losses
Erosion 13–15
Balance 0–2
Input shares (%)
Organic recycling (7/24–10/29) 29–34
Inorganic fertilizers (14/24–15/29) 52–58
Uptake efficiency (%) (11/24–12/29) 41–45
PHOSPHORUS IN THE ENVIRONMENT 71
rise even in the case of an early stabilization of the global population. Global
applications of fertilizer compounds average just over 10 kg P/ha of arable land;
continentalmeansrangefromabout 3kgP/hainAfrica toover25kgP/ha in Europe
(78, 79). National averages hide enormous intranational variation: For example,
North Dakota spring wheat receives just around 10 kg P/ha, while applications to
Iowa corn surpass 60 kg P/ha (84).
The latest international survey of fertilizeruse (85) shows that nearly two thirds
of the nutrient were used on cereals (20% on wheat, 14% on rice, 13% on corn),
oilseeds (about 10%), roots and tubers (6%), and vegetables (about 5%). The
highest national applications to wheat are now in China (about 35 kg P/ha), Italy,
France, and the United Kingdom, and to rice in Japan (just over 40 kg P/ha) and
South Korea (85). Data acquired worldwide at about 60,000 sites over a period of
25 years (86) show, as expected, awide range of responses to P fertilization. These
trials are usually done in combination with the other two macronutrients, but
responses to individual nutrients show that high phosphate applications (above 20
kg P/ha) result in additional yields of between 10–25 kg/ha per kg of applied P for
both wheat and rice, and up to 30 kg/ha for corn.
4.2 Phosphorus in Soils
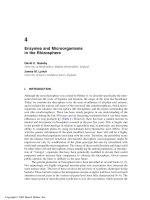
Phosphorus applied to soilsis involved in amultitude of complex reactions that re-
moveitfromthe solution andincorporateitintoa largevariety ofmuchlesssoluble,
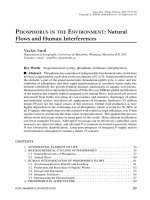
or insoluble, labile and stabile compounds (Figure 3). Dissolution of a superphos-
phate granule reduces the acidity of soil water in its immediate surroundings to
pH of only 1–1.5 and releases Al, Fe, Ca, K, and Mg compounds in soil particles;
they react with fertilizer P and produce relatively insoluble, and hence immobile,
compounds (17, 87).
Figure 3 Phosphorus cycle in soil. (Simplified from a drawing in Reference 153.)
72 SMIL
This process of fixation (also referred to as immobilization or retention) of P
was first described in 1850, and ever since it has been one of the most researched
subjects in soil science (17, 87, 88). The most intriguing question has been to find
out how much of the nutrient is irreversibly fixed in the soil soon after appli-
cation and how much becomes eventually available to subsequent crops. The
long-prevailing view saw a rapid P fixation of the applied nutrient as dominant—
and the use of fertilizers was then inevitably seen as an overwhelmingly irre-
versible but laborious, costly, and energy-intensive transfer of the element from
extracted and treated rocks to insoluble soil phosphates. As Tinker concluded in
1977, “The central problem in the world phosphate economy consists largely
of digging out phosphorus at one place and storing it in the soil at another”
(89:103).
Reality is more complex and more encouraging (90). Sandy soils and soils with
nearly neutral pH have relatively little fixation, whereas acidic, clayey soils with
high Fe and Al content have the highest fixation capacity. Crop response to water-
soluble phosphates is thus strongly dependent on the overall P fixation capacity
of fertilized soils. Once this fixation capacity is satisfied, additional P applications
will be needed just to replenish the nutrient removed by the crop and to make up
for waterborne and erosional losses.
Continuing additions of P in manures and fertilizers may result in consider-
able annual surpluses of the nutrient in a variety of agroecosystems. Frissel &
Kolenbrander’s (91) comprehensive reviews found P gains in about three quarters
of all studied agroecosystems, withthemean annual gain of over 7 kg P/ha. Recent
national surpluses average as much as 40 kg P/ha in the Netherlands, closeto 30 kg
P/hainFrance, about25kgP/hainGermany, and 10 kg P/hainEngland(83,92).At
the same time, the formation of P compounds with limited solubility restricts the
immediate losses and allows the crops to use the applied P in succeeding years.
Although the crops may recover no more than 15–25% of fertilizer P during
the year of the application, more stable accumulated P can be released gradually
into the soil solution once the reserves of less strongly held nutrient are exhausted
(93). A great deal of evidence confirms that the eventual efficiency with which
they utilize the applied P is at least as high as is their uptake of N. Recovery rates
of between 50–60% are not uncommon, and some agroecosystems use the applied
P with efficiencies as high 70–90% (91–93). My conservatively calculated global
P budget in cropping implies average P utilization efficiency of about 45% and an
annual gain averaging up to 1.5 kg P/ha (Table 6).
Gradualacceptanceofthisrealityhasdone awaywiththetraditionallyexcessive
use of phosphates: Worldwide N/P ratio in applied fertilizers was as low as 1.6
until the late-1940s, it passed 2 in 1955, 4 by 1975, and 5 a decade later; during
the 1990s it ranged between 5.6–6.1 (78,79). In countries with the most intensive
fertilization it has recently been even higher, as high 7.2 in China. Notsurprisingly,
recent recommendations are for reduced P inputs, but without synthetic fertilizers
many agroecosystems would have a net P loss.
PHOSPHORUS IN THE ENVIRONMENT 73
5. PHOSPHORUS IN WATERS
Thermal stratification of water bodies—with the warmer, and relatively shallow,
surfacelayer(epilimnion)overlying cooler deeperlayers(hypolimnion)—severely
restricts the upward flow of nutrients (94). As phytoplankton die and sink, epil-
imnion P can be rapidly depleted, and only prompt bacterial decomposition in the
water column can recycle the nutrient whose turnover may be measured in just
weeks, or even days, during the peak photosynthetic season. Turnover of scarce P
is similarly rapid in pelagic marine ecosystems (95).
In spite of this rapid recycling, P is commonly the growth-limiting nutrient,
and the inadvertent fertilization of streams, and even more soof freshwater bodies,
estuaries, and shallowcoastal waters, can changethemfirstfromoligotrophic (poor
in nutrients) to mesotrophic (moderately rich in nutrients) and eventually even to
hypereutrophic (extremely well nourished). Excessive growth and eventual decay
of algae and aquatic macrophytes have a number of undesirable ecosystemic and
economic consequences.
5.1 Losses of Dissolved Phosphorus
SubstantialretentionofPas it movesdeeper in soilsmeansthatsubsurfacedrainage
of the nutrient is, unlike in the case of often serious leaching of N fertilizers, fairly
small; the only exceptions arise from heavy applications of animal slurries, on
acid organic, peaty soils, and in tiled-drainage fields (88,96). Consequently, the
two globally most important ways of introducing excessive P into water are the
releases of untreated or inadequatelytreated wastewater into streams or lakes from
cities and industries (considered to be point sources), and discharges in the runoff
from crop fields and pastures (diffuse sources).
As already noted (section 3.1), the worldwide anthropogenic loss of dissolved
P from land is on the order of one Mt P/year, roughly equal to the natural rate.
The overall loss of just over 2 Mt P/year divided into the annual global stream
flow of 27,000 km
3
(97) prorates to about 80 µg/L of river water. With the conti-
nental precipitation mean of about 0.8 m/year, this would translate to an average
discharge of about 0.6 kgP/ha of land. Undisturbed watersheds covered by climax
forests or grasslands discharge up to an order of magnitude less, whereas the flux
from densely inhabited and intensively fertilized watersheds may be several times
higher.
Dissolved P amounts to anywhere between less than 0.1% and almost 5% of
the nutrient applied in inorganic fertilizers, and the annual loss rates may vary by
as much as fourfold (98, 99). Rates between 1–2% are common, which means that
watersheds heavily fertilized by a combination of manures and phosphates may be
discharging several kg P/ha every year. Indeed, concentrations as high as 30 mg
P/L were recorded soon after the application of pig and cattle slurry, and annual
measured losses of soluble P from fertilized fields go up to about 3 kg P/ha (100).
74 SMIL
Contributions of point and diffuse sources to a watershed’s P discharge cannot
be quantified with high accuracy, but there have been numerous reconstructions
of nutrient budgets assigning approximate load shares to these P releases. During
the 1970s, urban and industrial wastes accounted almost always for at least 60%,
and up to 75%, of all P inputs in populated watersheds of Europe, North America,
and Japan (42). Subsequent restrictions on the use of P-containing detergents and
better ways of wastewater treatment have generally reduced the contributions of
point sources and made agricultural discharges more prominent, or even dominant:
P discharges from croplands, pastures, and rangelands now account for more than
80% of the nutrient’s release to surface waters in the United States (101).
However, even relatively low diffuse discharges may be of concern. Iowa corn-
fields receiving 40–65 kg P/ha annually and losing less than 0.2 kg/ha (or no more
than 0.5%) as soluble P will be releasing water with concentrations of just 0.2–
0.5 mg P/L (100), but because of extremely low threshold of algal response to
P enrichment, particularly in shallow lakes with long hydraulic residence times,
such levels are highenough to precipitate eutrophication. This means that even the
best agronomic practices may not be able to prevent P losses producing eutrophi-
cation of sensitive waters: Cropping without fertilization, or return of the land to
permanent pasture or forest would be the only ways to lower the P loss.
5.2 Eutrophication
Phosphorus-induced eutrophication is due above all to the element’s high “lever-
aging” effect on phytomass production and to its trigger effect on the cycling of C
and N. According to Redfield’s ratio, a single atom of P supports the production
of as much phytomass as 16 atoms of N and 106 atoms of C; although there is
no mechanism in freshwater ecosystems that allows for adjustments in the rapid P
cycle in order to maintain Redfield’s ratio, N and C cycling will respond promptly
once P is added (102). Because aquatic photosynthesis cannot be readily toxified,
even wastes with a relatively high content of heavy metals can be an effective
source of P.
As total P in water increases, the standing phytomass goes up linearly. This
relationship breaks at P concentrations around 0.1 mg/L; above that level other
factors (especially light availability) become more important. In a formerly clear-
water lake, a mere 10 µg P/L can make the water cloudy, reducing its clarity from
9 to 3 m (39). Expressing this in terms of actual mass input makes the sensitivity to
P-induced eutrophication even clearer; a concentration of 10 µg P/L is equivalent
to just 5 kg P in a 10-hectare lake with average depth of 5 m, andsuch an amount of
dissolved P can be discharged from just 5–10 ha of intensively fertilized farmland
in that lake’s catchment! Higher P concentrations will further reduce water clarity;
those above 50 µg P/L will result in the deoxygenation of bottom waters and will
have costly effects on using the water for drinking and recreation.
During the late-1960s, concerns about eutrophication helped to launch, together
with worries about persistent pesticides and nitrates in drinking water, the era of
PHOSPHORUS IN THE ENVIRONMENT 75
public environmental awareness. Vollenweider’s pioneering work (103) was fol-
lowed during the next two decades by a large number of general appraisals as well
as by many local or regional studies (42, 104–113). The interest has been some-
what less intensive during the 1990s (114–121). Basic conclusions have remained
unchanged during the past generation. Concentrations above 0.01 mg/L of dis-
solved P are likely to cause eutrophication, but it is the nutrient supply (loading),
rather than the P or N concentration in water, thatis the key anthropogenic factor in
the process. Comparisons of polluted lakes and estuaries have shown that exces-
sive eutrophication can be generally prevented if annual loadings are lower than
1 g P/m
2
(10 kg P/ha) of water surface (122).
However, the same comparisonsalso confirmed that much higher loadings may
not cause serious problems as long as the average retention time of imported
nutrients is short. For example, during the 1970s neither the Tyne nor the Thames
estuaries—receiving, respectively, 1900 and 1100 kg P/ha, perhaps the highest
P loadings recorded worldwide—were eutrophic because the average retention
time of their waters was just 2 and 5 weeks, respectively, compared with one year
for the hypereutrophic Potomac estuary, whose average loading was only 43 kg
P/ha (122). In his now classical treatment, Vollenweider (106) took care of these
realities as he expressed the proneness to eutrophication by relatingtotal P loading
(g P/m
2
/year) to the quotient of mean depth and hydraulic residence time.
As already noted, transparency and color are the most obvious indicators of the
nutrient condition of a water body: Transparent oligotrophic waters support low
plant productivity and appear either blue or brown (when stained in peaty regions);
eutrophic waters have high primary productivity as large amounts of phytoplank-
ton make them turbid and limit their transparency to less than 50 cm. Advanced
eutrophication is marked by blooms of cyanobacteria (commonly Anabaena, Aph-
anizomenon, Oscillatoria) and siliceous algae (Asterionella, Melosira), scum-
forming algae (such as Phaeocystis pichetii), and potentially toxic algae such as
Dinophysis and Gonyaulux. Eventual decomposition of this phytomass creates
hypoxic or anoxic conditions near the bottom, or throughout a shallow water
column.
The most worrisome problems arising fromthese changes range from offensive
taste and odor of drinking water (requiring expensive treatment before consump-
tion) and formation of trihalomethanes during chlorination (123) to serious health
hazards to livestock and people ingesting soluble neuro- and hepatotoxinsreleased
by decomposing algal blooms (124). Fortunately, phosphates themselves are toxic
to people or animals only in very high concentrations. Reduced fish yields, exten-
sive summer fish kills, and changed composition of fish species in affected water
bodies are common as species adapted to turbid waters become dominant (114).
Submersed rooted macrophytes are reduced or eliminated owing to excessive
shading. At the same time, such submersed but weakly rooted species as Eurasian
milfoil (Myriophyllum spicatum) that absorb most of their nutrients from water,
may grow excessively, entangling swimmers as well as boat propellers. Another
particularly offensive consequence of eutrophication includes the growth of thick
76 SMIL
coats of algae on any submerged substrates, be they aquatic plants, stones, docks,
or boats. Because of decades of heavy P applications and high densities of popu-
lation and animal husbandry, Dutch water bodies are particularly affected (125).
Although total P inputs were cut by about 50% by 1995 compared with 1985,
P-saturated soils remain a large source of excessive runoff, and many surface
waters have P concentrations an order of magnitude above the natural levels.
Eutrophication also seriously disrupts coastal ecosystems in regions receiving
high P inputs. Perhaps no other instance is as worrisome as the effects of P dis-
chargesfromQueensland’sgrowing population and agriculture, which nowrelease
about four times as much P as was the natural rate along the coast. Resulting eu-
trophication threatens the Great Barrier Reef, the world’s largest coral formation,
by smothering coral with algae as well as by promoting the survival and growth of
the larvae of Acanthaster planci, the crown-of-thorns starfish, which has recently
destroyed large areas of the reef (126). Experiments with artificial N and P enrich-
ment of microatolls have shown that although both N and P stimulate the growth
of algae, which block sunlight from reaching deeper waters and make the coral
brittle and stunted, only P inhibits the calcification of corals (127).
As the Baltic Sea unfortunately demonstrates, in the absence of vigorous water
exchange with the open ocean, even a whole sea can become eutrophic. In 1990,
the Baltic Sea received about 80,000 t P, eight times the rate in 1900, and the
nutrient’s concentrations in its water were, on the average, about four times higher
than in 1950; nitrogen enrichment, though not as large in relative terms, was also
substantial (128). As a result, a third of the sea bottom of the Baltic proper (the
southern part of the sea) is now intermittently deprived of oxygen, a condition that
also results in formation of toxic H
2
S by S-reducing bacteria and precludes the
survival of previously very common mussels and bottom fish. On the other hand,
increased phytoplanktonic production on shallow bottoms with well-oxygenated
water has provided more food for herring and sprat.
6. REDUCING ANTHROPOGENIC IMPACTS
As with all anthropogenic burdens, the best way to reduce the impact of P on
the biosphere is to minimize the initial inputs; controlling the escaping element
or compound is the usual strategy in modern high-consumption societies, but it
is only the second-best choice. The most fundamental opportunity to minimize
the inputs is to reduce the intake of animal foods whose production requires first
high P inputs in growing the requisite feed and then entails unavoidably large
P losses in animal wastes. The nutritional status of people in affluent countries
would not be compromised in the slightest if people were to consume 25% less
meat and dairy products than the current average (this would still leave the annual
per capita mean at more than 50 kg of meat and above 100 kg of dairy foods);
because 66% of all phosphatic fertilizers are used on cereals and 60% of all grains
in rich countries are used as animal feed, the need for phosphatic fertilizers would
PHOSPHORUS IN THE ENVIRONMENT 77
decline by 10% without any investment. This shift would lower P applications in
high-income countries by about 15%.
Given the factthat more than 40% of the global cereal harvestisusedfor feeding
domestic animals (and the share is over 60% in many affluent countries), fertilizer
applications can also be reduced by more efficient feeding. The bulk (60–70%) of
P in most cereal and leguminous grains is organically bound in phytic acid and
hence almost indigestible for monogastric (nonruminant) mammals that lack the
requisite enzyme (phytase) to free the phosphate from the molecule (129). This
necessitates addition of inorganic P to animal diets and results in large losses of P
in excreted manure. Addition of phytase and enhanced utilizationof phytate could
thus substantially reduce P excretion by pigs.
Legislated limits have already been used to restrict the release of P from point
sourcesandapplicationsofPinbothorganicandinorganicfertilizers. Restrictions,
or outright local bans, on the use of P-containing detergents enacted during the
1970s lowered the P concentrations in urban sewage. In North America, the
US Federal Water Pollution Control Act Amendments and US-Canadian Water
Quality Agreement restricted all point sources discharging more than 3800 m
3
/day
to concentrations of less than 1 mg P/L beginningin1972 in the Lake Erie and Lake
Ontario basins, and since 1978 in the entire Great Lakes basin. Since 1995 sugar
cane farmers in Florida havecut their P discharges into the EvergladesAgricultural
Area by nearly 70% compared with the levels prevailing during 1979–1988, rather
than just by the mandated 25% (130).
Gradual Dutch restrictions on P applications may be copied in the future by
many other countries. Limits on the number of animals in problem areas were
introduced in 1984; three years later came the limits on the amount of manure
produced, and in 1998 all farms had to adopt mineral accounting that restricted
allowable P losses to 40 kg of P
2
O
5
(about 17.5 kg P/ha); this rate will be halved
by 2008 (60,63). Farmers exceeding this standard will have to pay a proportional
levy.
Inputs of P fertilizers can be lowered by relying on a variety of well-tested
best management practices (6,118, 121). Direct measures should always include
fertilizer applications based on recommendations derived from repeated soil tests;
P applications may also be omitted for several years on soils with high P content
without affecting yield. Maintenance of a proper soil pH and the incorporation,
rather than broadcasting, of fertilizers and manures are no less important. The last
practice is particularly effective for manuring; broadcastdairy manure may release
five times as much P as the waste incorporated into soil. Timing of applications
is also important; those immediately preceding intensive rains will be associated
with much larger losses. And because phosphate diffuses horizontally only about
3 mm from the applied particle, fine distribution of P fertilizers allows for lower
applications producing higher yields (67).
Variable rate fertilizing, a principal ingredient of precision farming, is another
input-saving technique based on the recognition of spatial variability of nutrient
distribution in a field. Instead of managing fields as homogeneous units fertilized