Lập trình .net 4.0 và visual studio 2010 part 17 pptx
Bạn đang xem bản rút gọn của tài liệu. Xem và tải ngay bản đầy đủ của tài liệu tại đây (222.15 KB, 7 trang )
CHAPTER 5 PARALLELIZATION AND THREADING ENHANCEMENTS
111
Scheduling on UI thread
TaskScheduler supports the ability to schedule items on the UI thread, saving you from writing some
tedious marshalling code. For more info on this please refer to
archive/2009/04/14/9549246.aspx.
Parallel Debugging Enhancements
Writing parallel and threaded applications is hard. To help, Microsoft has added additional debugging
features to the Visual Studio IDE (premium versions include additional profiling features). To
demonstrate these features, we will create a new simple console application.
Create a new project called Chapter5.Debugging and enter the following code:
using System.Threading.Tasks;
static void Main(string[] args)
{
Task task1 = Task.Factory.StartNew(() => startAnotherTask());
Task task2 = Task.Factory.StartNew(() => startAnotherTask());
Task task3 = Task.Factory.StartNew(() => doSomething());
Console.ReadKey();
}
static void startAnotherTask()
{
Task task4 = Task.Factory.StartNew(() => doSomethingElse());
}
static void doSomething()
{
System.Threading.Thread.Sleep(500000);
}
static void doSomethingElse()
{
System.Threading.Thread.Sleep(500000);
}
Put a breakpoint on the line that reads as follows:
Task task3 = Task.Factory.StartNew(() => doSomething());
The first feature we will look at is the Parallel Task window.
Parallel Task Window
This window shows you all the tasks that are currently running and contains features for filtering and
jumping directly to where the task is declared.
Run the application in debug mode, ensuring that you have added a breakpoint to the first line.
When the breakpoint is hit on the main menu, go to DebugWindowsParallel Tasks (Ctrl+Shift+D+K)
CHAPTER 5 PARALLELIZATION AND THREADING ENHANCEMENTS
112
and you will see a window like the one shown in Figure 5-5 that allows you to review the current status of all
your tasks.
Figure 5-5. Parallel Tasks debugging window
The Parallel Tasks window offers the following functionality:
• You can order the view by clicking the column headings.
• You can group tasks by status by right-clicking the status column and selecting
Group by status.
• To show more detail about a task, right-click any of the headings and check the
options you want to view. Note that Parent is a useful option that displays the ID of
the parent task that created it (if any).
• You can double-click the task to be taken into the code that task is running.
• Tasks can be flagged to help you identify them and filter views. To flag a task,
simply click the flag icon on the left side.
• Tasks can have one of four statuses: running, scheduled, waiting, or waiting-
deadlocked. If you have a task with waiting or deadlocked status, move the mouse
over the task to display a tooltip of what it is currently waiting for.
• Tasks can be frozen by right-clicking them and selecting the Freeze Assigned
Thread option. Select the Thaw Assigned thread option to unfreeze them.
CHAPTER 5 PARALLELIZATION AND THREADING ENHANCEMENTS
113
TIP
When debugging parallelized applications, it is also useful to have the threads window open by going to
DebugWindowsThreads.
Parallel Stacks Window
The Parallel Stacks window enables you to visualize multiple call stacks within one window. It operates
in two modes, Task or Thread, which can be changed in the drop-down menu in the left corner.
We will take a look at the Thread mode (the Task mode is very similar, but shows only tasks), so
make sure that Threads is selected in the drop-down menu.
Figure 5-6. Parallel Stacks window: Thread view
At first the Parallel Stacks window can look a bit confusing:
• Threads are grouped together by the method (context) they are currently in,
indicated by a box.
• The blue border around a box shows that the current thread belongs to that box.
• The yellow arrow indicates the active stack frame of the currently executing thread
(in this case, the main method).
Figure 5-7 shows the Parallel Stacks window operating in Task mode.
CHAPTER 5 PARALLELIZATION AND THREADING ENHANCEMENTS
114
Figure 5-7. Parallel Stack window: Task view
The Parallel Stacks window offers the following functionality:
• If you hover the mouse over a box, the current associated thread ID will be shown
in the tooltip.
• You can jump to the individual associated frames by right-clicking a box and
selecting Switch To Frame on the context menu.
• If a box is associated to only one thread (indicated by 1 in the boxes header), you
can double-click the box to be taken to the code associated with that stack frame.
There are a number of view options on the Parallel Stacks window. Reading from left to right, they
are as follows:
• Show only flagged: Filters whether currently flagged tasks are displayed.
• Toggle Method view: Select a “box” on the diagram and then select this option. The
current method then appears in the center of the view, showing the methods that
call and are called from this method.
• Toggle top down/bottom up display: The default is that the initial thread is shown at
the base of the view with subsequent calls above it. Select this option to invert the
display.
• AutoScroll option: Moves the windows focus automatically as you step through the
code to the currently executing frame.
• Toggle Zoom Control option: Controls whether to display zoom control to the left of
the diagram. Note that you can zoom in and out by pressing Ctrl and moving the
mouse scroll wheel.
• Birds-eye view button: On larger diagrams, when scroll bars are visible in the
Parallel Stacks window, you can click between them to quickly move around the
diagram
• Individual threads: Right-clicking on an individual thread brings up a context menu
that allows you to switch to the task, frame, source code, setup symbols, and so on.
CHAPTER 5 PARALLELIZATION AND THREADING ENHANCEMENTS
115
NOTE
Daniel Moth has recorded some great screen casts and written some excellent articles on parallel
debugging at
PLINQ (Parallel LINQ)
PLINQ is the parallelized version of LINQ to objects and supports all existing LINQ operators and
functionality with a few new options for fine-grained control of parallelization functionality. The new
functionality has been introduced through the interface IParallelEnumerable<T>> that inherits from
IEnumerable<T>>.
At the time of writing, LINQ to SQL and LINQ to Entities will not benefit from parallelization because
in these cases the query is executed on the database or the provider, so .NET cannot parallelize it.
Why Not Parallelize All LINQ Queries Automatically?
Parallelizing LINQ queries automatically is potentially the ultimate goal for LINQ, but it can introduce
some issues (particularly around ordering), so at present you have to opt in to the parallel model.
A WORD OF WARNING
When using PLINQ, it is important to ensure that your query does not modify the result set because this might have
unforeseen effects if values are utilized later in the query. PLINQ will do its best to work out best how to process the
query (including not running it in parallel at all), but do you really want to take the chance of weird, scary, and hard-
to-reproduce bugs?
Hello PLINQ
This example iterates through all the objects in the stock list, calls an external service, and processes the
result.
Writing such a query in traditional LINQ might look something like this:
var query = from s in Stocks
let result = StockService.CallService(s)
select result;
To run the same query in parallel, simply use the .AsParallel() extension method to the Stocks
object:
var query = from s in Stocks.AsParallel()
let result = StockService.CallService(s)
select result;
It really is as easy as that (well almost ).
CHAPTER 5 PARALLELIZATION AND THREADING ENHANCEMENTS
116
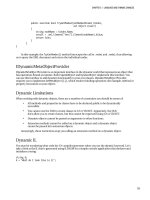
Ordering Results
To order the results of your queries, use the AsOrdered() method to tell .NET to buffer the results before
sorting them. This will slow the query down slightly because PLINQ now has to do additional work to
preserve the ordering:
var query = from s in Stocks.AsParallel().AsOrdered()
orderby s.Company
let company = s.Company
let result = StockService.CallService(s)
Note that the AsUnordered() operator can be used to tell PLINQ that you no longer care about
ordering items.
ForAll Operator()
Iterating through the results of a LINQ query requires that all the output be merged together. If results
ordering is not important, you should use the ForAll() operator, which avoids merging the results set,
thus executing more quickly:
query.ForAll(result => Console.WriteLine(result));
TIP
Query performance can also be further increased by using the orderby clause in your LINQ query when
combined with a filtering operation such as where because the ordering will then be applied only to the filtered
results.
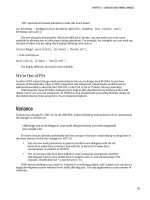
AsSequential()
The AsSequential() method forces PLINQ to process all operations sequentially, which can sometimes
be required when you are working with user-defined query methods:
var query = from s in Stocks.AsParallel().AsSequential()
let result = StockService.CallService(s)
select result;
WithMergeOptions
The WithMergeOptions operator allows you to tell PLINQ how you want results to be merged when
processing is complete. PLINQ is not guaranteed to do this, though. WithMergeOptions operates in three
modes:
• NotBuffered: Results are returned sooner, but slower overall.
• FullyBuffered: Quickest option but results are returned slowest.
• AutoBuffered: Chunks items returned and offers a middle ground between the
other two options.
CHAPTER 5 PARALLELIZATION AND THREADING ENHANCEMENTS
117
PLINQ performance
Sometimes the overhead of parallelizing a query can actually make it perform more slowly than if it was
run sequentially, so be sure to measure your queries’ performance. LINQ queries are not actually
executed until you enumerate through them (deferred execution), so measuring performance can be
slightly harder. Thus if you want to measure the performance, be sure to iterate through the data in the
result set or call a method such as ToList.
TIP
Visual Studio Premium edition onward also contains a parallel performance analyzer, which allows you to
compare the performance of queries.
Cancelling a PLINQ Query
You can cancel a PLINQ query by passing in a CancellationTokenSource, which is discussed very shortly,
into the WithCancellation() method.
Exceptions and Parallel LINQ
When a query is run in parallel, exceptions can occur in multiple threads. PLINQ aggregates these
exceptions into an AggregateException class and returns them back to the caller. You can then iterate
through each individual exception.
If you run the following example, you need to modify a setting in the IDE to see it working. To do
this, go to ToolsOptionsDebuggingGeneral and uncheck the Enable Just my code option or run in
Release mode.
//select stock that doesnt exist
var query = from s in Stocks.AsParallel()
let result = StockService.CallService(Stocks[11])
select result;
try
{
query.ForAll(result=>Console.WriteLine(result.ToString()));
}
catch (AggregateException e)
{
foreach (var ex in e.InnerExceptions)
{
Console.WriteLine(ex.Message);
}
}