Spinal Disorders: Fundamentals of Diagnosis and Treatment Part 19 pot
Bạn đang xem bản rút gọn của tài liệu. Xem và tải ngay bản đầy đủ của tài liệu tại đây (145.28 KB, 10 trang )
sodically within a 6-month period or last for more than 3 months [47]. Back and
neck pain within non-specific spinal disorders are frequently accompanied by
other types of musculoskeletal pain, bodily complaints, psychological distress
and, especially in chronic cases, amplified dysfunctional cognition (e.g. catastro-
phizing) and pain behavior [81]. It is important to keep in mind that LBP of less
than 7 days’ duration is not a disease. However, a complaint can turn into a com-
plex syndrome.
Low Back Pain
Low back pain is common and appears as pain, muscle tension, or stiffness local-
ized below the costal margin and above the inferior gluteal folds, with or without
leg pain (sciatica) [54].
With respect to the cause of back pain the so-called “diagnostic triage”[99,
100] classification has become standard. It divides low back pain into three cate-
gories:
specific spinal pathology
nerve root pain/radicular pain
non-specific low back pain
Back pain often is divided into three large groups with respect to its location,
aggravating factors, and temporal nature: referred pain, axial pain, and radicu-
lar pain.
axial or mechanical pain (neck, dorsal, back) is restricted to the lower back
area and gets worse with certain activities or positions.
referred pain comes and goes and varies in intensity. It starts in the low
back area and commonly spreads into the groin, buttocks and upper
thighs.
radicular pain is deep and usually constant. It radiates down the leg accord-
ing to the dermatone and is accompanied by numbness or tingling and mus-
cle weakness. This type of pain is caused by injury to a spinal nerve. Some of
the possible causes are a disc herniation or foraminal stenosis.
The lifetime prevalence
of LBP ranges between
75% and 85%
About 75–85% of all individuals will experience LBP at some time during their
life (lifetime prevalence). Most epidemiological studies do not differentiate
between types of pain [66]. The lifetime prevalence for associated leg pain seems
to be about half that of back pain in general, and the lifetime prevalence of sciatic
pain is estimated to be much lower, approximately 3–5% [40].
The yearly prevalence of back pain is estimated to range from 15% to 20% in
the US and from 25% to 45% in Europe. The natural history of LBP is usually
favorable and most individuals recover within 2–4 weeks; of the remainder, more
than 90% resolve within 12 weeks [3]. A complete view of back-related work
absence in Jersey/the UK showed that 3% of those starting absence in 1994 and
who were out of work for 6 months or more caused 33% of social benefit costs
[108]. This population based study also showed that recurrent episodes are asso-
ciated with longer work absences, and that more specific diagnoses are associ-
ated with longer absences than non-specific back pain and back injuries [108]. In
a review of 36 studies, Hestbaek and colleagues reported that, after a first episode
of low back pain, the proportion of patients who report recurrent episodes after
12 months was on average 62%, and the percentage who had relapses of work
absence was 33% [42]. Pengel and colleagues showed that 73% of patients had at
least one recurrence within 12 months [71]. Return to work in the first month
after an initial episode of LBP is high (82% of those initially off work), and some
further improvement appears in the subsequent 3 months. Thereafter levels for
156 Section Basic Science
pain, and disability, and return to work remain almost constant [71]. There is
increasing evidence that non-specific back pain in adults shows a fluctuating,
recurrent and intermittent course that may ultimately lead to a chronic phase
[19]. The unstable and episodic nature of LBP and the uncertainty of onset of any
episode make estimation of the incidence of LBP difficult. The figures of up to
36% for the 12-month incidence may overestimate the “true” incidence of real
first time episodes of pain [19].
Neck P ain
Neck pain located by a mannequin drawing is most often defined as pain occur-
ring in the area from the occiput to the third thoracic vertebra [21, 22]. Neck
pain seems to be lesscommon than low back pain, but there is limited epidemio-
logicaldataonneckpaincomparedwithlowbackpain[66].Manystudies
Neck and shoulder pain
are often associated
examine shoulder pain together with neck pain, reporting prevalence numbers
for neck and shoulder disorders (NSD) to be high in industrialized countries
[66]. Recently Fejer and coworkers showed in their review of 56 epidemiological
studiesthatneckpainiscommoninmanyareasoftheworldandnumbersdid
not differ systematically with most definitions of neckpain (i.e. pain, ache, trou-
blesome, soreness) [35]. However, numbers are higher when definitions like
stiffness are used, and numbers are lower when neck pain of longer duration or
high severity is assessed. Numbers did not differ systematically depending on
whether the shoulder region was included or not, nor was the quality of studies
systematically related to prevalence rates. Point prevalence rates ranged
between 5.9% and 22.2% in adult populations with a mean point prevalence of
7.6%. Mean week-prevalence was slightly higher (12.5%), and increased with
theperiodoftimecapturedinprevalencedata(23.3%in1-monthprevalence,
29.8% in 6-month prevalence, 37.2% in 1-year prevalence, and 48.5% in lifetime
prevalence) [35].
Whiplash associated
disorders may result from
cervical sprain (frequently
rear-end collision)
The so-called whiplash associated disorder denominates injury-related neck
pain and subsequent associated disorders (see Chapter
30 ). It was first specifi-
cally defined as an acceleration-deceleration injury (usually related to accidents
in vehicles), but later on the term whiplash syndrome was adopted for all types of
neck injuries [66]; nonetheless, the causal link to trauma is not well documented.
Although neck pain following trauma is common, few studies to date have
included a control group in order to compare neck pain after injury with preva-
lence and incidence rates to be expected in the absence of a trauma [66]. Accord-
ing to Schrader and coworkers [82], the period prevalence of neck pain after
trauma of around 35 % equaled the prevalence in a control group.
Incidence and course
of neck pain is less well
documented compared
with LBP
Compared with low back pain, there is lessknowledge about the incidence and
course of neck pain. In the Saskatchewan Health and Back Pain Survey,apopula-
tion-based cohort study of Saskatchewan adults, the incidences of neck pain and
back pain were assessed [18, 19, 22]. The age and gender standardized annual
incidence of neck pain was 14.6% (back pain: 18.6%). The annual rate of resolu-
tion of neck pain was 36.6% (back pain: 26.8%). Contrary tothe popular belief of
many clinicians, most individuals with neck pain do not experience complete
resolution of their symptoms and disability.
Pain, Impairment and Disability
Impairment defines an abnormality in structure or functioning of the body that
may include pain, and disability defines the reduction in the performance of
activities. Because in non-specific spinal disorders the etiology is uncertain, the
establishment of impairment in these disorders is often less clear-cut than that of
Epidemiology and Risk Factors of Spinal Disorders Chapter 6 157
20041994
Year
100
80
60
40
20
0
Per cent Days off Work
28.0
23.4
6.6
8.1
7.2
8.4
7.8
4.4
12.0
13.6
13.2
15.5
25.2
26.6
Other
Digestion
Cardiovascular
Psychiatric
Respiratory
Injuries
Musculoskeletal
Figure 1
Work disability caused by disorders in Germany in 1994 and in 2004 [94]. Note: Within musculoskeletal disorders in 2004,
the most frequent diagnosis was back pain ICD-10 M54 (7.7 % days off work).
disability. Disability at work and in one’s private life includes restrictions in the
individual’s major role and limitations in social and recreational activities. Indi-
vidual functional losses include subcategories of functional capacity, such as
mobility (part of the activities of daily living, transportation, leisure activities,
sexual activities and other social role handicaps – occupation and household). It
Pain and disability
must be differentiated
is also important to make a distinction between pain and disability.Painanddis-
ability differ in their risk factors, prevalence and incidence, and they have devel-
oped very differently in their prevalence rates over time. An historical review [2]
has indicated that people have always suffered from back pain, but back pain dis-
ability shows a trend for a steady increase over time. For example, Donald [27]
reported a 208.5% increase in back pain disability in the UK between 1978 and
1992 compared with a 54.6% increase in other types of disability. In Germany, in
2003, musculoskeletal complaints (ICD XIII) caused 24.9% of days of work
absence [94]. The mean number of absence days per LBP episode was among the
highest (18.2 days), with only psychiatric disorders (ICD V) causing longer spells
(28.5 days) [94]. In Germany and some other countries, however, the trend for an
increase in absence days in recent decades has stopped and numbers seem to
have leveled off [94].
Disability causes great loss of productivity at home and at work, and the eco-
nomic burden of chronic disability has become enormous in both the developing
and industrialized countries [26].
Risk factors and obstacles
to recovery potentially can
differ for pain and disability
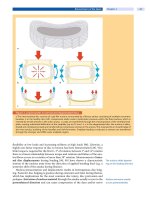
The Glasgow Illness Model is an operational clinical model of low back disabil-
ity [99, 104] that includes physical, psychological, and social elements (
Fig. 2). It
assumes that most back and neck pain starts with a physical problem, which
causes nociception, at least initially. Psychological distress may significantly
amplify the subjective pain experience and lead to abnormal illness behavior.
158 Section Basic Science
Sick role
Illness behavior
Distress
Physical
Problem
Figure 2
Glasgow Illness Model of Disability [99]. This operational model of
low back disability describes the development from a physical prob-
lem causing nociception to illness behavior and an alteration of
the social role.
High levels of pain and illness behavior alter social function, and the individual
may adopt a “sick role”. A small minority of patients persist in the sick role, expe-
riencing high levels of pain, even though the initial cause of nociception should
have ceased and healing should have occurred.
Burden of Spinal Disorders
Back pain related heath care utilization is common [55]. Musculoskeletal com-
plaints account for about 10–20% of primary care visits and are the second most
common reason for consulting a doctor [76].
Papageorgiou and Rigby [70] characterized the back pain related contact with
medical services by applying a one-in-five rule of t humb: One in five of the popu-
lation experience backpain at any one period of time; of these, one in five consult
their GP; and one in five of those consulting are referred to a specialist. One in
five of those attending outpatients are admitted to hospital, and one in five of
those admitted undergo surgery for back pain.
Low back pain has a severe
impact on the individual,
families, and society
Musculoskeletal complaints are second only to respiratory disorders as a
cause of short-term sick leave [87], and are the leading cause of long-term
absence from work (>2 weeks) in many countries [11]. Furthermore, muscu-
loskeletal complaints are among the leading causes of long-term disability [94,
102]. Individual disability includes subcategories of functional capacity, such
as mobility (part of the activities of daily living, transportation, leisure activi-
ties, sexual activities and other social role handicaps – occupation and house-
hold). As such, non-specific back pain is often accompanied by psychological
distress (depression or anxiety), impaired cognition and dysfunctional pain
behavior.
Economic Costs
The estimation of costs depends largely on the perspective that is chosen, such as
the societal perspective, the patient’s perspective, the health insurance perspec-
tive, the health care provider perspective or the perspective of companies.
Whether results are comparable depends largely on the chosen perspective. Eco-
nomic evaluations usually refer to a societal perspective. In that case, all relevant
outcomes and costs are measured, regardless of who is responsible for the costs
and who benefits from the effects. Since spinal disorders result in high costs to
society, there have been an increasing number of economic evaluations. Van
Epidemiology and Risk Factors of Spinal Disorders Chapter 6 159
Table 2. Direct costs of musculoskeletal disorders
ICD 10 Diagnosis 1994 direct costs
for treatment (%)
1997 direct costs for
treatment (billions DM)
XIII Musculoskeletal disorders 12.6 48.8
X Respiratory disorders 5.2 20.1
XIX Injuries, poisonings 7.8 30.2
V Psychiatric disorders 10.9 42.2
Others 63.5 245.7
Total 100 387
Cost estimates according to Thiehoff [89]
Table 3. Lost work days and lost productivity due to musculoskeletal disorders in 2003
ICD 10 Diagnosis Lost work days
(millions)
% Lost productivity
(billions EUR)
In %
GNP
XIII Musculoskeletal disorders 116.50 24.9 10.60 0.50
X Respiratory disorders 66.05 14.1 6.01 0.28
XIX Injuries, poisonings 61.04 13.0 5.55 0.26
V Psychiatric disorders 45.54 9.7 4.14 0.20
According to Deutsches Bundesministerium für Wirtschaft und Arbeit (2003) Bericht der Bun-
desregierung: Sicherheit und Gesundheit bei der Arbeit. />Roer, Boos and van Tulder recently gave an introduction to cost analysis [91]. The
economic burden of spinal disorders includes:
direct,
indirect, and
intangible costs
Direct costs concern medical expenditure, such as the cost of prevention, detec-
tion, treatment, rehabilitation, and long-term care. Direct costs of spinal disor-
ders are estimated to be high. For instance back pain was estimated to cost the
National Health Service in Britain £480 million in 1994 and accounted for
£1.4billioninsocialsecuritycosts[20].
The total costs of low
back pain are enormous,
and are predominantly
caused by disability
Indirect costs consistoflostworkoutputattributabletoareducedcapacityfor
activity, and result from lost productivity, lost earnings, lost opportunities for
family members, lost earnings of family members, and lost tax revenue. In Ger-
many, musculoskeletal disorders are the most expensive form of work disability
for companies and cause almost 27% of all production downtime due to sick
leave from work. Estimates of direct and indirect annual costs of musculoskeletal
disorders add up to approximately 24.5 billion euros for the labor force and
approximately 38 billion euros for the total population [89]. However, working
with spinal disorders produces additional loss as recently shown by Hagberg,
Tornqvist, and Toomingas [37] in employees working at video display units. Par-
ticipants in this study rated their loss in productivity due to musculoskeletal
problems in the last month compared with the previous month. Among those
with no sick leave in the last month, 6.1% of women and 8.3% of men reported
alossofproductivityasaresultofmusculoskeletaldisorders.
Finally, intangible costs are the most difficult to estimate. Intangible costs
include psychosocial burdens resulting in reduced quality of life, such as job
stress, economic stress, family stress, and suffering.
Reports dealing with direct and indirect costs from different countries have
recently been reviewed and discussed [36, 56, 59].
The direct and indirect costs are considerable and their management utilizes
a significant part of the gross national product of many countries. However, as
160 Section Basic Science
with prevalence rates, estimates of costs differ considerably due to the use of
varying definitions and cost methodologies [59].
Risk Factors
LBP is multifactorial in originIn non-specific low back and neck pain there is no clear etiology; in these disor-
ders, pain is a symptom rather than an illness. There are individual characteris-
tics as well as conditions of work and lifestyle factors that relate to the reporting
of symptoms. Four important points should be made here:
Non-specific low back and neck pain cannot be understood when looking at
single factors alone. Multiple factors are involved.
Risk factors contribute differently with respect to predicting development,
persistence,andrecurrence of symptoms.
Risk factors differ for pain reporting, disability,andpain behavior. In addi-
tion, risk factors differ for morphological alterations such as disc herniation
and disc degeneration.
The association of risk factors with non-specific low back and neck pain is
probabilistic not deterministic, i.e. an individual showing a risk factor has
an increased likelihood of developing symptoms in the future, but it is not
inevitable, and the individual may instead remain symptom free.
Risk factors can be categorized into several domains:
individual factors
morphological factors
general psychosocial factors
occupational physical factors
occupational psychological factors
Individual Risk Factors
Byfarthemoststronglypredictiveriskfactorforneckpainandlowbackpainis
previous neck pain and low back pain [41,81]. Recent studies have indicated that
some of the strongest predictors of disc degeneration and LBP are genetic factors
[6,69].Researchinadultmonozygotictwinswhodifferintheirhistoryofwork-
related and other risk factors showed that a considerable amount of disc degener-
ation is due to heredity [6]. The genetic influence in disc degeneration was con-
siderably higher than the influence of work-related factors, which were previ-
ously thought to be most strongly related to disc degeneration. The genetic influ-
ence on neck and back pain is less clear [34, 39] and seems to depend on age [39].
Genetic influences on back and neck pain might therefore be indirect via mor-
phological factors, or via factors that influence the reporting of neck and back
pain, i.e. there might be a genetically determined tendency for psychological dis-
tress, aswas recently found in a study on adult female monozygotic and dizygotic
twins [60]. Besides the influence of genetic factors on spine morphology, there
are also various factors such as birth weight and smoking during pregnancy that
can affect the development of the vertebral canal [49]. Other individual charac-
teristics affecting susceptibility to spinal disorders include:
Age, gender, and body
weight are established
risk factors
age >50 years [100], most likely linked to pain via degenerative diseases
gender, with females being more likely to report neck and back pain, and
menbeingmorelikelytohaveahighernumberofdaysabsentfromwork
[67, 94], and diagnosed hernia [67]
obesity
Epidemiology and Risk Factors of Spinal Disorders Chapter 6 161
general health status and comorbidity
smoking
sedentary lifestyle [44]
Recent reviews show that the evidence for body weight, smoking and physical
inactivity as risk factors is comparably small [81]. Among various individual
characteristics of children (including gender, body height, body weight, trunk
asymmetry, thoracic kyphosis and lumbar lordosis), it was shown that being
female and having a short stature at 11 years of age predicted the incidence of
neck pain [74].
Evidence is increasing
that genetic factors
are related to disorders
that involve discs
With respect to physical activity during leisure time, there is not much evi-
dence for a general association of sports and musculoskeletal symptoms, but a
sedentary lifestyle is associated with a higher prevalence of LBP and sick leave
[44]. There appears to be a weak positive association between increased body
height and disc herniation. Obesity, regardless of height, is associated with disc
degeneration and LBP [38, 45]. Low income and lower social class are risk fac-
tors, but analyses including multiple risk factors show more specific factors to be
behind these categories [81].
Morphological Risk Factors
Morphological factors are
poorly correlated with pain
Disc herniation and disc degeneration are often present in asymptomatic indi-
viduals, a finding that confirms that low back pain symptoms, pathology and
radiological findings are not strongly interrelated [8, 16, 30, 50]. Vertebral frac-
tures are not necessarily related to pain [51]. In a recent review, van Tulder and
coworkers reported that degeneration, defined by the presence of disc space nar-
rowing, osteophytes, and sclerosis, was associated with non-specific low back
pain, although the associations were only moderate [92]. Spina bifida, transi-
tional vertebrae, spondylosis and Scheuermann’s disease did not appear to be
associated with low back pain [92]. Patients reporting back pain in spondylolysis
and spondylolisthesis are often classified as having non-specific low back pain
because a considerable proportion of patients with such anatomical abnormali-
ties are asymptomatic [85, 92]. The anatomical incidence is about 5% [111].
Among patients reporting back pain, MRI findings of mild to moderate com-
pression of spinal nerves, disc degeneration or bulging, and central stenosis were
not found to correlate closely with the severity of symptoms [8, 48].
In one large epidemiological study, the one-year incidence of cervical radicu-
lopathy was 83/100000 [75]; the incidence of lumbar radiculopathy is probably
much higher.
Psychosocial Fa ctors
In accordance with the Glasgow Illness Model, epidemiological research indi-
cates that psychosocial factors are an integral part of the pain disability process.
Evidence is increasing that psychosocial factors have more impact on low-back
pain disability than do biomechanical factors [66].
There is strong evidence that psychosocial variables are associated with the
reporting of back and neck pain [105]. Inappropriate attitudes and beliefs about
back pain (for example, the belief that back pain is harmful or potentially
Depression and anxiety
are the best explored
risk factors
severely disabling, or high expectations of passive treatments rather than a belief
that active participation will help), inappropriate pain behavior (for example,
fear-avoidance behavior and reduced activity levels), low work satisfaction, and
emotional problems (such as depression, anxiety, stress, tendency to low mood
and withdrawal from social interaction) are strongly linked to the transition
from acute to chronic pain and disability [66, 93].
162 Section Basic Science
Occupational Physical Risk Factors
Heavy physical work is asso-
ciated with LBP
There is evidence that there is a moderate association between the incidence
(onset) of back pain and heavy physical work [100]. With regard to disc herniation
in males, higher incidence rates are found in the wholesale trade industry (10.7/
10000), manufacturing (8.9/10000), and construction (8.4/10000) than in the ser-
vice sector (2.8/10000) and finance and insurance (2.2/10000) [67]. When national
health statistics include the nature of injury or illness by major events or exposure,
nearly 95% of exposures labeled as “overexertion” and “repetitive motion”include
musculoskeletal complaints [67]. Within private industry in the US, more than half
of the cases of illness and injury that mention “overexertion” refer to frequent lift-
ing. Cases filed in connection with overexertion and repetitive motion mostlyrefer
to the region of the back (52%) and upper extremities (26%), but rarely to the neck
[67]. Interestingly, although the proportion of people involved in heavy work has
decreased in industrialized countries, there has been a concomitant increase in the
number of people with work disability [99]. Furthermore, the rate of musculoskel-
etal disorders of the back is higher in many non-manufacturing industries than in
manufacturing industries [67]. These discordant trends for heavy physical work
and LBP disability suggest that while heavy work may be a contributory factor in
the onset of non-specific back pain it isnot a cause in many cases of workdisability.
There is some evidence, however, that the physical demands of work may influence
theeaseofreturnafteranepisodeofpain[29].
Physical risk factors for the development of occupational back pain include:
heavy physical work related to overexertion [39]
manual materials handling including repetitive motion [39, 100, 101]
twisting and bending [100, 101]
frequent lifting [100, 101]
awkward postures [100, 101]
whole body vibration [57]
For the cervical spine the most consistently identified physical risk factors
include [66]:
exposure to repetitive movement of arms or neck and arm
static load on the neck region
segmental vibration exposure through hand-held tools
rapid acceleration deceleration movements (whiplash)
Occupational Psychological Risk Factors
Psychosocial work factors
are associated with
disability and return to work
There is increasing evidence that the work factors leading to chronic disability
are more psychosocial than biomechanical [9]. Musculoskeletal disorders are
closely connected with occupational health psychology not only via biomechani-
cal and environmental strains, but also through occupational variables such as
task related and social stressors, control at work, job satisfaction, and support
from supervisors and coworkers. The evidence for psychosocial risk factors in
back pain [46] and neck pain [4] has been the subject of recent reviews.
Work-related psychosocial factors associated with spinal disorders are [29]:
a rapid work rate
monotonous work
low job satisfaction
low social support
low decision latitude
job stress
Epidemiology and Risk Factors of Spinal Disorders Chapter 6 163
The way an individual copes with work factors, and how people attribute symp-
toms as being related to work factors, also influences the course of the disorder,
especially in relation to return to work after treatment [86].
Absence of Evidence for Certain Risk Factors
Remember:
Absence of evidence
is not evidence of absence
Epidemiology contributes to the search for evidence for various risk factors in the
development of LBP. However, also of importance is the absence of evidence for
other factors. Non-evidence has now accumulated for various factors of impor-
tance to our understanding of the development, diagnosis and treatment of LBP:
limited diagnostic and prognostic value of medical imaging in non-specific
back pain [8, 10]
no positive effect but negative effect of bed rest [25, 98, 103]
no negative but positive effects of early return to work [17]
LBP in children and adolescents more common than previously thought [88]
no seasonal impact [43]
The contribution of medical imaging in predicting the development of future LBP
in non-symptomatic individuals is limited [10]. Prolonged bed rest for sciatica is
notbeneficial[25,98].Bedrestmaybeinsteadariskfactorforpoorrecoveryin
acute LBP [103]. Early return to work after an episode of pain, and even return to
work with a moderate level of prevailing pain, is nota risk factor for recurrent pain
episodes but may in contrast be beneficial in preventing recurrent episodes [17].
For many years, LBP in children and adolescents was considered to be rare and an
indication of serious disease [1]. More recent epidemiological studies have shown
that the prevalence of non-specific LBP in children is high, reaching that of adults
by the end of the growth period, and psychological factors such as beliefs about
general health also seem to predict the first reports of painepisodes [88]. Contrary
to widespread belief in practitioners and patients, the empirical evidence for sea-
sonal variation in the prevalence of neck and back pain is minimal [43].
Geographical Variation
The reporting of back and
neck pain exhibits substan-
tial geographical variations
Epidemiological knowledge about prevalence of neck andback pain in developing
countries is relatively small. Recently Fejer, Kyvik, and Hartvigsen included 56
studies on prevalence rates in their study on neck pain in the world population
[35]. Almost half the studies (46%) were from Scandinavia, 23% from the rest of
Europe, 16% from Asia, and 11% from North America. Two papers were from
Australia and one was from Israel. The mean one-year prevalence rates were
higher in Scandinavian countries (36%) compared with the rest of Europe (26%)
and Asia (13%), but the differences were not statistically significant. Two studies
from the Tokelau Islands (small islands in the South Pacific Ocean) reported life-
time prevalence rates for neck pain that were very low [109] or close to zero [110].
Violinn [95] also reported lower prevalence rates for low back pain in farmers liv-
ing in Nigeria, southern China, Indonesia, and the Philippines. Of note was the
finding that low back pain was more common among inhabitants of these coun-
tries who lived in cities. A recent comparison of chronic pain among 15 countries
of the EU and Israel showed that self-reports of herniated or degenerated interver-
tebraldiscsweremorecommoninBelgium,Austria,andSwitzerlandcompared
with Norway, Sweden, Finland and Denmark [13]. Prevalence rates also differ
within countries, e.g. in the UK [106] and Germany [81]. Not surprisingly, the use
of surgery for low back pain varies widely across regions and between counties
[64]. In the United States there are reports of large regional differences in the like-
164 Section Basic Science
lihood of being offered spine surgery for a given disorder [7]. The interpretation
of geographical data regarding prevalence rates always remains tentative because
so many other differences between countries are left unconsidered. Therefore,
Deyo characterized geographical comparison as a more “hypothesis generating”
approach than “hypothesis testing” [24].
Unfortunately, important epidemiological data are not available for large areas
of the world, and as such the natural course of non-specific spinal disorders and
factors influencing their development and cost cannot be fully determined for
these regions.
Some important f uture research considerations include the collection of:
epidemiological data from different countries in a more uniform manner to
facilitate comparative research and to render results comparable [96]
more data sets in eastern Europe and the developing countries [95]
Flag System for the Risk Factors
The Flag System is very
useful for the assessment
of risk factors
Consultation with a surgeon is recommended for conditions with “red flags”.
Red flags are symptoms and findings that may indicate tumor, fracture, infection,
or cauda equinal compression. Obstacles to recovery and returntowork(the so-
called yellow and blue flags) are likely to involve more complex clinical and psy-
chosocial issues, requiring more detailed, individual assessment [14, 15, 63].
Finally, black flags indicate factors that are the same for many individuals and
relate to the social security and health care system of a country.
A distinction should be made, however, between individual perceived obsta-
cles to return-to-work (blue flags) and organizational policies regarding sick-
ness, over which the individual has no control [14, 61]. Dealing with obstacles
should include work-focused interventions and individually adapted interven-
tions to meet the needs of individual clients. Altogether, yellow, blue and black
flags should contribute to:
better screening of individuals at risk of developing a chronic problem
better interventions to increase return to work
prevention of recurrent episodes of disability
Flags are therefore included in occupational policy guidelines for the manage-
ment of non-specific spinal disorders, particularly occupational LBP.
Red Flags
Red flags are indicators of serious spinal pathology (e.g. cauda equina syn-
drome, which requires urgent surgical decompression). They represent poten-
tially significant physiological risk factors for developing chronic LBP if not
appropriately assessed. Red flags indicating neoplasm, infection, and cauda
equina syndromes are extremely rare [16].
Red flags comprise:
thoracic pain
fever and unexplained weight loss
bladder and bowel dysfunction
history of carcinoma
ill health or presence of other medical illness
progressive neurological deficit
disturbed gait, saddle anesthesia
Epidemiology and Risk Factors of Spinal Disorders Chapter 6 165