Spinal Disorders: Fundamentals of Diagnosis and Treatment Part 26 pot
Bạn đang xem bản rút gọn của tài liệu. Xem và tải ngay bản đầy đủ của tài liệu tại đây (674.47 KB, 10 trang )
Routinely Used MR Sequences for the Assessment of the Spine
Standard MR sequences
are sufficient for most
indications
Standard T1 (weighted = W) and T2 W spin-echo sequences are the basis of
imaging in the spine (
Fig. 1). T1 W and T2 W sagittal sequences, as well as axial
T2 W sequences, provide a basis for the MR imaging of all spine regions. Some
surgeons and radiologists prefer axial T1 W images, which render the dural sac
relatively hypointense and the epidural fat hyperintense. In most cases, this pro-
tocol (two sagittal sequences and one axial sequence) is sufficient to make all the
relevant diagnoses.
abc
de
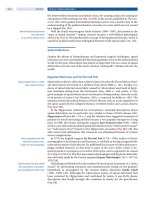
Figure 1. Normal lumbar MR anatomy
a, b Midsagittal T2 W (W=weighted) and T1 W, c parasagittal T1 W, and d axial T2 W MR images of a normal lumbar spine.
a, b In non-degenerated discs, the structure of the disc is homogeneous in T2 W images, with a bright hyperintense white
signal intensity and a normal disc height.
c Parasagittal T1 W image through the intervertebral foramen shows lumbar
nerve isointense (curved arrows point to L3, L4 and S1 nerve roots) and hyperintense perineural fat tissue.
d Axial T2 W
images at the level of the intervertebral disc L5/S1 and
e of the pedicles of S1 (white arrowheads) show nerve roots L5
(curved arrows) and S1 (straight black arrows). Caused by chemical shift artifact, the dura can be seen more clearly on the
left side while the border between the dural sac and epidural fat on the right is less distinct anteriorly. In a normal facet
joint (straight white arrows) cartilage should be seen as a bright thin line with adjacent dark thin and regular subchondral
cortical bone.
Imaging Studies Chapter 9 231
T2 Wimagesbest demonstrate:
disc degeneration [30] (
Fig. 2)
annular tears [39] (
Fig. 3)
disc herniation [22] (
Fig. 4)
intraspinal tumors (
Fig. 5)
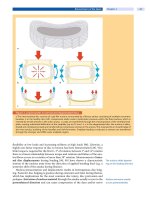
a
Grade I: Normal adolescent disc. The struc-
ture of the disc is homogeneous with a
bright hyperintense signal intensity of the
nucleus and normal disc height.
b
Grade II: Normal adult disc. The structure of
the disc is inhomogeneous, with a hyperin-
tense white signal. The distinction between
nucleus and anulus is clear, and the disc
height is normal, with or without horizontal
gray bands.
c
Grade III: The structure of the disc is inhomo-
geneous, with an intermediate gray signal
intensity. The distinction between nucleus
and anulus is unclear, and the disc height is
normal or slightly decreased.
d
Grade IV: The structure of the disc is inhomo-
geneous, with a hypointense dark gray sig-
nal intensity. The distinction between
nucleus and anulus is lost, and the disc
height is normal or moderately decreased.
e
Grade V: The structure of the disc is inhomo-
geneous, with a hypointense black signal
intensity. The distinction between nucleus
and anulus is lost, and the disc space is col-
lapsed.
Figure 2. Grading of
disc degeneration
The grading is performed
on T2 W midsagittal fast
spin-echo images accord-
ing to Pfirrmann et al. [29].
232 Section Patient Assessment
ab
Figure 3. Annular
tear
a Sagittal and b axial
T2-weighted MR images
show the high intensity
zone (annular tear) of the
L5/S1 disc (straight arrow).
Disc protrusion is shown
in the L4/5 segment
(curved arrow).
ab
cd
Figure 4. Disc
protrusion and
extrusion
a, b Disc protrusion. Sagit-
tal T2 W MR image shows
disc protrusions in the
L3/4, L4/5, and L5/S1 seg-
ments (arrows)withcon-
tact to the L4, L5, and S1
nerve roots (arrowheads).
The axial T2 W MR image
shows diffuse protrusion
of the L4/5 disc (arrows)
with contact to the L5
nerve roots (arrowheads).
c, d Disc extrusion. Sagit-
tal T2 W and axial T2 W
images in a different pa-
tient show disc extrusion
(arrows) with compression
of the L5 nerve root (arrow-
heads) between the L4/5
disc and the ligamentum
flavum.
Imaging Studies Chapter 9 233
ab
cde
Figure 5. Intraspinal tumor
a Sagittal T1 W, b T2Wandc axial T1 W, d T2 W, and e contrast enhanced T1 W fat suppressed images. There is a contrast
enhancing epidural mass (arrowheads) arising from the subperiosteal bone of the lamina of L2 with impression of the
dural sac. T1 W image shows fatty degeneration (straight black arrows) of the adjacent multifidus and longissimus mus-
cles. There is a bone marrow signal change in the joint facet with hyperintensity in T2 and contrast enhancement in T1
(curved arrow). The imaging findings are suggestive of an osteoblastoma.
T1 W sequences are important to show:
fat, e.g., within vertebral body hemangiomas or for detection of epidural fat
(
Fig. 6)
acute bleeding (
Fig. 7)
endplate changes [23] (
Fig. 8)
234 Section Patient Assessment
ab
c
Figure 6. Epidural lipomatosis
a Sagittal T1-weighted, b sagittal T2 W, and c axial T2 W images (at the L4/5 level) demonstrate an increased amount of
epidural fat (curved arrows)ashyperintensetissueinallthreesequences.Theduralsac(asterisk)isnarrowedwithdefor-
mation and flattening in the axial image.
ab
Figure 7. Acute postoperative epidural bleeding
a Sagittal T1 W and b T2 W, as well as c axial T2 W images at the L2 and d L4 levels, show postoperative epidural bleeding
after decompression surgery. In the T1 W image, the bleeding (white arrowheads) is slightly hyperintense compared to
the cerebrospinal fluid. T2 W images show different stages of bleeding with in part T2-hyperintense hyperacute bleeding
(curved arrows) and T2-hypointense acute bleeding (black arrowheads).
Imaging Studies Chapter 9 235
cd
Figure 7. (Cont.)
The dural sac (arrows) is dislocated anteriorly and compressed. c At the L2 level, the dural sac (arrows) is displaced anteri-
orly and flattened caused by hyperacute bleeding (white arrowheads).
d At the L4 level, the dural sac (arrows)iscom-
pressed and dislocated to the right because of the T2-hypointense acute bleeding (black arrowheads)
ab
cd
Figure 8. Endplate changes
Endplate changes have been classified by Modic [23] as Type I–III. a T1 W and b T2-weighted images demonstrate
Type I endplate changes (arrowheads) with high signal in T2 W and low signal in T1 W images.
c T1 W and d T2 W images
demonstrate Type II endplate changes (arrowheads) with high signal in T1 W and T2 W images which corresponds to a
higher amount of fat within these regions.
236 Section Patient Assessment
ef
Figure 8. (Cont.)
e T1 W and f T2 W images demonstrate Type III endplate changes (arrowheads)intwosegmentswithlowsignalinT1W
and T2 W images, which corresponds to bony sclerosis within these regions.
Contrast Enhanced MR Imaging of the Spine
Contrast agents shorten
T1 relaxation times
Occasionally, intravenous (i.v.) injection of MR contrast agents is necessary.
Such agents are virtually always gadolinium chelates, which predominantly
shorten T1 relaxation times. This means that there is increased signal on T1 W
sequences wherever the contrast agent is accumulated (typically within vessels,
hyperemic tissue, and joint spaces). Brand and generic names of these contrast
agents include Magnevist (gadopentetate dimeglumine, Gd-DTPA), Dotarem
(gadoterate meglumine, Gd-DOTA), Omniscan (gadodiamide, Gd-DTPA-BMA),
and Prohance (gadoteridol, Gd-HP-DO3A). Most MR contrast agents have a gad-
olinium (Gd) concentration of 0.5 mmol/ml. A higher Gd concentration
(1 mmol/ml) is occasionally used for MR angiography and brain imaging.
The use of MR contrast agents [14, 17, 24, 25, 31] is recommended in:
suspected tumors [paravertebral, vertebral, epidural, intradural-extramed-
ullary, and intramedullary tumors (
Fig. 5)]
suspected demyelination within the spinal cord
suspected infect ion [spondylitis, spondylodiscitis (
Fig. 9), or soft tissue
infection]
spontaneous intraspinal hemorrhage for demonstration of vascular malfor-
mations
inflammatory rheumatological disorders [ankylosing spondylitis, rheuma-
toid arthritis, seronegative spondyloarthritis, and SAPHO (i.e., s
ynovitis,
a
cne, pustulosis, hyperostosis, osteitis) syndrome with spondylitis]
postoperative spine
In order to increase lesion conspicuity, the contrast enhanced T1 W sequences
may be combined with fat suppression. Fat (fatty bone marrow, subcutaneous
Fat-suppressed images
are helpful because fat
may disguise the underlying
pathology
and retroperitoneal fat) and MR contrast agents are both hyperintense
(increased signal) on standard T1 W images, which may obscure abnormalities.
On fat-suppressed images, only the signal originating from the injected contrast
medium remains. Enhanced, fat-suppressed T1 W images are most useful [17,
25, 31] in suspected cases of:
spondylodiscitis
epidural abscess or soft tissue infection
neoplasm
ankylosing spondylitis or other inflammatory rheumatologic disorders
Imaging Studies Chapter 9 237
abc
de
Figure 9. Spinal infec tion
a Sagittal T1 W, b T2Wandc contrast enhanced T1 W fat suppressed images as well as d axial T1 W fat suppressed and
e T2 W images in spondylodiscitis of the thoracic spine. There is collapse of one vertebral body and of the intervertebral
disc (white curved arrow) and contrast enhancement within both vertebral bodies and within an epidural mass (arrows)
with slight deformation of the dural sac. Inflammatory changes with abscess formation (arrowheads)canbeseeninthe
paravertebral space.
Additional Sequences
Gradient-echo and fat-suppressed T2 W sequences are the two most commonly
employed additional sequences. Both types of sequences are available on all
types of scanners.
T2*W gradient-echo
sequences reduce CSF
pulsation artifacts
Axial T2*W gradient-echo sequences are commonly used in the cervical spine
instead of T2 W fast spin-echo sequences. The “*”inT2*Wisemployedbecause
the signal on these sequences is not only determined by T2 relaxation times but
also by additional factors. The main reason to use such sequences is the reduc-
tion of pulsation artifacts within cerebrospinal fluid commonly present on T2 W
images. These artifacts consist of hypointense regions which may obscure or imi-
238 Section Patient Assessment
tate abnormalities. They may for instance interfere with the diagnosis of vascular
malformations and other filling defects within the subarachnoidal space. Gradi-
Gradient-echo sequences
allow for an excellent
contrast between CSF
and spinal cord
ent-echo images tend to provide excellent contrast between the cerebrospinal
fluid on one hand and the spinal cord or discs on the other hand. With regard to
intramedullary abnormalities their contrast behavior tends to be inferior to
T2 W spin-echo images. Gradient-echo sequences additionally have disadvan-
tages such as marked susceptibility artifacts in the presence of metallic implants
and fragments [33]. There are many different types of gradient echo sequences,
depending on the manufacturer. Commonly the manufacturers try to abbreviate
the complicated names of the gradient echo techniques with acronyms such as
MEDIC, DESS, CISS, FFE, SPGR and many others.
The STIR sequence
differentiates acute
from chronic fractures
So-called fluid sensitive sequences such as T2 W fat-suppressed or short tau
inversion-recovery (STIR) sequences may be used in addition to the routine
sequences. In these sequences, fluid (in a wide sense of the word) is hyperintense.
Such fluid may be present in:
soft tissue (circumscribed: e.g., hematomas or abscesses; diffuse: e.g.,
edema)
bone marrow (edema, granulation tissue, abscess formation, tumor)
cerebrospinal fluid
All other structures including normal bone marrow, soft tissue and fat are hypo-
intense. These sequences are commonly used for screening in suspected abnor-
malities not seen on the standard sequences. Typical indications include:
primary bone tumors and metastases
acute or subacute fractures [4]
boneandsofttissueinfection
soft tissue tumors
soft tissue trauma (ligament disruption, soft tissue bleeding) [51]
Diffusion imaging
and spectroscopy
are still evolving
Diffusion imaging is based on the ability of the protons to move during applica-
tion of an MR gradient. Such motion is most pronounced in fluid (cerebrospinal
fluid, seroma). In normal cellular tissue such as the spinal cord or bone marrow
motion is restricted. Under pathologic conditions, different types of diffusion
pattern can be observed. Diffusion imaging is most commonly applied to the
brain for the assessment of ischemia. In the early phase, motion may be more
restricted than in the surrounding tissue but increases with development of
necrosis. In the spine, diffusion imaging has mainly been applied to bone, such as
the differentiation of traumatic and pathologic (mainly tumor-related) fractures
[52].
Proton (
1
H)-spectroscopy provides spectra of the many different compounds
of the examined volume including the protons contained in water and body fat.
MR spectroscopy is not yet
in routine use for the assess-
ment of spinal disorders
These two large peaks are commonly suppressed because they interfere with
measurement of the much smaller peaks associated with compounds relating to
metabolic changes found in tumors and other abnormalities. In
1
H-spectroscopy,
proton-containing compounds such as N-acetyl aspartate, creatine, and choline
can be identified [8].
1
H-spectroscopy cannot be considered to be a routine imag-
ing method. Spectroscopy is not limited to
1
Hbutmayalsobeperformedwith
other types of nuclei including phosphorus, sodium and others. Special equip-
ment is required for such types of spectroscopy.
Contraindications, Artifacts, Side Effects
The contraindications for imaging of the spine are the same as for MR imaging in
general. They mainly include electronic devices which may malfunction, may be
Imaging Studies Chapter 9 239
MR imaging is contraindi-
cated in the presence of car-
diac pacemakers and neuro-
stimulators
displaced or may increase in temperature. The list of such devices typically
includes:
cardiac pacemakers
neurostimulators
insulin pumps
inner ear implants
metallic fragments
Metallic spinal implants
are not a contraindication
for MRI
The metallic implants used in spine surgery including pedicular screws are not
contraindications for imaging from the point of view of patient safety. However,
they tend to produce so-called susceptibility artifacts (
Fig. 1 0). These artifacts
are caused by local distortion of the magnetic field by the metallic objects and
appear as hypointense regions surrounding the implant. Pure titanium implants
are less prone to susceptibility artifacts than steel alloy implants. Other parame-
ters influencing the extent of susceptibility artifacts are the size of the implant
Pure titanium implants
exhibit fewer artifacts
than stainless steel
and a number of MR parameters which may sometimes be successfully manipu-
lated (including readout direction, type of sequence, sequence design). Gener-
ally, spin-echo sequences cause fewer artifacts than gradient-echo sequences
[26].
A considerable number of patients feel uncomfortable within the MR system.
Claustrophobia is the most commonly encountered problem. One possibility is
the use of prism glasses, which allow the patient to observe the magnet opening.
In severely claustrophobic patients, sedation by intravenous (2–5 mg), oral
(7.5 mg) or intranasal administration of midazolam is necessary. Pain is another
commonly encountered problem in MR imaging. Patients with severe back pain
a b cd
Figure 10. Susceptibility artifac t and artifact reduction
a Conventional anteroposterior and b lateral radiographs of a 43-year-old female patient several years after scoliosis sur-
gery in Th9 to L3 with implant rupture (bold arrow) in the level Th9/10.
c Sagittal T2 W MR image of the lumbar spine
shows considerable susceptibility artifacts caused by the metallic implants, which obscure the spinal cord partially (thin
arrows).
d After optimization of the imaging parameters (different phase direction and special sequence design), visibil-
ity of the spinal canal (curved arrows) and spinal cord is far better than before.
240 Section Patient Assessment