Tài liệu Photoshop cs5 by Dayley part 15 doc
Bạn đang xem bản rút gọn của tài liệu. Xem và tải ngay bản đầy đủ của tài liệu tại đây (326.47 KB, 7 trang )
Chapter 4: Understanding Colors, Histograms, Levels, and Curves
107
l
Percentile: This displays the percentage of pixels with intensity levels that are at or below the
level under the mouse cursor. The percentage is calculated based on a percentage of all pixels
in the image, so the level to the farthest left is 0% and the level to the farthest right is 100%.
l
Cache Level: This displays the setting for current cache level if the Use Cache for
Histograms is selected in the Preferences dialog box.
Adjusting images with the histogram tools
Some Photoshop tools provide histogram tools to help you better see how to adjust and correct
images. Although we cover using the tools, such as the levels adjustments, in subsequent chapters,
you need to know generally how they work.
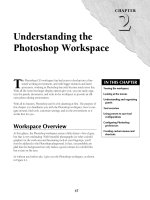
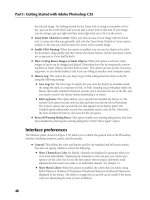
The tools that Photoshop provides all have the same basic components. As an example, look at the
Levels tool in Figure 4.9. The input levels are represented as a histogram. Below the histogram
view are three triangular control handles that allow you to easily adjust the input levels of the
channel in the image. To the right of the histogram are three eyedropper tools that allow you to
select dark, light, and midtone points in the image to quickly adjust the input levels of the chan-
nel. The following sections discuss briefly how to use these tools. We discuss the tools in more
detail in subsequent chapters as we get into correcting and adjusting images.
FIGURE 4.9
The Levels tool showing the histogram utility that Photoshop provides in several different tools
Control handles
Using the handles to adjust the histogram
The dark handle on the left controls the minimum level for the channel, the white handle on the
right controls the maximum level for the channel, and the middle gray handle controls the balance
of middle tones between the high and low levels.
08_584743-ch04.indd 10708_584743-ch04.indd 107 5/3/10 10:18 AM5/3/10 10:18 AM
Part I: Getting Started with Adobe Photoshop CS5
108
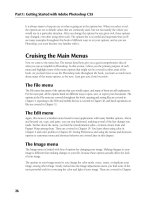
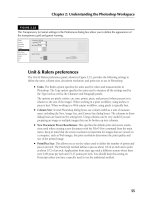
So what do the histogram controls really do? To help clarify, notice that most of the level values in
the histogram shown in Figure 4.10 are located in the center levels. That means a relatively small
number of tones are represented in the image, about 75 out of 255. The result typically is a
washed-out image with very little detail.
Now move the left control over to the right until it is on the left side of the histogram mountain,
and move the control on the right to the left until it is on the right side of the histogram mountain,
as shown in Figure 4.10.
On the Web Site
A file with a histogram similar to the one in the image shown in Figure 4.10 can be found on this book’s Web
site as Figure 4-10.tif. You can open it in Photoshop. Try adjusting the levels and see how changing the histo-
gram works and the results in the image. n
Notice the values of the Histogram panel are distributed more evenly between 0 and 255. This
means a greater range of tones is represented in the image because it includes values ranging
between 0 and 255 instead of just a range between about 100 and 175. The tonal range of the
entire image has been extended, providing much more detail with the simple adjustment of the
two sliders.
FIGURE 4.10
Adjusting the minimum and maximum levels on the Levels tool to match more closely with the actual data
in the image
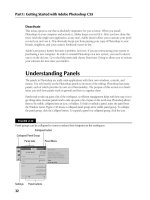
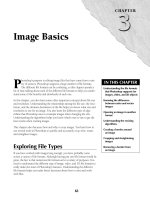
The middle slider simply adjusts the balance of the midtone levels in the histogram. When the his-
togram is weighted heavily to one side or the other, the middle adjustment handle can be moved
toward that side to balance midtones represented in the image.
For example, the Levels tool shown in Figure 4.11 is weighted heavily to the left, which means that
all the data for the image is in the darker end of the levels. Move the midtone handle to the left
toward the middle of the histogram mountain. Notice that the histogram mountain moves to the
right to balance on the new location of the midtone slider.
08_584743-ch04.indd 10808_584743-ch04.indd 108 5/3/10 10:18 AM5/3/10 10:18 AM
Chapter 4: Understanding Colors, Histograms, Levels, and Curves
109
On the Web Site
A file with a histogram similar to the one in the image shown in Figure 4.11 can be found on this book’s Web
site as Figure 4-11.tif. You can open it in Photoshop. Try adjusting the levels and see how changing the histo-
gram works and the results in the image. n
FIGURE 4.11
Adjusting the midtone levels on the Levels tool to change the midtone levels balance in an image
Using the eyedroppers to adjust the histogram
The Eyedropper tools allow you to adjust the levels of a channel by selecting three points in the
image. The eyedropper on the left sets the minimum level for the channel, the eyedropper handle
on the right sets the maximum level for the channel, and the middle eyedropper controls the bal-
ance of middle tones for the channel between the high and low levels.
The eyedroppers work similarly to the control handles except that instead of selecting a specific level
for the dark, light, and midtones, you can select pixels directly in the image. To use the eyedroppers,
simply click the left Eyedropper tool and select a pixel that should appear black in the image. Then
click the right Eyedropper tool, and select a pixel that should appear white in the image. Finally click
the middle Eyedropper tool, and select a pixel that should match the midtone for the color channel
selected. In the case of all channels, select a pixel that should appear gray in the image.
Tip
The eyedroppers are fast and extremely accurate if there are items in the image that should appear black,
white, and gray in the image. If you are not certain of the colors of the pixels, use the control handles instead
of the eyedroppers. n
Adjusting levels with the Curves tool
Another tool that Photoshop provides to help you better see how to adjust and correct images is
the Curves tool, available by selecting Image ➪ Adjustments ➪ Curves from the main menu in
Photoshop. The Curves tool is one of the most difficult tools to quickly grasp, so it has become one
of the most avoided tools in Photoshop. However, after you learn how to use it, a whole new world
of color correction opens up.
08_584743-ch04.indd 10908_584743-ch04.indd 109 5/3/10 10:18 AM5/3/10 10:18 AM
Part I: Getting Started with Adobe Photoshop CS5
110
While the Histogram tool allows you to change the light, dark, and midtone values for the histo-
gram, the Curves tool allows you to apply a complex curve equation to the histogram, giving you
unlimited control of the range of levels in the image. Using the Curves tool, you can control com-
pletely the tonal properties of an image.
In this section, we discuss what the curve is and how to use the Curves tool to adjust the levels in
the image. Using the different Curves tools in Photoshop for specific purposes is covered in later
chapters of this book.
Understanding curves
To understand how the Curves tool works, you need to understand the curve itself. The curve
starts as a diagonal line with the value of 0 on the left and 255 on the right, as shown in Figure
4.12. This means that the pixels currently with an intensity level of 0 for that channel have a value
of 0 in the histogram, the pixels at level 1 have a value of 1, and so on up to 255.
Note
The grid lines in the curve window allow you to more easily tell what the values are for points on the line. The
bottom/left line has a value of 0, the middle line has a value of 127, and the top/right line has a value of 255.
The middle left/bottom line has a value of 64, and the middle right/top line has a value of 192. n
FIGURE 4.12
A simple linear curve in Photoshop
The Curve tool works by applying new level values in the histogram for each of the current levels.
Think of the Selection tool just as you would a graph with the existing level values specified along
the bottom axis from 0 to 255. The new values are equal to the value of the point on the line corre-
sponding to each of the old levels.
08_584743-ch04.indd 11008_584743-ch04.indd 110 5/3/10 10:18 AM5/3/10 10:18 AM
Chapter 4: Understanding Colors, Histograms, Levels, and Curves
111
To help you understand the curve better, look at the following example. Figure 4.13 shows a mod-
ified curve. Notice that the points on the left (0), right (255), and the middle (127) all are on the
original line, which means that pixels with those level values will not change. However, the curve
goes above the original line before level 127 so those pixels for each of those levels increase to
match the value of the line.
Using only two points may be a bit of a problem with the tonal correction. Notice that the levels
close to 0, 127, and 255 do not change as much as the levels around 64 and 192. To overcome
this problem, Photoshop allows you to apply additional points to the line to adjust the curve in
several ways.
FIGURE 4.13
A curve that maps pixels with levels between 0 and 127 to higher levels and pixels with values between
127 and 255 to lower values
Points
Using the Curves tool
Now that you understand how the curve works, we discuss the features of the Curve tool that
enable you to create dynamic curves that can really have an impact on the tones of your images.
These tools can be found whether you are adjusting images using the Curves tool, with an adjust-
ment layer, or in Camera Raw.
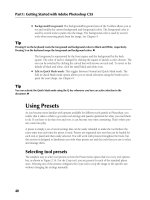
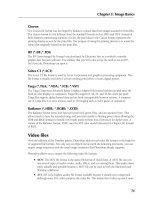
Selecting the channel
The first thing you want to do is to select that channel you want to adjust. The Channel drop-
down menu, shown in Figure 4.14, allows you to select any channel or all the channels.
08_584743-ch04.indd 11108_584743-ch04.indd 111 5/3/10 10:18 AM5/3/10 10:18 AM
Part I: Getting Started with Adobe Photoshop CS5
112
FIGURE 4.14
The Curves tool in Photoshop
Control handles
Point Curve button
Freehand Curve button
Click and Drag button
Adding points
Points can be added to the curve by clicking the points curve button and then clicking the curve in
the curve window. When the points curve button is selected, you can use the mouse to add points by
clicking on the curve. You can add up to 14 points to the curve, making a total of 16 points including
the ends, because the end points also are adjustable. Points can be removed from the line by dragging
them with the mouse to the bottom-left corner or to the top-right corner of the curve window.
Tip
The more points you add to the line, the finer your adjustments to the tonal correction are. However, adding
more points makes it more difficult to make adjustments because you may need to adjust all points when you
adjust one. Make the bigger adjustments first, and then add more points as needed to speed things up. n
Adjusting the input levels
You can adjust the input levels using the control handles along the bottom axis of the levels win-
dows. This is the same thing as adjusting the minimum dark and maximum light levels in the his-
togram. This limits the curved lined to operate between those ranges. To adjust the input levels,
simply grab one of the control handles with the mouse and drag it to the appropriate value.
08_584743-ch04.indd 11208_584743-ch04.indd 112 5/3/10 10:18 AM5/3/10 10:18 AM
Chapter 4: Understanding Colors, Histograms, Levels, and Curves
113
Tip
You should adjust the input levels before you create your curve because adjusting the input levels afterward
results in changes to the curve. n
Adjusting specific levels from the image
A useful feature of the Curves tool is the ability to select a level directly from the image. This allows
you to simply select a particular area of the image based on what colors/tones you see.
To adjust the levels from the image, click the click-and-drag button in the Curves tool (refer to
Figure 4.14). Then use the mouse to select a pixel in the image containing the tone you want to
adjust. A new point is created on the curve. While holding down the mouse button, you can move
the mouse up and down to adjust the level of that point.
Creating a freehand line
If 16 points on the curve line is not enough, you can create your own line by clicking on the
Freehand Curve button (refer to Figure 4.14). The Freehand Curve button allows you to draw a
freehand line directly on the curve window instead of using points to create the curve.
The freehand curve can be used by itself to create the curve. You can use the Freehand Curve tool
to make slight, nonsmooth adjustments to the curve after you have created it with points. Only the
areas of the curve that you draw with the Freehand tool are corrected.
Tip
You can convert a freehand line into a points curve by clicking the points curve button. This is helpful if you
need to make some additional adjustments to the points curve after you change it using the Freehand tool. n
Using the eyedroppers
The eyedroppers work the same way for the Curves tool as discussed earlier in the Histogram tools
section. Adjusting the image first with the eyedroppers sometimes gives you a better base to start
from when making the tonal corrections with the curve.
Working in Different Color Modes
Photoshop provides several color modes that help when working with images. Ultimately, as we
discussed earlier in this chapter, color is just different intensities of light at different frequencies.
However, that data needs to be translated into a quantifiable form that can be understood by
Photoshop, the monitor, printers, and ultimately you.
This section gives you an overview of the different color modes available for use in Photoshop and
why to use them. It also helps you understand the bits/channel settings for the image modes.
08_584743-ch04.indd 11308_584743-ch04.indd 113 5/3/10 10:19 AM5/3/10 10:19 AM