THE FRACTAL STRUCTURE OF DATA REFERENCE- P25 potx
Bạn đang xem bản rút gọn của tài liệu. Xem và tải ngay bản đầy đủ của tài liệu tại đây (87.98 KB, 5 trang )
110
THE FRACTAL STRUCTURE OF DATA REFERENCE
2. A CASE STUDY
This section improves upon the analysis just presented, by taking into ac
-
count a more complete picture of both costs and recall delays at a specific
installation. The case study presented below was performed by capturing the
SMF records related to storage management, so as to simulate alternative storage
management policies against the captured data.
The installation of the case study was a moderate
-
sized OS/390 installation
with a mix of on
-
line CICS, IMS, and DB2 data base activity, plus a small amount
of
TSO storage. Essentially all user and database storage was SMS
-
managed,
and was contained in a management class called
STANDARD. At the time of the
study, policies in the
STANDARD pool called for migration off of level 0 storage
after 15 days, and migration off of level 1 storage after an additional 9 days.
The
SMF data used in the study covered a period of 33 days. One immediate
purpose of reassessing the hierarchical storage management policies at this
installation was to examine a planned installation of tape robotics.
The case study involved the following steps:
1. Capture the daily
SMF 14, 15, 17, 64, 65, and other miscellaneous record
types associated with storage management.
2. Extract the key
SMF data, and accumulate at least 30 day’s worth.
3. For each combination of level 0 and level 1 migration ages up to a level 1
migration age of 30 days, simulate the resulting migrations, recalls, storage
requirements, and costs.
4. Input the simulation results into a software package capable of contour
5. Use graphical techniques (as described below) to perform a constrained
optimization based on the costs and recall rates associated with each com
-
bination of level 0 and level 1 migration ages.
Steps 1
-
3 were performed using the SMS Optimizer software package [42].
The cost computation as performed in Step 3 included the storage costs just
described in the previous section, as well as several additional costs such as the
cost of tape mounts and the
CPU cost to perform compression. The remaining
steps were performed using the
SAS software package [43], which tends to be
widely available in
OS/390 environments.
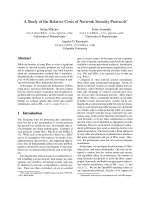
The constrained optimization of Step 5 was performed by taking advantage
of the SAS contour plot capability. Figure 8.1 presents the contour plot that was
used for this purpose.
More precisely, the figure shows an overlay of two contour plots: one exhibits
lines of equal cost, the other exhibits a line of fixed performance. In either
case, the key
SAS statement needed looks like the following example:
plotting.
Hierarchical Storage Management
111
PROC GCONTOUR DATA=SIMDATA GOUT=SAVGRAPH :
PLOT L0AGE*L1AGE=RELCOST / LEVELS=0.93 0.95 0.97;
To produce Figure 8.1, this exact statement (plus embellishments for the axis
labels, legend and other niceties) was used to obtain the three lines of the figure
that correspond to management policies with a total simulated cost of 93, 95,
or 97 percent of current costs. A second
PROC GCONTOUR statement, similar
to the example, was used to obtain the line that corresponds to management
policies with an average recall delay per
I/O equal to the current average delay.
The two plots were then overlaid on top of each other.
Let us now examine Figure 8.1. As already discussed, the figure explores
the entire range of level 0 and level 1 migration ages up to a level 1 migration
age of 30 days. The current migration policy (1 5 days on level 0, plus 9 more
days on level 1) is marked with a crosshair (“ ”) The line going through this
symbol shows all of the migration policies that have the same average delay
due to recalls as that of the current policy.
Consider, now, the policies that lie along the line of current performance.
This line crosses two others: those that reflect costs equal to 97 and 95 percent
of the current costs. This means that by modifying the migration policies to
match those at the two points of intersection, costs can be reduced by 3 or 5
percent respectively while maintaining the same average delay due to recalls.
Figure 8.1.
Contour plot ofthe simulation results.
112 THE FRACTAL STRUCTURE OF DATA REFERENCE
In addition, the fact that the line of current performance crosses the 95
percent line means that we can reduce costs still further. This can be done by
following the current
-
delay line in the direction of lower costs. The minimum
cost is achieved when the line of current performance just grazes a line of
constant cost, without actually crossing it. As Figure 8.1 shows, this happens
when the level 0 and level 1 migration ages are 5 and 27 days respectively, and
when the cost is approximately 94 percent of its current value.
Again using the results of the simulation, the optimum storage management
policies as just determined from Figure 8.1 can be translated back into storage
requirements. In terms of the variables introduced in the previous section, the
recommended amounts of storage are:
s
00
= 14.2
s
0
= 30.6
s
1
= 70.8
These results refine and improve upon, while staying in essential agreement
with, the corresponding back
-
of
-
the
-
envelope calculations presented in the
previous section. Differences between the two sets of results are due to the
much more complete handling of both costs and recall activity that is possible
via simulation.
It is interesting to recall that, everything else being equal, the response
indicated by (8.3) to the adoption of tape robotics would be to increase the
use of primary relative to secondary disk storage. The recommendation just
obtained above, however, was to decrease both the level 0 migration age and,
hence, the use of primary storage. The recommendation to decrease primary
storage, and to increase level 1 storage, is due to the starting point (existing
policies) at the study installation.
The analysis just presented shows that, considering the long delays for recalls
from level 2, the existing policies place too much emphasis on avoiding the
much faster recalls from level 1. The introduction of tape robotics can reduce
the length of level 2 recall delays; but nevertheless, our analysis shows that their
frequency should be reduced as well. This is done by increasing level 1 storage
at the expense of level 0. Since level 1 storage offers compression, an increase
in level 1 storage improves the efficiency with which the existing performance
objectives can be met, and allows a reduction in total storage costs.
Chapter 9
DISK APPLICATIONS: A STATISTICAL VIEW
As disk storage has evolved over the past several decades, a curious tension
has developed between two key players in the capacity planning game. On one
side of the dialog are those wishing to deploy a range of database applications
that they see as being important to business growth or profitability. When
examining plans for database deployment, the storage cost, as measured in
dollars per unit of storage, appears to be the most important measure of any
given disk techno logy.
On the other hand, those responsible for planning and managing the systems
that must process transactions, running on the database, endeavor to point out
the importance of disk performance.
This side of the dialog often focuses
on access density — the ratio of performance capability, in I/O’s per second,
relative to storage capacity in gigabytes. If some application requires a higher
access density than a given disk technology can deliver, then for that application
and type of disk, it is necessary to plan for less use of storage, and a higher
effective cost, than those that appear “on paper”.
The push and pull between the two key metrics just outlined — storage
cost and access density — continues to recur as new generations of storage
technology are introduced. Often, the debate focuses on the optimum storage
capacity within a given family of physical disks. Those whose choice is driven
by storage cost will consistently select the maximum feasible capacity; those
whose choice is driven by access density will typically select the smallest
available capacity.
This chapter tries to add to the dialog by providing a quantitative framework
within which disk capacity, performance, and cost can all be considered. We
also apply the proposed framework to answer two important questions:
114
1. Does a predictable relationship exist between storage cost and access den
-
2. As advances in technology make possible disks with ever larger capacities
and lower storage costs, what performance improvements are needed so that
disk capacity, performance, and cost all remain in balance?
These questions are answered by introducing a simple but powerful model
of storage applications. In this model, a wide range of potential applications
are assumed to be possible, but only some of these are cost
-
effective to deploy
at any given time. The performance requirements against a given storage
technology thus become a function of the applications that are cost
-
effective
on that technology.
In effect, the resulting deployable applications model of storage use extends
the scope of our previous models to a level of the memory hierarchy deeper
than the physical storage present at an installation at any given time. This hypo
-
thetical level contains those applications that might, in the near future, require
storage, whether or not such applications have actually been implemented.
The parameters of the deployable applications model can be calibrated based
upon historical trends. In this way, the model becomes a window on the recent
history of disk storage, through which to better understand past events, as well
as predict events in the future. Our answers to the two key questions framed
above reflect what has occurred over the past several decades:
1. If storage costs fall, then application access densities, on average, should
also be expected to fall, but at a slower rate. For example, a factor
-
of
-
two
drop in storage costs should be expected to cause a drop in application
access densities by approximately a factor of 1.6.
THE FRACTAL STRUCTURE OF DATA REFERENCE
sity?
2. If disk capacity increases and disk storage cost decreases correspondingly,
then disk performance should also improve to remain “in balance”. For
example, suppose that disk capacity increases by a factor of two, while
storage cost falls by the same factor. Then we conclude that the performance
of the new disk, as measured by its average service time per
I/O, should
improve by approximately 15 to 25 percent.
The deployable applications model may seem oversimplified to many read
-
ers. The model treats entire applications, which in a traditional capacity plan
-
ning process must be tracked and forecast individually, on a statistical basis.
Many capacity planners have found a need, however, to simplify the traditional
process of capacity planning due to the increasingly large storage require
-
ments involved and the relatively small amount of time and effort that can be
budgeted for the planning process. The simplified, broad
-
brush nature of the
deployable applications model may appeal to those practitioners who need a
“back
-
of
-
the
-
envelope” alternative to traditional capacity planning.