Encyclopedia of Global Resources part 13 pdf
Bạn đang xem bản rút gọn của tài liệu. Xem và tải ngay bản đầy đủ của tài liệu tại đây (294.58 KB, 10 trang )
omy, generating up to $5 billion Australian(about $4
billion U.S.) in gross value each year and employing
around 370,000 people across Australia. Farms in Aus-
tralia have traditionally been family businesses, passed
on from generation to generation. However, begin-
ning in the 1950’s, international economic factors
and changes in farming methods led to larger farms
being more economically viable than small ones. The
number of farming families in Australia has steadily
decreasedand the average size of farms has increased.
Different typesoffarming are concentrated mainly
in the areas that suit them best, depending on water
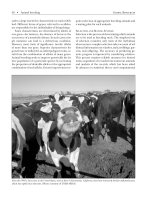
availability and climatic conditions. The grazing of
livestock (mainly sheep and cattle) takes up the most
land in Australian agriculture. Sheep are found pri-
marily in New South Wales, Western Australia, and
Victoria. About 90 percent of all cattle are used for
beef. Queensland and New South Wales are Austra-
lia’s main beef cattle producers, with the Northern
Territory contributing about 10 percent of the beef
cattle market.Dairying occurs mainly in the southern
states, predominantly in Victoria.
Crop growing contributes to more than 50 percent
of thevalue ofAustralian agriculture every year.Wheat
and other grain crops are spread fairly evenly across
New South Wales, South Australia, Victoria, Western
Australia, and Queensland, and sugarcane is a major
cropin Queensland and New South Wales.Fruitgrow-
ing and vegetable growing occur in all states.
Other Resources
Australia is also extremely rich in zinc reserves, the
principal sources for which are Mount Isa and Mount
Morgan in Queensland. The Northern Territory also
has lead and zinc mines and vast reserves of bauxite
(aluminium ore), near Weipa on the Gulf of Car-
penteria and at Gove in Arnhem Land.
W. J. Maunder
Further Reading
Browne, G. S. Australia, a General Account: History, Re-
sources, Production, Social Conditions. Whitefish,
Mont.: Kessinger, 2007.
Halliday, James. JamesHalliday’s Wine Atlasof Australia.
Prahran, Vic.: Hardie Grant Books, 2009.
Horne, Donald. The Lucky Country: Australia in the
Sixties. 2d rev. ed. Sydney: Angus & Robertson,
1978.
Malcolm, Bill, et al. Agriculture in Australia: An Intro
-
duction. New York: Oxford University Press, 2009.
Turner, Lynne, et al. Where River Meets Sea: Exploring
Australia’s Estuaries. Canberra, A.C.T.: CSIRO,
2006.
See also: Agricultural products; Agriculture indus-
try; Coal; Copper; Tungsten; Uranium.
Austria
Categories: Countries; government and resources
While Austria is known for its cultural heritage in
terms of classical music, it is also one of the most eco-
nomically rich countries in Europe and the world. Aus-
tria has limited natural resources in terms of fossil fu-
els, metals, ores, and other rawmaterials, and many of
the resources used for production and consumption
have to beimported. However, Austria is richin renew-
able resources such as timber and hydropower. Austria
is also home to the largest Alpine national park, with
many natural habitats and species.
The Country
Austria is a small, land-locked country in central Eu-
rope, covering the eastern half of the Alps. The coun-
try’s gross domestic product (GDP) is about 270 bil-
lion euros (about $385 billion), with a per-capita
income that averages 32,570 euros (about $46,000).
Austrian per-capita income therefore ranks among
those of the ten richest countries in the world. The
Austrian population is concentrated mostly in the
eastern lowlands of the country and in some inner-
Alpine valleys and basins, with the eastern Alps cover-
ing more thantwo-thirds of the country’s area. Of the
nation’s total area, 47 percent is covered by forests, ar-
able land amounts to about 17 percent, and high al-
pine mountains and rocks cover more than 10 per-
cent. About 38 percent of the land is permanent
settlement area.
Land Use
Forests are the most important land cover in Austria,
occupying 47 percent. Forest growth has been on the
rise, because marginal soils have been covered again
by trees, while in densely populated areas forests have
been increasingly pushed back. Dense agriculture can
be found in about one-third of the land area. Of Aus
-
tria’stotal area, about 3 percent(2,300 square kilome
-
90 • Austria Global Resources
Global Resources Austria • 91
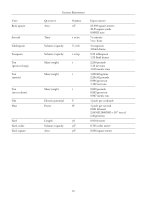
Austria: Resources at a Glance
Official name: Republic of Austria
Government: Federal republic
Capital city: Vienna
Area: 31,999 mi
2
; 82,871 km
2
Population (2009 est.): 8,210,281
Language: German
Monetary unit: euro (EUR)
Economic summary:
GDP composition by sector (2008 est.): agriculture, 1.9%; industry, 30.7%; services, 67.4%
Natural resources: oil, coal, lignite, timber, iron ore, copper, zinc, antimony, magnesite, tungsten, graphite, salt,
hydropower
Land use (2005): arable land, 16.59%; permanent crops, 0.85%; other, 82.56%
Industries: construction, machinery, vehicles and parts, food, metals, chemicals, lumber and wood processing,
paper and paperboard, communications equipment, tourism
Agricultural products: grains, potatoes, sugar beets, wine, fruit, dairy products, cattle, pigs, poultry, lumber
Exports (2008 est.): $163.6 billion
Commodities exported: machinery and equipment, motor vehicles and parts, paper and paperboard, metal goods,
chemicals, iron and steel, textiles, foodstuffs
Imports (2008 est.): $168.9 billion
Commodities imported: machinery and equipment, motor vehicles, chemicals, metal goods, oil and oil products,
foodstuffs
Labor force (2008 est.): 3.633 million
Labor force by occupation (2005 est.): agriculture, 5.5%; industry, 27.5%; services, 67%
Energy resources:
Electricity production (2007 est.): 59.31 billion kWh
Electricity consumption (2006 est.): 62.35 billion kWh
Electricity exports (2007 est.): 18.47 billion kWh
Electricity imports (2007 est.): 28.5 billion kWh
Natural gas production (2007 est.): 1.848 billion m
3
Natural gas consumption (2007 est.): 8.436 billion m
3
Natural gas exports (2007 est.): 2.767 billion m
3
Natural gas imports (2007 est.): 9.658 billion m
3
Natural gas proved reserves ( Jan. 2008 est.): 16.14 billion m
3
Oil production (2007 est.): 24,920 bbl/day
Oil imports (2005): 313,500 bbl/day
Oil proved reserves ( Jan. 2008 est.): 50 million bbl
Source: Data from The World Factbook 2009. Washington, D.C.: Central Intelligence Agency, 2009.
Notes: Data are the most recent tracked by the CIA. Values are given in U.S. dollars. Abbreviations: bbl/day = barrels per day;
GDP = gross domestic product; km
2
= square kilometers; kWh = kilowatt-hours; m
3
= cubic meters; mi
2
= square miles.
Vienna
Austria
Italy
Germany
Hungary
Czech
Republic
Slovakia
Liechtenstein
Slovenia
Switzerland
ters) is sealed for buildings, of which 70 percent are
for residential and 30 percent for commercial pur-
poses. In total, 4,400 square kilometers are sealed for
construction and transportation purposes.
Additionally, 12 to 15 hectares per day are cur-
rently sealed for residential and transportation pur-
poses, totaling more than 50 square kilometers per
year. New industrial zones, residential areas, and trans-
port infrastructure in particular (roads) are the main
causes for sealing theland.Therehas been an increas-
ing conflict between newly developed areas and areas
valuable for nature conservation (habitats for fauna
and flora).
The Austrian Sustainability Strategy presented by
the Austrian government in 2002 aimed at reducing
the “consumption” of areas to 1 hectare per day. The
main reasons for area consumption are expansion of
construction and transportation due to changing life-
styles, income growth, large shopping malls and com-
mercial areas at the outskirts of the cities, and lack of
consistent zoning and spatialplanning.Togetherwith
other area-consuming or -using activities—such as ag-
riculture, forestry, and sports (golf and skiing)—only
small patches of Austrian mountains and forests have
remained undeveloped. With the sealing of large
areas, the ecological functions of soil are reduced.
While the quality of Austrian soils is generally good,
there is some environmental pressure in terms of pol-
lution and erosion.
Materials Extraction and Consumption
While domestic extraction is significant in the sector
of nonmetallic minerals such as sand, gravel, and
other construction materials—about 83 million met-
ric tons annually—imports are low, at about 9.6 per-
cent, because of the high transport costs relative to
the price of the product. Domestic production of fos-
sil fuels is also low compared to total consumption.
Therefore, Austria has to import much of its fossil
fuel. About 2.7 million metric tons are extracted do-
mestically, while imports amount to more than 36mil-
lion metric tons.
Austria’s materials consumption increased in the
first decade of the twenty-first century. In terms of the
direct material input (DMI), the Austrian economy
used 200 million metric tons of materials in 2006.
Measured by the domestic materials consumption
(DMC), Austria consumes 158 million metric tons
of materials. Minerals and construction materials
amount to about 83 million metric tons, while fossil
fuels account for around 41 million metric tons.
Around 36 million metric tons of biomass are con-
sumed by the Austrian economy. These figures corre-
spond to an annual per-capita consumption of materi-
als of roughly 19 million metric tons, representing a
significant increase from 14.5 million metric tons in
1970. While most of the construction materials and
biomass are extracted domestically at a mostly con-
stant level, the major share of fossil fuels is imported.
Relative to GDP, around 1 kilogram of materials is
consumed per euro of GDP, meaning resource pro-
ductivity in terms of GDP per kilogram of material
inputs is also about1euro per kilogram. While theuse
of biomass stays about constant, the growth of ma-
terials consumption can be attributed to the large
increase in the use of fossil fuels andconstruction ma-
terials. Beginning in 1970, Austrian materials con-
sumption rose annually by 1.5 to 2.1 percent. While
the DMC increased to a smaller extent, the growth in
material inputs (DMI) was mainly the result of im-
porting materials for producing export goods, espe-
cially in the metal-producing sectors. The growth of
materials consumption is mainly determined by in-
creases in income (GDP). For most material groups,
especially fossil fuels and construction materials, in-
come growth in general and the growth of the produc-
tion of energy- and material-intensive export sectors
are the main driving forces. After the oil price shock
in the mid-1970’s, material intensity decreased by
roughly 20 percent but stayed rather constant begin-
ning in the mid-1990’s. Policies focusing on reducing
material inputs and consumption are included in
the Austrian Sustainability Strategy aiming at stabiliz-
ing materials consumption in the short run and in-
creasing resource productivity by a factor of 4 in the
long run.
Biodiversity
Biodiversity as defined by theUnitedNationsConven-
tion on Biological Diversity comprises diversity within
and between species and ecosystems (habitats, land-
scapes). In Austria,species (fauna andflora) as wellas
habitats are protected by provincial, national, and in-
ternational (especially European Union) law. On a
national scale, 33 percent of plant species are threat-
ened, while an additional 21 percent are locally en-
dangered. Of particular concern are lichen species;
more than 60 percent are threatened. About 10 per
-
cent of vertebrate species are threatened. Only about
one-third of mammals, birds, and fish are listed on
92 • Austria Global Resources
the International Union for Conservation of Nature
(IUCN) Red List of Threatened Species, category
“least concern.” More than 60 percent of reptile spe-
cies are threatened. Species loss is mainly because of
habitat loss, devaluation, and fragmentation. For in-
stance, 83 percent of wetlands and 57 percent of for-
est ecosystems are endangered.
Protected areas are established on an area of
31,019 square kilometers, corresponding to 37 per-
cent of the Austrian territory. This area includes 6 na-
tional parks (according to the IUCN’s categoryIIdefi-
nition), 403 nature conservation areas, 248 protected
landscapes, and 111 European conservation zones.
More than 200 of these protected areas are also part of
the European Union’s network of protected areas.
Austria supported the European Union’s goal of re-
ducing biodiversity loss by 2010.
Timber
About 47 percent of Austrian territory is covered
with forests (39,600 square kilometers out of 83,872
square kilometers). Therefore, timber is a significant
natural resource in Austria. However, because of the
mountainous regions of the eastern Alps and the
partially cold climate, not all forests can be economi-
cally managed for timber production. Timber pro-
duction is generally an important use of forests.
Equally important is erosion control and protection
of settlements from landslides and avalanches on the
steep slopes of the Alps. Furthermore, forests pro-
vide important functions in terms of water purifica-
tion and storage,micro- and meso-climateregulation,
and recreation. The Austrian Forest Program pre-
sented by the Austrian government in 2006 aims at
achieving a sustainable and multifunctional use of
forests.
Only 3 percent of Austrian forests are categorized
as “pristine,” while another 22 percent are described
as “natural.” Forty-four percent are “moderately mod-
ified,” while another 22 percent are classified as
“heavily modified.” Forests are generally important
for conserving biodiversity. Less that1 percent ofAus-
Global Resources Austria • 93
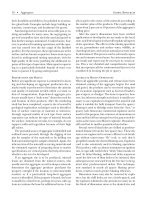
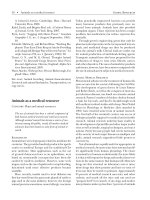
Forest workers load timber onto a railroad car in this 1910 photograph. Timber is one of Austria’s primary resources. (Getty Images)
trian forests are categorized as “minimum interven
-
tion,” while another 2.7 percent are managed under
some regime for biodiversity conservation. Twenty-
three percent of Austrian forests are part of protected
areas.
According to the Austrian Forest Inventory, about
one-half of the annual increase in biomass is har-
vested. Out of 9.3 cubic meters of biomass increase
per hectare, 5.6cubicmeters are in use.Inthe first de-
cade of the twenty-first century, forest areas grew by
roughly 1 percent with an increasing trend. In 2007,
21.3 million cubic meters of timber were harvested
in Austrian forests, corresponding to an increase of
11.4 percent over the previous year. Value added in
the forestry sector amounted to about 1.5 billion eu-
ros (about $2.1 billion); the total annual production
value wasestimated to be2.7 billion euros (about $3.8
billion) per year. The actual quantity of timber har-
vested is lower than the potential sustainable yield of
about 24.8 million cubic meters per year. About one-
third of timber is used as biofuels, the rest for com-
mercial purposes such as furniture. Compared to the
production of all European Union countries of 426
million cubic meters, Austria’s share in Europe’s tim-
ber production islarger than the country’s size (area)
might suggest. Austria produces about 3 cubic meters
of timber per capita and therefore ranks fifthofallEu-
ropean countries. Only Sweden, Finland, Latvia, and
Estonia produce more timber per capita. This also
leads to an above-average paper and paperboard pro-
duction, estimated at 0.54 metric ton per capita. Only
in Finland and Sweden is per-capita production of pa-
per higher than in Austria.
Climate changeis one ofthe threats to functioning
forest ecosystems. Beginning in the early 1990’s, natu-
ral events such as hurricanes increased in frequency
and intensity. Timber stocks in Austrianforests amount
to about 1,094 billion cubic meters. In 2007, Hurri-
cane Kyrill affected 3.3 million cubic meters of tim-
ber, which had to be extracted from the forests. This
natural disaster led to a significant price decline of
forest products, especially for low-quality timber. On
the other hand, periods of drought suchasinthesum-
mer of 2003 additionally weakened the resilience of
forest ecosystems. Furthermore, the bark beetle has
negatively affected large patches of forests.
Austrian forests are also considered important in
terms of climate change policies. Austrian forests
serve as a carbon sink because of the increase in tim
-
ber stocks. Austrian forests are a major supplier of
biofuels and therefore contribute to reducing green
-
house gases.
Water Resources and Use
Austria is a country rich in water resources. As the
Alps form a barrier for clouds, annual precipitation
amounts toabout 1,100 millimetersper square meter.
Tributaries from abroad account for an additional in-
flux of320 millimetersper square meter. Evaporation
leads to a reduction in water resources of 500millime-
ters per square meter,andtheoutflowofsurfacewater
and groundwater amounts to 920 millimeters per
square meter. The annual average of renewable water
resources totals 84 billion cubic meters, with a total
water consumption by the Austrian economy of 2.6
billion cubic meters. That means that around 3 per-
cent of renewable water resources are used, mainly
in the agricultural and industrial sectors. From a
quantitative viewpoint, water use and diversion are
most prominent in hydropower stations, as around
60 percent of Austrian rivers are significantly im-
pacted. Austrian households receive about one-half
of their drinking water from springs, while the other
half comes from groundwater. Ninety percent of Aus-
trian households are connected to the public sewage
system.
More than 93 percent of groundwater bodies are
in a good chemical state. The majority of surface wa-
ters have good or very good water quality. Water qual-
ity is reduced to moderate quality only in single “hot
spots” such as downstream of large cities. The main
threats to waterresources in Austriaarenonpoint pol-
lution sources from the agricultural sector and the
modification of surface waters for hydropower plants
and ship transport on the main river of Austria, the
Danube.
While agricultural, commercial, and residential
consumption of water isimportant, probably the most
important use of water resources, in quantitative terms,
is in electricity production. About 65 percent of Aus-
trian electricity is produced in hydropower plants
along the large Austrian rivers such as the Danube.
This also leadstoa comparatively high share ofrenew-
able energy sources, which account for about 24 per-
cent of total energy consumption. Some of this elec-
tricity is also traded on European energy markets.
The good state of water resources in Austria is the
result of the strict regulatory framework of the Aus
-
trian Clean Water Act, which prescribes the “state of
the art in pollution control technology” for all water
94 • Austria Global Resources
uses and wastewater discharges, and to the extensive
use of environmental subsidiesfor municipalitiesand
water-polluting industries. More over, the European
Union’s Water Framework Directive (WFD) has been
implemented in Austria, aiming at a good ecological
state of all water resources andat the incorporationof
all environmental and resource costs and benefits in
the pricing of water services.
Other Resources
About 40 percent of Austrianterritory isused for agri-
culture. The share of domestic food production com-
pared to total food consumption in Austria is 95 per-
cent for cereals, 93 percent for sugar, 88 percent for
potatoes, 66 percent for fruits, and31 percent forveg-
etable oil. The production value of the agricultural
sector amounts to about 8.1 billion euros (11.5 $bil-
lion) with a share of total production value of about
1.8 percent.
One resource thatis plentiful inAustria is tungsten
(wolfram); Austria has one of the largest deposits
worldwide. Tungsten has the highest melting point
of all nonalloyed metals. Therefore, it is used in fila-
ments for lightbulbs, cathode-ray tubes, vacuum tubes,
and other high-temperature applications in the elec-
trical, heating, and welding industries.
Michael Getzner
Further Reading
Austrian Environmental Protection Agency. The State
of the Environment in Austria. 8th Environmental Con-
trol Report. Vienna: Umweltbundesamt, 2008.
Köck, J., U. Schubert, and S. Sedlacek. “Environmen-
tal Policy and Environment-Oriented Technology
Policy in Austria.”Environment and Policy 38(2003):
25-58.
Organization for Economic Cooperation and Devel-
opment. Environmental Performance Review: Austria.
Paris: Author, 2003.
Wurzel, Rüdiger K. W., et al. “Struggling to Leave Be-
hind a Regulatory Past? ‘New’ Environmental Pol-
icy Instruments in Austria.” In “New” Instruments of
Environmental Governance? edited by Andrew Jor-
dan, Rüdiger K. W. Wurzel, and Anthony R. Zito.
London: Frank Cass, 2007.
Web Sites
Austrian Central Bureau of Statistics
Statistics Austria
/>Umweltbundesamt (Austrian Federal
Environmental Protection Agency)
/>See also: Forests; Hydroenergy; Tungsten.
Global Resources Austria • 95
B
Barite
Category: Mineral and other nonliving resources
Where Found
Rich vein deposits of barite are in Mexico, Algeria,
and Morocco. Residual deposits left by the weather-
ing away of barite-bearing limestones and dolomites
exist in Georgia, Missouri, and Ten-
nessee. There are major bedded de-
posits in Arkansas and Nevada; im-
portant bedded deposits also exist in
Germany, France,Ireland,and other
European countries.
Primary Uses
Most of the barite produced is used
in petroleum and natural gas explo-
ration toincrease the density of drill-
ing fluid. It also has uses in the man-
ufacture of glass, rubber, and some
plastics.
Technical Definition
Barite, the most common barium
mineral, is barium sulfate, BaSO
4
.It
occurs as white, gray, or blacktabular
crystals with three good cleavages
and a Mohs scale hardness of 2.5 to
3.5. Its most notable property is its
high specific gravity of 4.5 (its den-
sity is 4.5 times that of water).
Description, Distribution,
and Forms
Barite occurs as vein fillings, com-
monly accompanied by metal sul-
fides; as residual deposits;and asbed-
ded deposits. Rich vein deposits in
Mexico, Algeria, and Morocco have
been important sources of barite.
Barite is highly insoluble, relative to
limestone and dolomite, and the
weathering away of barite-bearing
limestones and dolomites has left sig
-
nificant and easily mined residual deposits in Geor-
gia, Missouri, and Tennessee. Bedded deposits of bar-
ite are fairly common worldwide.
History
A bedded deposit in Arkansas was the leading source
of barite from 1942 to 1982. In the late 1970’s, enor-
Data from the U.S. Geological Survey, .
U.S. Government Printing Office, 2009.
Source: Mineral Commodity Summaries, 2009
160
500
44
65
150
55
615
100
140
Metric Tons
5,0004,0003,0002,0001,000
Vietnam
Turkey
Russia
Pakistan
Morocco
Mexico
United Kingdom
United States
Other countries
Kazakhstan
Iran
India
Germany
China
Bulgaria
Algeria
4,400
95
250
1,000
85
50
65
World Mine Production of Barite, 2008
mous reserves of bedded barite were discovered in
Nevada. Important bedded deposits also occur in
Germany, France, Ireland, andother European coun-
tries.
Obtaining Barite
Vein deposits of barite are thought to be of low-
temperature hydrothermal origin and associated
with igneous intrusion. Residual deposits probably
are closely related to vein deposits in that barite is ini-
tially deposited in fractures in limestone and dolo-
mite (carbonate rocks) by hydrothermal processes or
deposited on the seafloor, where carbonates are accu-
mulating as volcanic exhalations react with sulfate-
rich seawater. Later uplift, followed by weathering
and solution of the carbonate rocks, leavesrichdepos-
its of barite in the carbonate rock residuum.
The origin of bedded deposits is less obvious, but
research has indicated that they may occur where
oxygen-depleted, and therefore sulfate-poor, barium-
bearing seawater has mixed with and reacted with
normal, sulfate-rich seawater, a process that may oc-
cur where deep ocean waters are forced to the sur-
face, by strong deepwatercurrents impingingoncon-
tinental margins, to mix with shallow waters.
Uses of Barite
Most of the barite produced is used in the petroleum
and natural gas exploration industry. It is used to in-
crease the density of drilling fluid to counteract the
high pressures encountered in petroleum reservoir
rocks, thus preventing disastrous blowouts. There are
many other important uses for barite, however. It is
used in glass manufacture to homogenize the melt
and impart brilliance to the final product. Barite is
also animportant additivein many rubber and plastic
products. Raw rubber and some plastics tend to be
soft and gummy. Fillers, fine granular materials with
appropriate physical properties, add firmness, wear
resistance, mechanical toughness, and weight to the
final products. In all, there are more than two thou-
sand uses for barite and barite-based chemicals in in-
dustrial processes and products.
Barium is an effective gamma-ray absorber, and a
mixture of barium sulfate and water has been used to
render the human intestinal tract opaque to X rays
and thus visible on radiographs. Barite compounds,
largely derivedfrom barite, are also used toproduce a
brilliant green color in fireworks.
Robert E. Carver
Web Sites
Natural Resources Canada
Mineral and Metal Commodity Reviews: Barite and
Witherite
/>indu/cmy-amc/content/2007/73.pdf
U.S. Geological Survey
Minerals Information: Barite Statistics and
Information
/>commodity/barite/
See also: Hydrothermal solutions and mineraliza-
tion; Oil and natural gas drilling and wells; Residual
mineral deposits.
Belgium
Categories: Countries; government and resources
With few natural resources of its own, Belgium has
profited from its location at the center of a highlyindus-
trialized area in Europe with several port cities that
have made it one of the world’s largest trading nations.
The Country
Belgium is located in Western Europe and borders
France, the Netherlands, Germany, Luxembourg,
and the North Sea. Along with the Netherlands and
Luxembourg, Belgium has been historically part of
the “Low Countries.” In some economic circles, these
small countries are still connected and reported to-
gether, as they haveformed asort of union referred to
as Benelux nations. Belgium is a small country, about
the size of thestateofMaryland, but itboasts66.5kilo-
meters of coastline. It is centrally located, at the heart
of the European Union, with the majority of Euro-
pean capitals within 1,000 kilometers of Brussels, the
Belgian capital city, which is the headquarters of the
European Union and North Atlantic TreatyOrganiza-
tion (NATO).
Belgium’s geography is varied for a small country,
with flat coastal plains in the northwest near the
North Sea that stretch into the rugged mountains of
the Ardennes forest in the southeast near its borders
with France. In 2006, Belgium’s gross domestic prod
-
uct (GDP) was ranked eighteenth in the world. Ser
-
Global Resources Belgium • 97
98 • Belgium Global Resources
Belgium: Resources at a Glance
Official name: Kingdom of Belgium
Government: Federal parliamentary democracy
under a constitutional monarchy
Capital city: Brussels
Area: 11,788 mi
2
; 30,528 km
2
Population (2009 est.): 10,414,336
Languages: Dutch, French, and German
Monetary unit: euro (EUR)
Economic summary:
GDP composition by sector (2008 est.): agriculture, 0.8%; industry, 23.2%; services, 76.1%
Natural resources: construction materials, silica sand, carbonates
Land use (including Luxembourg, 2005): arable land, 27.42%; permanent crops, 0.69%; other, 71.89%
Industries: engineering and metal products, motor vehicle assembly, transportation equipment, scientific
instruments, processed food and beverages, chemicals, basic metals, textiles, glass, petroleum, pharmaceuticals
Agricultural products: sugar beets, fresh vegetables, fruits, grain, tobacco, beef, veal, pork, milk
Exports (2008 est.): $371.5 billion
Commodities exported: machinery and equipment, chemicals, finished diamonds, metals and metal products,
foodstuffs, pharmaceuticals
Imports (2008 est.): $387.7 billion
Commodities imported: raw materials, machinery and equipment, chemicals, raw diamonds, pharmaceuticals,
foodstuffs, transportation equipment, oil products
Labor force (2008): 4.99 million
Labor force by occupation (2007 est.): agriculture, 2%; industry, 25%; services, 73%
Energy resources:
Electricity production (2007 est.): 82.94 billion kWh
Electricity consumption (2006 est.): 85.54 billion kWh
Electricity exports (2007 est.): 9.035 billion kWh
Electricity imports (2007 est.): 15.78 billion kWh
Natural gas production (2007 est.): 0 m
3
Natural gas consumption (2007 est.): 17.39 billion m
3
Natural gas exports (2007 est.): 0 m
3
Natural gas imports (2007 est.): 17.34 billion m
3
Natural gas proved reserves ( Jan. 2006): 0 m
3
Oil production (2007 est.): 8,671 bbl/day
Oil imports (2005): 1.119 million bbl/day
Oil proved reserves ( Jan. 2006 est.): 0 bbl
Source: Data from The World Factbook 2009. Washington, D.C.: Central Intelligence Agency, 2009.
Notes: Data are the most recent tracked by the CIA. Values are given in U.S. dollars. Abbreviations: bbl/day = barrels per day;
GDP = gross domestic product; km
2
= square kilometers; kWh = kilowatt-hours; m
3
= cubic meters; mi
2
= square miles.
Brussels
Germany
France
Netherlands
Belgium
Luxembourg
United
Kingdom
North
Sea
vices account for about 75 percent of Belgium’s GDP,
a surprisingly high number somewhat related to its
place as the headquarters of the European Union,
NATO, and other major organizations based in Eu-
rope. Its workforce is highly educated and multilin-
gual. The capital, Brussels, is home to more than one
million people and about fifty-four thousand busi-
nesses. On its own, Brussels produces about 20 per-
cent of Belgium’s GDP.
Although Belgium has few natural resources of its
own, its location at the center of a highly industrial-
ized area in Europe with several port citiesmeans that
it functions as a trading center for many goods. Its
paucity of natural resources was supplemented his-
torically by its colonial possessions in the Belgian
Congo (now Democratic Republic of the Congo),
which provided raw materials such as cobalt, copper,
diamonds, cacao, and zinc. Belgium’s economy de-
pends heavily on importing raw materials or other
goods that are finished or further processed and then
exported. Historically, its most prominent natural
resource was coal, but in 1992, its coal mines closed
permanently, and, unless the price of coal increases
to the point of making it worthwhile to extract the
deeply embedded seams, the mines are unlikely to re-
open. Belgium ranks fifteenth on the list of world’s
largest trading nations with about three-quarters of
its trading done with its European Union neighbors,
particularly Germany, the Netherlands, France, and
the United Kingdom.BecauseofBelgium’s economic
reliance on trading and processing rough goods, its
economy is dependent on world markets and their
stability to a much higher degree than countries with
their own natural resources and independent econo-
mies.
Coal
Historically, Belgium was a major producer and ex-
porter of coal. Coal in Belgian coal mines, especially
in the Kempen and Sambre-Meuse Valley, was easy to
extract, and mining was a booming business. In the
heyday of its coal-mining industry, Belgium imported
workers from other countries to keep the coal mines
operating. However, after the easily accessible coal
had been extracted and the seams of coal ran farther
underground and into harder materials, continuing
to extract coal from these mines became economi-
cally inefficient. Between 1957 and 1992, Belgium
shut down more than 120 coal mines, and unless the
price of coal rises to the point of making this coaleco
-
nomically feasible to extract and export, it is unlikely
that these mines will return to operation.
Construction Materials
Belgium is a source of construction materials such as
silica sand, chalk, stone, and carbonates. Chalk and
limestone are mined in the regions surrounding
Tournai, Mons,and Liège, where there is acement in-
dustry of some significance. The glass manufacturing
industry isalso supported bysands from the Kempen-
land area. Pottery products and bricksare made from
clays from the Borinage region. Quarries also pro-
duce stones such as specialty marble, dolomite, gran-
ite, and sandstone.
Diamonds
Belgium is the leading country in the diamond trad-
ing market. Its port city of Antwerp is the diamond
capital of the world, housing the leading diamond
market in the world. Rough diamonds are imported
and then processed into finished diamonds in Ant-
werp, where they are then traded and exported. This
city is also the leading diamond cutting area of the
world, where, the traditional story says, the first dia-
mond wascut in 1476. The diamond cutting andtrad-
ing center called “the Diamond Quarter” near Cen-
tral Station (the train station near the port)has been a
growing, thriving entity since the sixteenth century.
Though the diamond processing arm of the trade is
diminishing, diamond exports still account for about
one-tenth of all exports from Belgium. Nearly 85 per-
cent ofthe world’s rough diamonds and about 50 per-
cent of thefinished (polished) diamondsin the world
pass through this city. In 2006, the United States ac-
counted for about $2.8 billion of Belgium’s diamond
exports, whichamounts to about20 percent of allBel-
gian exports to the United States. Overall, about $39
billion of diamonds are traded through thecity,which
accounts for about 8 percent of all Belgium’s exports.
This diamond trade accounts for nearly 70 percent of
the country’s positive trade balance and represents
about 15 percent of Belgium’s trade with non-Euro-
pean Union countries. This prosperous business em-
ploys, directly or indirectly, nearly thirty-fivethousand
people.
Sugar
One of Belgium’s fastest-growing exports is sugar
from sugar beets. In 2006, the exports of sugar from
Belgium to the United States rose more than 5,000
Global Resources Belgium • 99