Encyclopedia of Global Resources part 29 pptx
Bạn đang xem bản rút gọn của tài liệu. Xem và tải ngay bản đầy đủ của tài liệu tại đây (255.01 KB, 10 trang )
geared toward improving the water productivity in
river basins. The emphasis of the program is to create
synergies andpartnerships amongthe stakeholdersin
ways that are pro-poor, gender equitable, and envi-
ronmentally sustainable.
Since the 1970’s, climate change has been a re-
search area of interest to CGIAR scientists. They have
been working on theeffects of climate change on nat-
ural resources, including water resources, and devel-
oping crop varieties that can continue to provide the
needed food to an ever-growing world population.
The scientistshave also been active in identifyingpoli-
cies and newapproaches forcommunities todeal with
climate change and its consequences. All these years
of research have led to the release of improved crop
varieties, new farming techniques and crop produc-
tion methods, and the development of policies to
help rural populations, especially indeveloping coun-
tries, manage natural resources in a sustainable way.
Lakhdar Boukerrou
Web Site
Consultative Group on International
Agricultural Research
See also: Agriculture industry; Agronomy; Green-
house gases and global climate change; Land Insti-
tute; Land-use planning.
Copper
Category: Mineral and other nonliving resources
Where Found
Copper deposits are found inseveral types of geologic
environments. Most common are the porphyry cop-
per ore deposits that formed in magmatic arcs associ-
ated with subduction zones. These types of ores are
found in Canada, the western United States, Mexico,
Peru, and Chile. Other important copper deposits
were formed by different processes and are found in
central Europe, southern Africa, Cyprus, Indonesia,
and Japan.
Primary Uses
The major usesof copperare in the electricalindustry
because of the substance’s ability to conduct electric
-
ity efficiently. Copper is also utilized extensively in the
construction industry especially for plumbing. Most
of the remaining copper is alloyed with other metals
to make bronze (with tin), brass (with zinc), and
nickel silver (with zinc and nickel, not silver).
Technical Definition
Copper (chemical symbol Cu) is a reddish mineral
that belongs to Group IB of the periodic table. Cop-
per has an atomic number of 29 and an atomic weight
of 63.546, and it is composed of two stable isotopes,
copper 63 (69.17 percent) and copper 65 (30.83 per-
cent). Pure copper has a face-centered cubic crystal-
line structure with a density of 8.96 grams per cubic
centimeter at 20° Celsius. The melting point of cop-
per is 1,083° Celsius, and the boiling point is 2,567°
Celsius.
Description, Distribution, and Forms
Copper is a ductile metal and a good conductor of
heat and electricity. It is not especially hard or strong,
but these properties can be increased by cold working
of the metal.
Copper is a relatively rare element, making uponly
50 parts per billion in the Earth’s crustal rocks. It oc-
curs in nature both in elemental form and incorpo-
rated into many different minerals. The primary min-
erals are the sulfides (chalcopyrite, bornite, covellite,
and others), oxides (cuprite and others), and carbon-
ates (malachiteand azurite). Copper has two valences
(degrees ofcombining power), +1 and +2, and impor-
tant industrial compounds have been synthesized us-
ing both oxidation states. The most useful industrial
+1 (cuprous, or Cu I) compounds are cuprous oxide
(Cu
2
O), cuprous sulfide (Cu
2
S), and cuprous chlo-
ride (Cu
2
Cl
2
). Important +2 (cupric, or Cu II) com-
pounds used by industry are cupric oxide (CuO), cu-
pric sulfate (CuSO
4
), and cupric chloride (CuCl
2
).
Although copper is relatively rare in the crust of
the Earth, it has been concentrated into ore deposits
by geologic processes. There are four major types of
copper ore deposits, each formed by a different set of
geologic events.
Most of the copper mined is taken from porphyry
copper deposits.These deposits are composedof cop-
per minerals disseminated fairly evenly throughout
porphyritic granitic rocks and associated hydrother-
mal veins. The primary ore mineral is chalcopyrite, a
copper/iron sulfide. Porphyry copper ore deposits
are generally located in rocks that have been formed
250 • Copper Global Resources
near convergent plate boundaries where the granites
have been produced from magma generated during
the subduction of an oceanic plate beneath a conti-
nental plate. This tectonic regime has existed along
the western coastsof North America and South Amer-
ica for more than 200 million years; consequently, gi-
ant porphyry copper deposits are found in western
Canada, the western UnitedStates, Mexico,Peru, and
Chile. The world’s two largest producers of copper
are Chile and the United States, and the largest cop-
per ore deposit in the world is located in Chile. Other
porphyry copper depositsare foundin Australia, New
Guinea, Serbia, the Philippines, and Mongolia.
A second kind of copper ore deposit is commonly
called a Kupferschiefer type because of the large
quantity of copper found in the Kupferschiefer shale
of central Europe. Thecopper occursin a marineshale
that is associated with evaporites and nonmarine sedi-
mentary rocks. The origin of the copper in these ores
is still debated. The Zambian-Democratic Republic of
the Congo copper belt of southern Africa contains
morethan 10 percent ofthe world’s copper reserves.
Copper is also found in massive sulfide deposits
in volcanic rocks, ophiolites, greenstone belts, and
fumarolic deposits. Copper-bearing massive sulfide
ores are found in Canada, Cyprus, and Japan.
Global Resources Copper • 251
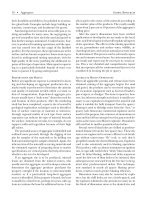
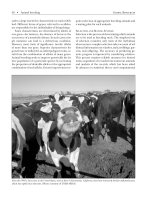
Data from the U.S. Geological Survey, . U.S. Government Printing Office, 2009.Source: Mineral Commodity Summaries, 2009
650,000
460,000
270,000
1,220,000
430,000
750,000
1,310,000
560,000
2,030,000
Metric Tons
6,000,0005,000,0004,000,0003,000,0002,000,0001,000,000
Zambia
Poland
Peru
Mexico
Kazakhstan
Indonesia
Russia
United States
Other countries
China
Chile
Canada
Australia
850,000
590,000
5,600,000
1,000,000
Copper: World Mine Production, 2008
A fourth type of copper deposit is found on the
deep-ocean floors, where manganese nodules have
formed very slowly inareas of unusuallyslow sedimen-
tation. These nodules contain not only manganese but
also copper, cobalt, and nickel in economically im-
portant concentrations. Since these nodules gener-
ally form in water depths of 900 to 2,000 meters, they
are difficult to mine. They do, however, represent an
important potential source of copper for the future.
Copper is an essential trace element of life and is
found in various concentrationswithin plantsand ani-
mals. For example, copper is found in many blue-
blooded mollusks and crustaceans because it is the
central element in hemocyanin, a molecule that trans-
ports oxygen in the organisms. It is found in lesser
concentrations in many other organisms, such as sea-
weeds, corals, and arthropods.
Copper can be found in most soils, and its absence
or unavailability to plants will cause the soil to be rela-
tively infertile. For example, many muck soils that are
very rich in organic material cannot sustain plant life
because the copper is bound to the organic matter
and is therefore not available to plants.
Some soils have suffered from copper pollution at-
tributable to the excess of copper-bearing fertilizers
and the application of copper-rich fungicides or sew-
age wastes tothe land. Researchhas shown thatthe ac-
cumulations of copper in these soils will not be effec-
tively leached from the land for decades or even
centuries because the copper has an affinity for soil
colloids that can tightly bind the copper.
Copper is distributed throughout the Earth’s litho-
sphere, hydrosphere, atmosphere, and pedosphere
in variousconcentrations. About 5 percent ofthe cop-
per content of the lithosphere is found in sedimen-
tary rocks, particularly shale, and only about 0.00004
percent in soils. Only about 0.001 percent of the cop-
per of the lithosphere is in exploitable concentra-
tions, and some of thesedeposits have been minedfor
centuries. The total production of copper by mining
is approximately 300 million metric tons, of which
about 80 percent was mined in the twentieth century.
Almost 30 percent of the entire world’s historic pro-
duction of copper was mined in the 1980’s. The total
copper mined amounts to about twice the total cop-
per in the upper 2 centimeters of soil worldwide and
nearly tentimes thetotal copper found in all living or-
ganisms. Much ofthe copper produced hasbeen used
and thendisposed of on land or wasted inwater orthe
atmosphere. The impact of the transfer of this much
copper from the deposits of the crust to the surface of
the Earth is not yet well understood.
The total amountof copperreleased intothe atmo-
sphere has been estimated to be almost three times
the amount of carbon in the atmosphere today. The
residence time of copper in the atmosphere is quite
short, and there probably has not been a significant
buildup of copper overtime, butthe atmosphere does
act as a medium for transferring copper around the
globe. Copper pollution of many local ecosystems has
been well documented in areas near smelters and
copper mines. Although it is clear that copper con-
centrates in the soils andwaters near theareas, the im-
pact of copper pollution is often hard to separate
from the environmental effects resulting from in-
creased levels of other heavy metals and from sulfur
dioxides and other gases released from smelters.
Research has also shown that urban areas generally
have much higher levels of copper in the soils and air
than are found in rural areas. In many cases the cop-
per concentration in urban soils is more than ten
times that of nearby rural areas. In addition, it is well
established that the dumping of sewage into rivers,
lakes, and the ocean can raise the concentrations of
copper in the sediments by factors of two to one hun-
dred times the background levels in unpolluted areas.
However, distinguishing the environmental impact of
copper from the effects of the associated metals
found in sewage effluent is difficult.
Copper is an essential element in the human diet.
It is found in several oxidative enzymes, such as cyto-
chromes a and a3, ferroxidase, and dopamine hy-
droxylase. The copper is used by enzymes in the oxi-
dation and absorption of iron and vitamin C. The
level of copper in the body is primarily controlled by
the excretion ofthe elementin bile. Absorbed copper
is probably stored internally by some intracellular
proteins.
Generally, copper deficiencies in humans are rare.
There are two known genetic diseases, Wilson’s dis-
ease and Menkesdisease, that disrupt coppermetabo-
lism. In Wilson’s disease, an unknown mechanism re-
stricts the excretion of copper in bile, and as a result
copper builds up in various tissues in the body. Once
diagnosed, Wilson’s disease can be treated by giving
the patient a chelating agent to remove the accumu-
lated copper. Menkes disease, commonly called steely
or kinky hair syndrome, causes inefficient utilization
of copper in the body. This lack of copper affects the
normal formation of connective tissue and the loss of
252 • Copper Global Resources
some widespread enzymatic activity.
Death generally occurs within the
first three years.
History
Copper was one of the first metals
mined and usedby humans. It,along
with gold and silver, occurs naturally
as a free elemental metal and thus
can be extracted and used without
smelting or refining. Neolithic hu-
mans probably learned that this un-
usual metal could be shaped by ham-
mering with stone tools and that the
copper tools could be hardened by
continued cold working. The first use
of copper probably predated 8000
b.c.e. By 6000 b.c.e. it was known
that copper could be melted in crude
furnaces and poured into casts to
elaborate weapons and ornaments.
Egyptian copper artifacts are dated as far back as
5000 b.c.e., and ancient Egyptians appear to have
been the first to alloy copper with tin to make bronze.
The earliest record of a bronze artifact dates to about
3700 b.c.e. Bronze makes better weapons and orna-
ments because it is much harder and tougher than
pure copper. As a result, the bronze technology spread
throughout the Middle East and into Asia. Bronze
items at least as old as 2500 b.c.e. have been found in
China, but the alloy may have been used earlier.
Bronze was superseded by iron as the metal of
choice for weapons and for structural uses. This tech-
nological advance occurred after furnaces were devel-
oped that could obtain temperatures high enough to
smelt iron from its ores. After the introduction of iron
and later steel into common use, copper and its alloys
were used primarily for ornaments, utensils, pipes for
plumbing, and coinage. Because of its natural resis-
tance to most corrosion caused by air and seawater,
copper wascommonly utilized for purposes requiring
such protection. The discovery of electricity and the
invention of the incandescent lightbulb and electric
motors led to theextensive useof copperfor the trans-
mission of electricity. This became the most common
and most important use of copper.
Obtaining Copper
Copper is mined in fifty to sixty countries worldwide,
with Chile accounting for about 35 percent of the
production in 2008. The primary ore minerals of cop-
per are chalcopyrite (copper-iron sulfide), chalcocite
(copper sulfide), covellite (copper sulfide), azurite
(copper carbonate), and malachite (copper carbon-
ate). Other ore minerals of lesser importance are na-
tive copper, bornite, enargite, tetrahedrite, cuprite,
tenorite, chalcanthite, and chrysocolla.
The copper sulfide minerals are found in por-
phyry, massive sulfide, andKupferschiefer typedepos-
its, and the copper carbonates and copper oxides are
commonly found in the upper zones of such deposits
that have been exposed to weathering and ground-
water action.
Much of the copper of the world is extracted from
open-pit mines that expose the ore deposits. The
overburden of surrounding rock or soil covering the
ore is physically removed, and the ore extracted by
drilling and detonating explosives to loosen the ore.
Underground mining is done using standard tech-
niques of tunneling and blasting. The ore from either
underground mines or open-pit mines is then gath-
ered and hauled to ore processing plants, where the
ore is crushed and the copper and other metals are
concentrated. The concentrated ore usually mea-
sures 20 to 30 percent copper, and it is then either
smelted or leached to produce a relatively high con-
centration of copper, which still contains some impu
-
rities. This smelted copper is then electrolytically re
-
fined to a purity of more than 99 percent.
Global Resources Copper • 253
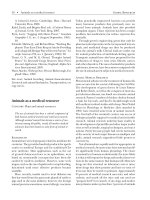
A worker in a Chinese factory guides a forklift loaded with rolls of copper tubes. (AP/
Wide World Photos)
Uses of Copper
Copper was one of the first metals
used by humans because it can be
found in nature as pure metal and
can be worked easily by hand. Pure
copper was probably first mined and
used by humans around 8000 b.c.e.
Through the ensuing ages, copper
has remained an important metal
and a component of such important
materials as pewter, brass, and other
bronzes. After the Industrial Revo-
lution, copper became the second
most used metal in the industrial
world behind only iron. However,
the discovery of aluminum, its prop-
erties, and its general availability
made aluminummore useful in mod-
ern society.
Copper is one of the most com-
monly used metals in the world, and,
because of its special qualities of high
ductility and electrical conductivity,
it is used extensively in the electrical
industries. Copper that has been re-
fined electrolytically is up to 99.62 percent pure; the
primary remaining material is oxygen. The oxygen
helps to increase the density and conductivity of cop-
per wire. Thewire canbe produced inlarge quantities
by rolling the copper into rods, which are then drawn
through tungsten carbide or diamond dies to form
the wire.
Copper is also produced in sheets or smaller strips
by initially rolling hot copper, with later rollings done
with cold copper. The resultant strips or sheets are
generally of even thickness and uniform surface ap-
pearance. This strip copper can be cut or pressed to
be used in the electrical or construction industries.
One of the earliest uses of copper was in the pro-
duction of bronze. The early bronzes were copper/
arsenic alloys; later, tin was added at various concen-
trations. Modern bronzes are alloys of copper and tin,
and they are used primarily for ornaments, bells, and
musical instruments. The bronze used in making
bells and musical instruments usually contains up to
20 percent tin to impart the proper tonal qualities to
the sounds produced from these instruments. An-
other traditional use for copper is in the production
of pewter, which is an alloy of copper and lead. Since
lead is highly toxic, the use of pewter has been re
-
stricted in recent times and is generally reserved for
ornamental pieces.
Brass is a widely used alloy of copper and zinc. Al-
though the coppercontent of brasscan range from less
than 5 percent to more than 95 percent, only brasses
of at least 55 percent copper can be worked and used
industrially. White brasses contain more than 45 per-
cent zinc and are not at all malleable and thus are not
useful for industrial purposes. The various relative
concentrations of copper and zinc produce brasses of
widely varying physical properties of hardness, ductil-
ity, and malleability. Many brasses can be drawn into
wire, rolled into sheets, or formed into rods.
Copper and nickel are completely miscible and
therefore can be mixed in any relative concentration.
The various mixturesproduce alloys with various physi-
cal properties and different industrialuses. The alloys
using 2 percent to 45 percent nickel produce a mate-
rial with a much higher hardness than pure copper,
and the mixture of about 20 percent nickel produces
an extremely ductile alloy that can be cold worked
without annealing. This makes this mixture useful for
drop forging, cold stamping, and pressing. Indus
-
trially this alloyis commonlyused forfittings in theau
-
tomobile industry and for bullet sheathing. Copper
254 • Copper Global Resources
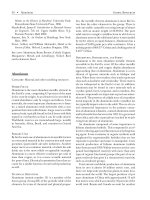
Source: Mineral Commodity Summaries,
2009
Data from the U.S. Geological Survey,
. U.S. Government Printing Office, 2009.
Building
construction
49%
Electrical
& electronic
products
21%
Industrial
machinery
& equipment
9%
Transportation
equipment
10%
Consumer
&general
products
11%
U.S. End Uses of Copper and Copper Alloy Products
and nickel occur together in some ores and can be
smelted to produce a natural alloy called Monel metal.
The natural ores usuallyalso contain somemanganese,
which, withother impurities, is incorporated in theal-
loy.It isalso producedartificially bymixing theappro-
priate levelsof nickel, copper, and manganese.Monel
metal is extremely strong at normal and high temper-
atures and thus has many engineering applications.
Copper can also be alloyed with various metals to
form other types ofbronzes. It can be mixedwith 9per-
cent aluminum to form aluminum bronzes, which
are corrosion-resistant metals. Manganese bronzes,
which are high-strength alloys, usually contain cop-
per, zinc, aluminum, and 2 to 5 percent manganese.
The addition of 1 to 3 percent silicon and 1 percent
manganese to copper produces the silicon bronzes,
which have good welding and casting qualities. A very
strong alloy of copper and about 2 percent beryllium
can be strengthened by heat working and will pro-
duce a metal with a hardness equal to that of many of
the harder steels.
Many copper-containing compounds are used for
industrial purposes. Cuprous oxide is used as an anti-
fouling agent in some paints and to give some glass a
red color. A green color can be imparted to glass by
cupric oxide, and cupric chloride is usedin the manu-
facture of some pigments. Copper sulfate is commonly
used as a desiccant and in the production of electro-
lytically refined copper. Like many other copper com-
pounds, copper carbonates impart strong blue or
green colors to solutions and are used in the produc-
tion of many pigments. Copper can also be combined
with arsenic; these compoundsare used asinsecticides.
Jay R. Yett
Further Reading
Adriano, Domy C.“Copper.” In Trace Elementsin Terres-
trial Environments: Biogeochemistry, Bioavailability,
and Risks of Metals.2d ed. NewYork:Springer, 2001.
Brookins, Douglas G. Mineral and Energy Resources: Oc-
currence, Exploitation, and Environmental Impact.Co-
lumbus, Ohio: Merrill, 1990.
Greenwood, N. N., and A. Earnshaw. “Copper, Silver,
and Gold.” In Chemistry of the Elements. 2d ed. Bos-
ton: Butterworth-Heinemann, 1997.
Joseph, Günter. Copper: ItsTrade, Manufacture, Use, and
Environmental Status. Edited by Konrad J. A. Kundig.
Materials Park, Ohio: ASM International, 1999.
Krebs, Robert E. The History and Use of Our Earth’s
Chemical Elements: A Reference Guide. Illustrations by
Rae Déjur. 2d ed. Westport, Conn.: Greenwood
Press, 2006.
Linder, Maria C. Biochemistry of Copper. Vol. 10 in Bio-
chemistry of the Elements. New York: Plenum Press,
1991.
National Research Council. Copper in Drinking Water.
Washington, D.C.: National Academy Press, 2000.
Nriagu, Jerome O., ed. Copper in the Environment.
2 vols. New York: Wiley, 1979.
Web Sites
Copper Development Association, Inc.
Copper.org: The Ultimate Source for Information
on Copper and Copper Alloys
Natural Resources Canada
Canadian Minerals Yearbook, Mineral and Metal
Commodity Reviews
/>indu/cmy-amc/com-eng.htm
U.S. Geological Survey
Copper: Statistics and Information
/>commodity/copper
See also: Alloys; Bronze; Metals and metallurgy;
Mining wastes and mine reclamation; Plate tectonics;
Plutonic rocks and mineral deposits; Secondary en-
richment of mineral deposits.
Coral reefs
Categories: Ecological resources; plant and animal
resources
Where Found
Typical coral reefs occur in shallow water ecosystems
of the Indo-Pacific and Western Atlantic regions.
Lesser known cold-water reefs are found at depths be-
tween 40 and 3,000 meters along continental shelves,
continental slopes, seamounts, andfjords worldwide.
Primary Uses
Reefs protect shorelines from wave action and storm
damage. Historically, coral has been used in bricks
and for mortar. Other uses include souvenirs, aquar
-
ium specimens, and even human bone grafts.
Global Resources Coral reefs • 255
The diverse array of plants, invertebrate animals,
and vertebrate life that a reef supports are used by
humans as food, living and preserved displays, and
traditional medicine. Bioprospecting has identified a
promising chronic-pain treatment from a reef mol-
lusk. Two possible cancer drugs and an anti-asthma
compound have been isolated from reef sponges.
Technical Definition
Corals are animals in thephylum Cnidaria,kin to jelly-
fish. As members of the class Anthozoa, they are
closely related to sea anemones. Reef-building corals
secrete calcium carbonate (CaCO
3
) skeletons that
surround the individual soft-bodied organisms com-
prising the colony. The living layer mounts itself on
layer upon layer of the unoccupied skeletons of its
ancestors.
Corals are carnivorous,capturing and stinging zoo-
plankton with tentacles surrounding the single open-
ing that serves as mouth and anus. Corals derive a
greater amount of nourishment from photosynthetic
algae living within cells lining their digestive cavity.
Bleaching refers to the loss of these endosymbionts,
called zooanthellae, from the coral host or loss of pig-
ment from the algae. Coral may or may not recover
from a bleaching episode.
Description, Distribution, and Forms
According to the Global Coral Reef Monitoring Net-
work, 20 percent of reefs have been lost, 24 percent
risk imminent collapse because of human pressure,
and 26 percent are threatened with collapse over
time. Threats to this diverse, productive, complex,
and fragile ecosystem are wide-ranging. Some of the
damage originates from imbalanceson land.Nutrient
excesses run off farms and end up in the oceans,feed-
ing explosive reproduction of bacteria. The bacteria
use up the available oxygen, creating uninhabitable
“dead zones.” Another chain reaction begins with de-
forestation. Increased erosion washes large amounts of
256 • Coral reefs Global Resources
This coral reef in Bonaire, the Netherlands Antilles, was badly damaged by a 2008 hurricane. (Roger L. Wollenberg/UPI/Landov)
soil into thewaterway, increasing waterturbidity, which
blocks light to the coral’s zooanthellae. Particulate
matter also settles onto the corals, smothering them.
Pollution from the construction and operation of ma-
rinas, prawn farms, desalination plants, sewage treat-
ment works, and hotels further degrades the reefs.
Ship grounding, channel dredging, deep-water trawl-
ing, oil and gas exploration, laying of communication
cable, dynamite and cyanide fishing, and tourism
each take a toll.
Environmental stress renders corals more suscepti-
ble to disease. Disproportionate changes in herbi-
vores and predators further disrupt life on the reef.
Reduced herbivoryby sea urchins or parrot fish allows
algae to replace corals. When tritons, large predatory
snails, are harvested for theirshowy shells,population
explosions of the crown-of-thorns starfish can deci-
mate reefs.
Storms, such as the 2004 tsunami in the Indian
Ocean, shatter and smother large numbers of corals.
Climate changewill likely expose the reefs to intolera-
ble temperature fluctuations. Low temperatures in
1968, high temperatures in 1987, and major El Niño
and La Niña events in 1998 each caused wide-ranging
bleaching. Rising levels of carbon dioxide, combined
with warmer seawater, inhibit formation of the corals’
skeletons.
Designating marine protected areas (MPAs), of
which the United States has two hundred, is intended
to enhance the management and monitoring of
unique ocean ecosystems such as coral reefs. How-
ever, fishing and resource extraction are allowed to
continue in MPAs, so reef conservation requires
stronger protection, such as “no-take areas.”
Australia’s Global Coral Reef Monitoring Network
publishes the Status of Coral Reefs of the World biannu-
ally. It includes recommendations for reef conserva-
tion from morethan eightycountries. Nearly one-half
of the coral reef countriesand states have populations
under 1 million. Roughly half of those have less than
100,000 inhabitants. It stands to reason that with less
international political clout, banding together ad-
vances protection of the reefs.
An area equal to 1 percent of the world’s oceans,
190 million kilometers, is coveredby coralreefs. Indo-
nesia has the largest area of warm-water (18°-32° Cel-
sius) reefs. Norway is estimated to have the most cold-
water (4°-13° Celsius) coral reefs. Cold-water reefs
occupy depths below light penetration. Rather than
relying on photosynthetic algae, cold-water reefs are
supplied particulate anddissolved organic matterand
zooplankton by currents. Species diversity of coral
and associated organisms is lower, and the reefs grow
more slowly than their tropical counterparts.
Individual corals are measured in millimeters. To-
gether, billions of these animals form reef structures
as imposing as Australia’s Great Barrier Reef, which is
2,000 kilometers longand 145 kilometerswide. Thisis
even more impressive when one realizes that a reef
may grow as little as 1 meter in one thousand years.
Dependent upon coral species and physical envi-
ronment, reefs can be branching, massive, lobed, or
folded. On a larger scale, reefs are fringing, barrier,
atoll, or platform. Fringing reefs extend from the
shoreline. Barrier reefs run parallel to the coast, sepa-
rated from shore by a lagoon. An atoll is a living reef
around a central lagoon. Platform reefs lie far off-
shore, in calm waters; they are flat-topped with shal-
low lagoons.
History
Coral reef history stretches back hundreds ofmillions
of years. Coral larvae that gave rise to modern-day
reefs settled on limestone during the Holocene ep-
och, ten thousand years ago. Humans have been ex-
ploiting reef resources for the past one thousand
years. Atlantic warm-water reefs are less diverse than
those of the Pacific. Reasons for this disparity include
lower temperatures, younger geologic age of the
ocean, and lower sea levels during the Ice Age in the
Atlantic than in the Pacific.
Charles Darwin published The Structure and Distri-
bution of Coral Reefs in 1842. One hundred years ago,
the world’s reefs were healthy. Pollutionand sedimen-
tation had not emerged as problems, and natural fish
populations were harvested sustainably.
In the 1950’s, the geology of reef formation, reef
zonation and productivity,and the role ofdisturbance
were areas of study advanced considerably with the
widespread use of scuba gear. During the 1980’s, re-
search shifted to human impact and decline of coral
reefs and how to conserve and restore reefs.
The study of cold-water reefs awaited necessary in-
strumentation and deep submersibles, available only
since the late 1990’s. Within the same time frame, the
Kyoto Protocol limited carbon emissions, one-third
of the Great Barrier Reef was designated a no-take
area, and sea urchins returned the balance to Carib
-
bean reefs, each a measure that promises to improve
the health of coral reefs.
Global Resources Coral reefs • 257
Obtaining Reef Resources
Coral reefs support the marine aquarium trade and
luxury live food markets. Fishes and reef organisms
are captured by hand, hook and line, spear, nets, and
trawl nets. Overfishing has ledto reliance on methods
with indiscriminate by-catch and habitat destruction
via dynamite andcyanide fishing. Handlingand trans-
fer mortality drive extraction rates even higher in
order to meet global demand.
Uses of Reef Resources
The main usesof coral reefs are theirin situecosystem
services. The vivid interdependency of the diversity
they support rivals that of tropical rain forests. Hun-
dreds of species of coral support thousands of other
organisms, including, but not limited to, algae, sea-
grass, plankton, sponges, polychaete worms, mollusks,
crustaceans, echinoderms, and fish. More than one-
half of all marine fish species are found on coral reefs
and reef-associated habitats. Largerpredators, such as
sharks and moray eels, feed on the fish. The extensive
coral reef food web cycles nutrients in oligotrophic
(nutrient-poor) tropical waters.
Over millennia, coral reefs have formed landmasses
rising up from the sea. The Maldives, Tuvalu, theMar-
shall Islands, and Kiribati are atoll countries sitting
atop coral islands. The Florida keys are well-known
coral islands.
Calcification in corals, mollusks, and others se-
questers one-third of human-induced CO
2
emissions.
Loss of this carbon sink would exacerbate the effects
of climate change. The value of that cannot be mea-
sured. Tourism, fishing, and ecosystem services are
valued at hundreds of billions of dollars annually.
Used in traditional medicine for centuries, reef or-
ganisms continue to be studied for use in Western
medicine. Antiviral, antifungal, and anticancer prod-
ucts; inflammatoryresponse mediators;and evensun-
block are under development, some of which have
already been administered to patients. Marine bio-
technology is amultibillion-dollar industry, withstrong
growth potential. Ultimately, the health of humanity
is tied to the health of the reefs.
Sarah A. Vordtriede
Further Reading
Brennan, Scott R., and Jay Withgott. Environment: The
Science Behind the Stories. San Francisco: Benjamin
Cummings, 2005.
Côté, Isabelle M., and John D. Reynolds, eds. Coral
Reef Conservation. New York: Cambridge University
Press, 2006.
Feely, R. A., et al. “Impact of Anthropogenic CO
2
on
the CaCO
3
System in the Oceans.” Science 305, no.
5682 (July 16, 2004): 362-366.
Hare, Tony. Habitats. New York: Macmillan, 1994.
Kricher, John C. A Neotropical Companion: An Introduc-
tion to the Animals, Plants, and Ecosystems of the New
World Tropics. Princeton, N.J.: Princeton University
Press, 1997.
Lalli, Carol M., and Timothy Richard Parsons. Biologi-
cal Oceanography. Oxford, Oxfordshire, England:
Butterworth Heinemann, 1997.
Moyle, Peter B., and Joseph J. Cech, Jr. Fishes: An Intro-
duction to Ichthyology. 2d ed. Englewood Cliffs, N.J.:
Prentice-Hall, 1988.
Pechenik, Jan A. Biology of the Invertebrates. 6th ed. New
York: McGraw-Hill, 2010.
Tunnell, John Wesley, Ernesto A. Chávez, and Kim
Withers. Coral Reefs of the Southern Gulf of Mexico.
College Station: Texas A&M University Press, 2007.
Web Sites
Coral Reef Alliance
/>U.S. Environmental Protection Agency
Habitat Protection: Coral Reef Protection
/>See also: Animals as a medical resource; Australia;
Biotechnology; Calcium compounds; Clean Water
Act; Coastal Zone Management Act; Ecosystems; El
Niño and La Niña; Environmental degradation, re-
source exploitation and;Fisheries; Monsoons;Ocean-
ography; Oceans.
Corn
Category: Plant and animal resources
Where Found
Corn grows as far north as Canada and Siberia
(roughly 58° northlatitude) andas far southas Argen-
tina and New Zealand (40° south). Although adapt-
able toa widerange ofconditions, corn does best with
at least 50 centimeters of rainfall (corn is often irri
-
gated in drier regions) and daytime temperatures be
-
258 • Corn Global Resources
tween 21° and 26° Celsius. Much of the United States
meets thesecriteria, henceits ranking as the top corn-
producing country in the world.
Primary Uses
Corn is the most important cereal in the Western
Hemisphere. It is used as human food, as livestock
feed, and for industrial purposes.
Technical Definition
Corn (Zea mays) is a coarse, annual plant of the grass
family. It ranges in height from 1 to 5 meters, has a
solid, jointed stalk, and grows long, narrow leaves. A
stalk usually bears one to three cobs, which develop
kernels of corn when fertilized.
Description, Distribution, and Forms
Corn no longer grows in the wild; it requires human
help in removing and planting the kernels to ensure
reproduction. In the United States and Canada,
“corn” is the common name for this cereal, but in Eu-
rope, “corn” refers to any of the small-seeded cereals,
such as barley, wheat, and rye. “Maize” (or its transla-
tion) is the term used for Zeamays in Europe and Latin
America.
History
Christopher Columbus took corn back to Europe
with him in 1493, andwithin one hundredyears it had
spread through Europe, Asia, and Africa. Reportedly,
a corn crop is harvested somewhere in the world each
month.
Corn’s exact origins remain uncertain, but most
scholars agree that it is closely linked to a grass called
teosinte, which is native to Mexico. Through unknown
means a wild corn evolved with tiny, eight-rowed
“ears” of corn about 2 centimeters long. Corncobs
and plant fragments from this wild corn have been
Global Resources Corn • 259
Data from United Nations Food and Agriculture Organization.Source:
52.1
151.9
14.5
84.0
18.9
13.3
23.5
67.2
333.1
Millions of Metric Tons
35030025020015010050
Nigeria
India
Hungary
France
China
Brazil
Indonesia
Mexico
United States
21.8Argentina
Corn: Leading Producers, 2007