Encyclopedia of Global Resources part 70 pptx
Bạn đang xem bản rút gọn của tài liệu. Xem và tải ngay bản đầy đủ của tài liệu tại đây (267.92 KB, 10 trang )
beled and unlabeled analytes compete
for limited amounts of a molecule that
binds the analyte very specifically. RIA
is used worldwide in the determina-
tion of hormones, drugs, and viruses.
The technique is so specific that con-
centrations in the picomolar region
can be measured. Another major use
of radioisotopes is as tracers that de-
termine metabolic pathways, transport
processes, and reaction mechanisms.
A compound labeled with a radioac-
tive isotope is introduced into the pro-
cess, and the radioactivity allows the
compound to be followed through the
mechanism.
Pharmacokinetics is the study of the rates of move-
ment and biotransformationofadrug and its metabo-
lites in the body. Many kinetic parameters, such as a
drug’s half-life in the body, can be determined by us-
ing radiolabeled drugs and measuring radioactivity
after some type of chromatographic separation of the
parent drug from its metabolites.
Radiopharmaceuticals are substances labeled with
radionuclides that are used in the visualization of or-
gans, the location of tumors, and the imaging of bio-
chemical processes. This usage is based on the fact
that a substance that is found in a healthy cell at a cer-
tain concentration has a different concentration in
damaged cells. The particular isotope used depends
on the organ or biochemical process under study.
Radioisotopes are used in many ways in industry.
Gamma rays from cobalt 60 are used to examine ob-
jects for cracks and other defects. Radioisotopes can
be used to measure thickness of all types of rolled ma-
terials and as tracers in locating leaks in pipes carry-
ing liquids or gases. The fill level of closed containers
is monitoredbyabsorptionorscatteringofradiation.
In the chemical industry radioisotopes are used to
indicate the completeness of a precipitation reaction.
A radioisotope of the element to be precipitated is
added to the solution to be precipitated. When the fil-
trate is freeofradioactivity, precipitation is complete.
Radioisotopes are used in dating ancient rocks and
fossils. Carbon is used in dating fossils. All living or-
ganisms are assumed to be in equilibrium with their
environment, taking in carbon in food and expelling
it throughrespirationandotherprocesses. A living or
-
ganism is assumed, when it dies, to have a certain per
-
centage of carbon 14, radioactive carbon. As the fossil
ages the carbon 14 decays by beta emission, and its
percentage is reduced. Since the decay rate is known,
a reasonable age estimate can be obtained by measur-
ing the rate of radioactive emission (proportional to
percentage carbon 14) from the fossil. Uranium is
used in a similar way to date rock samples that contain
a mixture of uranium and lead, which is at the end of
its decay chain.
Grace A. Banks
Further Reading
Billington, D., G. G. Jayson, and P. J. Maltby. Radioiso-
topes. Oxford, England: BIOS Scientific Publishers
in association with the Biochemical Society, 1992.
Choppin, Gregory R., Jan-Olov Liljenzin, and Jan
Rydberg. Radiochemistry and Nuclear Chemistry.3d
ed. Boston: Butterworth-Heinemann, 2002.
Dragani6, Ivan G., Zorica D. Dragani6, and Jean-Pierre
Adloff. Radiation and Radioactivity on Earth and Be-
yond. 2d ed. Boca Raton, Fla.: CRC Press, 1993.
Ehmann, William D., and Diane E. Vance. Radiochem-
istry and Nuclear Methods of Analysis. New York:
Wiley, 1991.
Faure, Gunter, and Teresa M. Mensing. Isotopes: Princi-
ples and Applications. 3d ed. Hoboken, N.J.: Wiley,
2005.
Henriksen, Thormod. Radiation and Health. New York:
Taylor & Francis, 2003.
Serway, Raymond A., Chris Vuille, and Jerry S.
Faughn. College Physics. 8th ed. Belmont, Calif.:
Brooks/Cole Cengage Learning, 2009.
Thornburn, C. C. Isotopes and Radiation in Biology. New
York: Halstead Press Division, Wiley, 1972.
Tykva, Richard, and Dieter Berg, eds. Man-Made and
638 • Isotopes, radioactive Global Resources
Half-Lives of Some Unstable Isotopes
Used in Dating
Parent Isotope Daughter Product Half-Life Value
Uranium 238 Lead 206 4.5 billion years
Uranium 235 Lead 207 704 million years
Thorium 232 Lead 208 14.0 billion years
Rubidium 87 Strontium 87 48.8 billion years
Potassium 40 Argon 40 1.25 billion years
Samarium 147 Neodymium 143 106 billion years
Source: U.S. Geological Survey.
Natural Radioactivity in Environmental Pollution and
Radiochronology. Boston: Kluwer Academic, 2004.
Umland, Jean B., and Jon M. Bellama. General Chemistry.
3d ed. Belmont,Calif.:Thomson/BrooksCole,1999.
Web Sites
World Nuclear Association
Radioisotopes in Industry
/>default.aspx?id=548&terms=radioisotopes
World Nuclear Association
Radioisotopes in Medicine
/>default.aspx?id=546&terms=radioisotopes
See also: Atomic Energy Commission; Isotopes, sta-
ble; Manhattan Project; Nuclear energy; Nuclear Reg-
ulatory Commission; Plutonium; Radium; Thorium;
Uranium.
Isotopes, stable
Category: Mineral and other nonliving resources
Where Found
Stable isotopes comprise the bulk of the material uni-
verse. Some elements are found in only a single form,
while others have several isotopes. For study and ap-
plication, it is necessary to separate the various iso-
topes from one another. A number of methods have
been developed to accomplish isotope separation.
Primary Uses
Analysis of stable isotopes and isotopic composition is
used extensively in a wide variety of fields. These in-
clude soil and water analysis, plant tissue analysis, de-
termination of metabolic pathways in plants and ani-
mals (including humans), archaeology, forensics, the
geosciences, and medicine.
Technical Definition
An isotope is one of two or more species of atom that
have the same atomic number (number of protons)
but different mass numbers (number of protons plus
neutrons). Stable isotopes are those which are not ra
-
dioactive. Because the chemical properties of an ele
-
ment are almost exclusively determined by atomic
number, different isotopes of the same element will
exhibit nearly identical behavior in chemical reac-
tions. Subtle differences in the physical properties of
isotopes are attributable to their differing masses.
Description, Distribution, and Forms
There are approximately 260 stable isotopes. While
most of the eighty-one stable elements that occur in
nature consist of a mixture of two or more isotopes,
twenty occur in only a single form. Among these are
sodium, aluminum, phosphorus, and gold. At the
other extreme, the element tin exhibits ten isotopic
forms. Two elements with atomic numbers less than
84, technetium and promethium, have no stable iso-
topes. The atomicweight of an element is the weighted
average of its isotope masses as found in their natural
distribution. For example, boron has two stable iso-
topes: boron 10 (an isotope with mass number 10),
which accounts for 20 percent of naturally occurring
boron, and boron 11, which accounts for 80 percent.
The atomic weight of boron is therefore (0.2) ×(10) +
(0.8) × (11) = 10.8. In those elements that have natu-
rally occurringisotopes,the relativeabundance of the
various isotopes is found to be remarkably constant,
independent of the source of the material. There are
cases in which the abundances are found to vary, and
these are of practical interest.
History
In the early part of the twentieth century, the discov-
ery of radioactivity, radioactive elements, and the
many distinctly different products of radioactive de-
cays showed that there were far more atomic species
than could be fit into the periodic table. Although
possessing different physical properties, many of these
species were chemically indistinguishable.
In 1912, Joseph John Thomson, discoverer of the
electron, found that when a beam of ionized neon gas
was passed through a properly configured electro-
magnetic field and allowed to fall on a photographic
plate, two spots of unequal size were exposed. The size
and location of the spots were those that would be ex-
pected if the original neon consisted of two compo-
nents—about 90 percent neon 20 and 10 percent
neon 22. Later Francis William Aston improved the
experimental apparatus so that each isotope was fo-
cused to a point rather than smeared out. The device
he developed, known as a mass spectrograph, allows
much greater precision in the determination of iso
-
tope mass and abundance.
Global Resources Isotopes, stable • 639
Obtaining Isotopes
All methods for separating stable isotopes are based
on mass difference or on some isotopic property that
derives from it. The difficulty of isotope separation
depends inversely upon the relative mass difference
between the isotopes. For example, the two most
abundant isotopes of hydrogen are ordinary hydrogen
(hydrogen 1) and deuterium (hydrogen 2). These iso-
topes have a relative mass difference of (2-1)/1 = 1, or
100 percent. The mass difference between chlorine 35
and chlorine 37, by contrast, is only (37-35)/35 = 0.057,
or 5.7 percent.
There are two types of separation methods. The
only single-step method is electromagnetic separa-
tion, which operates on the principle that the curva-
ture of the path of a charged particle in a magnetic
field is dependent on the particle mass. This is the
same principle on which the mass spectrograph is
based. Though it is a single-step technique, the amount
of material that can be separated in this way is ex-
tremely small. All other processes result in a separa-
tion of the original material into two fractions, one
slightly enriched in the heavier isotope. To obtain sig-
nificant enrichment the process must be repeated a
number of times by cascading identical stages. Such
multistage methods include gaseous centrifugation,
aerodynamic separation nozzles, fractional distilla-
tion, thermal diffusion, gaseous diffusion, electroly-
sis, and laser photochemicalseparation.For example,
in centrifugation a vapor of the material to be sepa-
rated flows downward in the outer part of a rotating
cylinder and upward in the center. Because of the
mass difference, the heavier isotope will be concen-
trated in the outer region and can be removed to be
enriched again in the next stage.
Uses of Stable Isotopes
Most stable isotope applications are based on two
facts. First, isotopes of a given element behave nearly
identically in chemical reactions. Second, the relative
abundances of isotopes for a given element are nearly
constant. The three principal types of applications are
those in which deviations from the standard abun-
dances are used to infer somethingaboutthe environ-
ment and/or historyofthesample,those in which the
isotopic ratio of a substance is altered so that the sub-
stance may be traced through a system or process, and
those in which small differences in the physical prop
-
erties of isotopes are used to understand process dy
-
namics.
As an example of the first type of application, con
-
sider that the precise isotopic composition of water
varies with place and time as it makes its way through
the Earth’s complex hydrologic cycle. Knowledge of
this variation allows for the study of storm behavior,
identification of changes in global climatic patterns,
and investigation of past climatic conditions through
the study of water locked in glaciers, tree rings, and
pack ice. The cycling of nitrogen in crop plants pro-
vides an example of stable isotope tracer methods.
Fertilizer tagged by enriching (or depleting) with ni-
trogen-15 is applied to a crop planting. Subsequent
analysis makes it possible to trace the quantities of fer-
tilizer taken up by the plants, remaining in the soil,
lost to the atmosphere by denitrification, and leached
into runoff water.
Michael K. Rulison
Further Reading
Asimov, Isaac. The History of Physics. New York: Walker,
1984.
Bransden, B. H., and C. J. Joachain. Physics of Atoms
and Molecules. 2ded.NewYork: Prentice Hall, 2003.
Clayton, Donald D. Handbook of Isotopes in the Cosmos:
Hydrogen to Gallium. New York: Cambridge Univer-
sity Press, 2003.
Ehleringer, James R., and Thure E. Cerling. “Stable
Isotopes.” In The Earth System: Biological and Ecologi-
cal Dimensions of Global Environmental Change,ed-
ited by Harold A. Mooney and Joseph G. Canadell.
Vol. 2 in Encyclopedia of Global Environmental Change.
New York: Wiley, 2002.
Fry, Brian. Stable Isotope Ecology. New York: Springer,
2006.
Hobson, Keith A., and Leonard I. Wassenaar, eds.
Tracking Animal Migration with Stable Isotopes.Am-
sterdam: Academic Press, 2008.
National Research Council. Separated Isotopes: Vital
Tools for Science and Medicine. Washington, D.C.:
National Academy Press, available from Office of
Chemistry and Chemical Technology, National Re-
search Council, 1982.
Web Site
Northern Arizona University, Colorado
Plateau Stable Isotope Laboratory
What Are Stable Isotopes?
/>isotope.html
640 • Isotopes, stable Global Resources
See also: Biotechnology; Hydrology and the hydro
-
logic cycle; Isotopes, radioactive; Nitrogen cycle; Nu-
clear energy; Soil testing and analysis.
Italy
Categories: Countries; government and resources
Italy is one of the world’s leading producers of wine, ol-
ive oil, and cheese. Olive trees and vineyards can be
found throughout the country. The town of Carrara is
world famous for the quality of its marble deposits.
The Country
A founding member of the European Union, Italy be-
came a nation-state in 1861 and a republic in 1946. It-
aly is a peninsula that extendsinto the Mediterranean
Sea in southern Europe. The country comprises a
boot-shaped mainland, the islands of Sicily and Sar-
dinia, and several smaller islands. Italy shares borders
with Austria, Switzerland, France, San Marino, and
Slovenia. Natural threats to the nation include earth-
quakes, volcanic eruptions,mudslides,andavalanches,
along with land subsidence in Venice. Three-quarters
of the country is mountainous; the Alps stretch across
the northern region, and the Apennines run south-
ward along the peninsula. The southern area of the
country has four active volcanoes, including Mount
Vesuvius and Mount Etna. In 2008, Italy’s economy
was the fourth largest in Europe and seventh world-
wide. The country is known for its cuisine, wine,
cheese, olive oil, and marble. Italy has played a large
role in European and global history. Home to Etrus-
cans and later the Romans, Italy has been influential
in the fields of architecture, literature, painting, sculp-
ture, science, education, government, philosophy, mu-
sic, and fashion.
Olive Oil
Italy is one of the top-two leading producers of olive
oil in the world. Fossils of olive trees have been found
in Italy dating back 20 million years. The culture of
producing olive oil, however, did not emerge in the
area until much later. The spread of theGreek empire
brought olives to southern Italy in the eighth century
b.c.e. The Romans planted olive trees throughout
the Mediterranean region. Ancient historians wrote
about Italian olive oil as being reasonably priced and
the best in the Mediterranean. Olive oil was a main
ingredient in various ointments and was believed to
increase strength and youthfulness. Leading produc-
ers of extra virgin olive oil are the regions of Liguria,
Tuscany, Umbria, and Apulia. One-third of Italy’s
olive oil trees are in the Apulia region. The taste
and quality of the oil is affected by the type of olives,
climate and conditions where they are grown, the
method of harvest, and the production process.
The Italian government strictly controls the extra
virgin olive oil industry; in order to earn the distinc-
tion of extra virgin the oil must have an acidity level of
less than 1 percent. In 1998, the United States im-
ported 131 million liters of olive oil from Italy. Olive
oil from Italy is among the highest priced and most in
demand. This has led companies to mix lower quality
oil with Italian oil in order to produce a cheaper prod-
uct. The oil is then labeled as being imported from It-
aly. In March, 2008, the Italian government arrested
twenty-three people and shut down eighty-five farms
involved in schemes to sell counterfeit Italian olive
oil. The following month, the government arrested
forty people who were adding chlorophyll to sun-
flower and soybean oils. The oil was then sold through-
outItaly and around the world as extra virgin olive oil.
Twenty-five thousand liters of the counterfeit oil were
confiscated before it could be exported.
Marble
Carrara, located in the Apuan Alps in northwestern
Tuscany, isthe marble capital of Italy. It produces one-
third of all the marble quarried in Italy. The area was
first mined by the Romans, who used slaves and con-
victs to extract the rock. They would insert damp
wooden wedges into existing cracking in the rock
face; the wood would then expand, loosening the
marble. In 1570, gunpowder was first used in Carrara
to extract marble from the mountainside. Explosives
drastically changed the landscape of the area as more
quarriesopenedandlargerchunksofmarblewereex-
tracted. A hydroelectric plant was built nearby in
1910, which allowed the quarries to use electricity for
the first time. This technology is used in the nearly
three hundred active marble quarries in Carrara.
Several varieties of marble are mined in the area,
including the uncommonly white, flawless marble for
which the town is famous. The port of Marina di Car-
rara is one of the most famous in Italy and is known
worldwide for loading and unloading marble and
granite. During the early sixteenth century, sculptor
Global Resources Italy • 641
642 • Italy Global Resources
Italy: Resources at a Glance
Official name: Italian Republic
Government: Republic
Capital city: Rome
Area: 116,314 mi
2
; 301,340 km
2
Population (2009 est.): 58,126,212
Language: Italian
Monetary unit: euro (EUR)
Economic summary:
GDP composition by sector (2008 est.): agriculture, 2%; industry, 27%; services, 71%
Natural resources: coal, mercury, zinc, potash, marble, barite, asbestos, pumice, fluorspar, feldspar, pyrite (sulfur),
natural gas and crude oil reserves, fish, arable land
Land use (2005): arable land, 26.41%; permanent crops, 9.09%; other, 64.5%
Industries: tourism, machinery, iron and steel, chemicals, food processing, textiles, motor vehicles, clothing,
footwear, ceramics
Agricultural products: fruits, vegetables, grapes, potatoes, sugar beets, soybeans, grain, olives, beef, dairy products,
fish
Exports (2008 est.): $546.9 billion
Commodities exported: engineering products, textiles and clothing, production machinery, motor vehicles, transport
equipment, chemicals, food, beverages and tobacco, minerals and nonferrous metals
Imports (2008 est.): $546.9 billion
Commodities imported: engineering products, chemicals, transport equipment, energy products, minerals and
nonferrous metals, textiles and clothing, food, beverages, and tobacco
Labor force (2008 est.): 25.11 million
Labor force by occupation (2005): agriculture, 4.2%; industry, 30.7%; services, 65.1%
Energy resources:
Electricity production (2007 est.): 292.1 billion kWh
Electricity consumption (2006 est.): 316.3 billion kWh
Electricity exports (2007 est.): 1.916 billion kWh
Electricity imports (2007 est.): 34.56 billion kWh
Natural gas production (2007 est.): 9.706 billion m
3
Natural gas consumption (2007 est.): 84.89 billion m
3
Natural gas exports (2007 est.): 68 million m
3
Natural gas imports (2007 est.): 73.95 billion m
3
Natural gas proved reserves ( Jan. 2008 est.): 94.15 billion m
3
Oil production (2007 est.): 166,600 bbl/day
Oil imports (2005): 2.223 million bbl/day
Oil proved reserves ( Jan. 2008 est.): 406.5 million bbl
Source: Data from The World Factbook 2009. Washington, D.C.: Central Intelligence Agency, 2009.
Notes: Data are the most recent tracked by the CIA. Values are given in U.S. dollars. Abbreviations: bbl/day = barrels per day;
GDP = gross domestic product; km
2
= square kilometers; kWh = kilowatt-hours; m
3
= cubic meters; mi
2
= square miles.
Rome
Italy
Austria
France
Hungary
Greece
Albania
Yugoslavia
Bosnia
Croatia
Slovenia
Switzerland
Algeria
Tunisia
Adriatic Sea
Ionian
Sea
Mediterranean Sea
Tyrrhenian
Sea
Michelangelo (1475-1564) traveled often to the quar
-
ries to pick out marble for his projects, including Da-
vid. Carrara marble was used to build the Pantheon,
Trajan’s Column in Rome, the Marble Arch in Lon-
don, and the Cathedral of Siena. The stone is also used
as a facade for buildings worldwide. Carrara is home
to many fairs that celebrate marble and quarrying. In
1982, the town opened the Marble Museum of Carrara
to preserve the history of marble and the marble indus-
try in the area. The museum has several sections, in-
cluding archaeological relics, drawings, photographs,
plaster casts, sculptures, and industrialartwork. It also
tells the history of marble quarrying and has machin-
ery, technical diagrams, and photographs. The gal-
lery contains more than three hundred samples of
marble, granite, and rock from Italy and elsewhere.
Feldspar
Feldspar is a group of minerals that compose up to 60
percent of the Earth’s crust. The mineral can be
found as crystals in granite or other igneous rock, in
sedimentary rocks, in metamorphic rocks, or in veins.
Feldspars are often pink, white, gray, or brown. The
color varies with the chemical composition of the
mineral. Feldspars are used in glassmaking, tile, ce-
ramics, abrasive cleaners, and many other products.
Italy was the leading feldspar producer throughout
the 1990’s, vastly outmining the rest of the world. By
1998, Italy was producing almost 2.1 million metric
tons of feldspar. At that time, Italy’s tile industry was
among the top in the world, and the ceramics indus-
try was among the leaders in Europe.
The Maffei Sarda company began mining feldspar
in northern Sardinia in 1989. In the late 1990’s, the
company began producing a soda-potash feldspar that
is unusually white in color and has been used to make
bone china. At the time, another mining company de-
veloped a process to extractfeldsparfrom granite that
it recovered from a mining dump in Italy’s Lake
Maggiore region. Italy’s yearly production of feldspar
continues to increase; in 2008, the country mined 4.2
million metric tons. In 2008, Italy continued to be the
top producer of feldspar, followed by Turkey, China,
and Thailand. That year, Italian feldspar accounted
for almost one-quarter of the total worldproduction.
Metal and Mineral Resources
Italy mines a variety of metals, including copper, lead,
zinc, gold, and mercury. The majority of mining com
-
panies and mines are government controlled. Some
privatization of the industry began during the 1990’s.
During the 1970’s, Italy was a leading producer of py-
rites, fluorite, salt, and asbestos. The country also
mined enough zinc, sulfur, lead, and aluminum to
meet its own demand. However, less than two decades
later, Italy had drastically depleted these resources
and was no longer self-sufficient.
One-half of the country’s iron production is from
Elba Island. The last iron cave was closed there in
1981. The island is also home to the Mining Museum.
The museum has more than one thousand rocks and
minerals on display and allows visitors to tour a mine.
The majority of Italy’s metals are found on its islands;
the decline of mining and depletion of the deposits
have severely impacted their economies.
The world’s second largest mercury mine is lo-
cated in Idrija, Slovenia. The region has been con-
trolled by a number of different European nations; it
was controlled by Italy between World Wars I and II.
The Idrija mine was in operation by the time Christo-
pher Columbus set sail for the West Indies in 1492.
Mercury was first exported through Venice, followed
by Amsterdam in 1659. After more than five hundred
years in operation, theminewas shut down because of
declining mercuryore prices. Mercuryis still found in
the Lake Maggiore region of Italy.
Coal
The island of Sardinia has a long history of coal min-
ing. During the fascist period, a large number of the
island’s swamplands were drained to produce farm-
able land. Several agrarian communities began to
form in these areas. At this time, the city of Carbonia
was also established, which became the mining center
of Sardinia. Tourism increased on the island by the
early 1950’s, which led to a decrease in coal mining.
By 2007, the Miniera Monte Sinni mine, located in the
Sulcis basin in southwestern Sardinia, was the only ac-
tive underground coal mine in Italy. It produced on
average only 90,000 metric tons of coal each year. Italy,
however, has largecoal reserves: an estimated544mil-
lion metric tons, of which 30.8 million metric tons are
minable, according to a 2007 study. A 2003 estimate
placed the country’s reserves at more than 900 mil-
lion metric tons. The study also estimated that the
Sulcis basin had produced 72.6 million metric tons of
coal. Production of lignite from Italy’s only lignite
mine declined drastically between 1998(141,500 met
-
ric tons) and 2002 (9,000 metric tons). The Tuscan
mine was shut down in 2003.
Global Resources Italy • 643
Italy was fourth among energy consumption in Eu
-
ropean countries. This growing demand for power
sources has increased Italy’sdependenceoncoal.The
use of coal has met some political opposition but is
aided by advances in the “clean coal” industry. In
2008, Italy’s largest power company, Enel, converteda
large power plant from oil tocoal.The plant is located
northwest of Rome, in Civitavecchia. The company
defends this move as a means to lower costs; fuel costs
have risen 151 percent since 1996. Italy has the high-
est electricity prices in Europe. The country plans to
produce 33 percent of its power from coal, more than
double the 14 percent it produced prior to 2008.
Wine
The Etruscans, who were located in what is now north-
ern Italy, and the Greek colonists to the south began
Italy’slong history withwinemaking.After taking con-
trol of the area, the Romans started their own vine-
yards. Winemaking in the Roman Empire was a large
enterprise and pioneered mass production storage
methods like barrel making and bottling. The Ro-
mans operated several vineyard plantations manned
with slave labor on much of the coastal area of the re-
gion. The plantations were so extensive that in 92 c.e.
the emperor had to shut down a number of them in
order to use the land for food production.
Today, Italy is one of the two leading wine produc-
ers in the world. In 2005, Italian wine accounted for
20 percent of the world’s wine. The United States im-
ported nearly one-third of the total from Italy (36 per-
cent by dollar value). Italy produces wines of many
flavors, colors, and styles. There are approximately
one million vineyards throughout modern Italy. The
country has twenty wine regions, which are also its po-
litical districts. The economy of the Apulia region is
based primarily on wine, with 106,712 hectares of
grapes and a yearly output of approximately 723.7
million liters of wine. The islands of Sardinia and Sic-
ily are also major wine producers. Tuscany is famous
for its red wines. About 70 percent of the 216 million
liters produced there each year are red wines. The re-
gion has more than 63,537 hectares of vineyards.
Starting in 1968, winemakers began producing “super
Tuscans,” wines that are not mixed according to the
traditional blending laws of the area. During the
1970’s, Tignanello became one of the first super Tus-
cans by eliminating the white grapes from a recipe for
chianti. Piero Antinori replaced them with red Bor
-
deaux grapes in order to produce a richer wine. The
new wines do not fit into any of the four traditional
categories in which Italian wine is classified. However,
winemakers throughout the country continue to ex-
periment and create new wines.
Fish
Even though the majority of fish and seafood con-
sumed in Italy is imported, fish production in the
country has risen since the 1960’s. During the mid-
1980’stheEuropean Union passed the Common Fish-
eries Policy. The policy is designed to eliminate over-
fishing and maintain a competitive fish and seafood
industry within Europe. In 2002, a European Union
commission reduced the catch limits on the number
of cod and other species of fish that had dwindling
numbers. In 2004, subsidies for fisherman to help
procure new vessels were eliminated. Because of this,
the number of Italian fishing ships has decreased,
leaving mostly small-scale fishing operations. In 2003,
Italian fishermen caught 26 percent less fish than the
previous year. The northern region of Italy houses 62
percent of the country’s fish farms; 22 percent are
found in central Italy, and 16 percent in the southern
region. These fisheries produced $405 million worth
of fish in 2003. Canada is a large importer of fish to It-
aly, but retailers face atough obstacle: Italian consum-
ers are used to purchasing fresh goods, not canned or
frozen. These companies may be added by the grow-
ing demand for value and the convenience of ready-
made food.
Other Resources
In addition to olives and grapes, Italy is famous world-
wide for its cheeses. The country produces more than
four hundred different varieties of cheese. In 2008,
the government purchased 200,000 wheels of cheese
(29.9 kilograms each) to help feed the poor, as food
lines and the number of needy grew in the major cit-
ies. Italy is also a major exporter of rice and tomatoes.
During the late twentieth century, tomato farms dou-
bled in size,andproductionquadrupled. Northern It-
aly grows three times the amount of wheat as the
southern regions, which is used to make pizza crusts
and pasta. The country consumes a large portion of
the agricultural products that it produces. Eighty per-
cent of Italy’s citrus fruit is grown in Sicily. Italy is also
a leading producer of apples, oranges, lemons, pears,
and other fruits as well as flowers and vegetables.
Potash can be various chemical compounds, mostly
potassium carbonate. Potassium oxide potash is used
644 • Italy Global Resources
in fertilizer. The town of Agrigento in southern Sicily
has an economy that is largely based on potash and
sulfur mining. The nearby harbor is Italy’s principal
sulfur port.
Jennifer L. Campbell
Further Reading
Clark, Martin. Modern Italy: 1871 to the Present. New
York: Pearson Longman, 2008.
Davis, John Anthony. Italy in the Nineteenth Century,
1796-1900. New York: Oxford University Press,
2001.
Duggan, Christopher. A Concise History of Italy.Up-
dated ed. New York: Cambridge University Press,
2006.
Knickerbocker, Peggy. Olive Oil: From Tree to Table. San
Francisco: Chronicle Books, 2007.
Leivick, Joel. Carrara: The Marble Quarries of Tuscany.
Palo Alto, Calif.: Stanford University Press, 1999.
Lintner, Valerio. A Traveler’s History of Italy. 8th ed.
Northampton, Mass.: Interlink, 2008.
Romaneili, Leonardo. Olive Oil: An Italian Pantry. San
Francisco: Wine Appreciation Guild, 2003.
Scigliano, Eric. Michelangelo’s Mountain: The Quest for
Perfection in the Marble Quarries of Carrara. New York:
Free Press, 2005.
See also: Agricultural products; Agriculture indus-
try; Coal; Feldspars; Fisheries; Marble; Potash; Wheat.
Ivory
Category: Plant and animal resources
Where Found
Ivory is obtained from the large teeth and tusks of sev-
eral mammals, including the elephant, hippopota-
mus, walrus, extinct wooly mammoth, and narwhal.
In these animals, an upper incisor grows throughout
life into a largetusk. In elephants, for example,the av-
erage tusk weighs 7 kilograms, but in large males the
weight might be much more. A major factor endan-
gering the continued existence of these extant mam-
mals has been the value of their ivory.
Primary Uses
Ivory hasbeenusedbyhumansforthousands of years,
often as a medium for carving. The art of scrimshaw
makes use of ivory, and many other ornamental ob
-
jects are carved from ivory. In the past, most ivory was
used in the manufacture of piano keys, but billiard
balls, bagpipes, flatware handles, and furniture inlays
were other products made from ivory. Today, most
ivory is used for the Chinese, Japanese, and Korean
seals known as hankos; these small seals are used on of-
ficial business documents.
Technical Definition
Ivory isthehardened dentine of the teeth and tusksof
certain large mammals. In both male and female ele-
phants, one incisor on each side of the upper jaw
grows throughout life. In females, growth of the tusks
tends to slow after age thirty, but in males both the
length and bulk of the tusks increase through the life
span, thus making old male elephants prime targets
for ivory poachers. In walruses, the tusks form from
upper canines and grow throughoutlifeinbothsexes.
Narwhals have only two teeth, both in the upper jaw;
these lengthen to become long, straight tusks, usually
only one in males and sometimes two in females. Hip-
popotamuses have tusks of ivory that do not yellow
with age, as elephant tusks tend to do.
Description, Distribution, and Forms
Both the Asiatic elephant, Elephas maximus, and the
African elephant, Loxodonta africana, have been ex-
tensively exploited for the ivory in their tusks. Asiatic
elephants are now restricted in range to southern
Asia, although historically they had a much larger dis-
tribution, from Syria to northern China and south to
Sri Lanka, Sumatra, and perhaps Java. According
to 2008 population estimates, only 34,000 to 54,000
wild Asiatic elephants remain throughout the present
range of the species. Approximately 17,000 to 23,000
are found on the Indian subcontinent, 11,000 to
20,000 in continental Southeast Asia, and 6,000 to
11,000 in Sri Lanka, Sumatra, and Borneo.
The African elephant includes two major kinds,
which some experts consider subspecies: the forest
elephant, Loxodonta africana cyclotis, of west and cen-
tral Africa, and the savanna or bush elephant, Loxo-
donta africana africana, of the savanna areas of sub-
Saharan Africa. Intense pressure from both legal and
illegal ivory hunters caused the entire African ele-
phant population to fall from around 1.3 million in
1979 to 625,000 in 1989. More recent estimates place
the population throughout Africa to be no more than
500,000. In 1990, the United Nations Convention on
Global Resources Ivory • 645
Trade in Endangered Species of Wild Fauna and
Flora (CITES) put a ban on the international trade of
ivory, and this slowed to some extent the killing of ele-
phants.
A now-extinct relative of the elephant, the woolly
mammoth, Mammuthus primigenius, once ranged
throughout the cold, northern areas of Asia and por-
tions of North America. Globalclimatechangehas ex-
posed the bodies of many mammoths and their tusks
have been gathered, mostly by Russian workers, as a
source of ivory.
The walrus, Odobenus rosmarus, occurs in coastal ar-
eas of the Arctic Ocean and adjoining seas. This spe-
cies has been heavily exploited for the ivory of its large
upper canines, which may be more than 100 centime-
ters long in males and about 80 centimeters in fe-
males. Biologists are concerned that with the decline
of the African elephant population as a source of
ivory, poachers will turn to the killing of walruses.
Narwhals, Monodon monoceros, are found in the Arc-
tic Ocean and nearby seas, primarily between 70° and
80° north latitude. Their normal range is entirely
above the Arctic Circle. Narwhals have two upper-jaw
teeth; in males, one of these remains embedded while
the other erupts and grows in a spiral pattern to form
a long, straight tusk. This tusk may be about one-third
to one-half of the animal’s total body length, some-
times becoming as long as 300 centimeters with a
weight of 10 kilograms. Occasionally, one or two tusks
are grown by a female narwhal. Most researchers be-
lieve that the narwhal uses the tusk as a defensive
weapon, because extensive scarring is often found on
the heads of males.
The hippopotamus, Hippopotamus amphibius,oc-
curs throughout Africa in suitable waterways south of
the Sahara Desert and also in the Nile River to its
delta. It has disappeared throughout most of western
and southern Africa,partiallybecauseitiskilledforits
ivory tusks. Some of the lower canine tusks of male
hippos are just as large as many elephant tusks enter-
ing the ivory market, causing the hippo to be a target
for illegal trafficking in ivory.
History
The trade in ivory is thought to date to the time of
Cro-Magnon man, approximatelythirty-five thousand
years ago. The Asiatic elephant has been ex-
ploited for ivory for at least four thousand
years; upper classes in both Asia and the Mid-
dle East greatly desired items made of ivory.
Ivory demand in Europe in the 1600’s drove
the killing of many thousands of elephants
around the Cape of Good Hope. From 1860 to
1930, 25,000 to 100,000 elephants were killed
each year for the ivory trade, mostly to obtain
material for piano key manufacture. By the
early nineteenth century, the ivory-carving in-
dustry in India was being supported by im-
ported African elephanttusks,as the Asiatic el-
ephants had already been seriously depleted.
The overall number of elephants in Africa in
the early 1900’s was still several million and re-
mained so until after World War II.
The mid-twentieth century had a lag in
commercial ivory hunting, but in the 1970’s
hunting resumed in earnest as the raw ivory
price increased from five to one hundred dol-
lars per kilogram. The African elephant was
placed on appendix 2 of CITES in 1979, listed
as vulnerable by the International Union for
Conservation of Nature, and listed as threat
-
ened by the United States Department of the
Interior. However, these listings did little to
646 • Ivory Global Resources
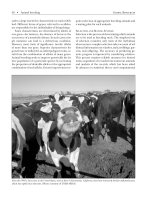
This Asian elephant displays tusks of ivory that are 2.5 meters long. The il
-
licit ivory trade is an endangerment to elephants. (©iStockphoto.com)
prevent poaching, and the African elephant popula
-
tion plummeted to 600,000 by 1997. In 1990, CITES
banned the international trade of ivory, but in 1997,
the convention approved the sale of more than 54
metric tons of ivory from Botswana, Namibia, and
Zimbabwe. This stockpiled ivory was sold to Japan.
CITES reinstated a trade ban againin2000, then once
more allowed an exception in 2002 for Botswana, Na-
mibia, and South Africa. In 2004, Namibia’s proposal
to allow tourist trade in ivory carvings was approved;
many conservationists believe that CITES’ imposing
and then temporarily lifting ivory bans has encour-
aged poaching in the African countries where larger
populations of elephants still exist. In 2007, in re-
sponse to public pressure on the ivory trade issue,
eBay banned all international sales of elephant ivory
products and in 2009 disallowed any sales of ivory by
users of its Web site.
China’s growing economy has driven illegal trade
in ivory as well as attracted organized crime related to
its sale. A kilogram of ivory brings about $750. Esti-
mated illegal shipments to China total approximately
218 metric tons, an amount that would cause the
deaths of at least 23,000 elephants.
One tool available to conservation law enforce-
ment is DNA testing. A genetic test developed by Sam-
uel Wasser of the University of Washington helps to
track illegal shipments to their source. For example,
an extremely large illegal shipment of 532 tusks and
42,000 hankos was seized in Singapore in 2002. Ge-
netic testing traced this ivory to Zambia, and the tusks
in the shipment weighed approximately 11 kilograms
each, indicating that they came from old elephants.
Obtaining Ivory
Generally, ivory is obtained by the killing of the ani-
mals that possess ivory teeth and tusks. As mentioned
above, these include elephants, hippopotamuses, nar-
whals, and walruses.
Mammoth ivory is obtained primarily in Russia by
those who find recently thawed mammoth carcasses.
Because of global climate change, this has become a
more common occurrence. Mammoth ivory has been
used by Russian merchants in the manufacture of
items to sell to Asia. About 90 percent of mammoth
ivory exported to Asia is used to make hankos for Chi-
nese, Japanese, and Korean markets. This ivory, be-
cause it comes fromanextinctmammal,canbelegally
imported into the United States. More than 46 metric
tons were imported in 2007. Dealers in Moscow re
-
port that they can sell mammoth ivory for three hun
-
dred to four hundred dollars per kilogram in Russia;
in western markets it sells for up to sixteen hundred
dollars per kilogram.
Native subsistence hunting of walruses, by har-
pooning or clubbing, has been occurring for thou-
sands of years and probably had little negative impact
on populations of the species. However, with the
hunting of walrusesbyEuropeansforivory, hides, and
oil, beginning in the sixteenth century, numbers of
the animals on both sides of the North Atlantic de-
clined dramatically. The last large populations in the
Canadian Arctic were gone by the 1930’s, and only
about 25,000 of the Atlantic population remain. Re-
cent surveys of the Pacific population indicate that
some 200,000 walruses are present, but there is con-
siderable concern among biologists that ivory de-
mand in Asia will drive poaching of theremaining ani-
mals.
Hippopotamuses have been extensively killed for
hundreds of years for meat, hides, and ivory. As popu-
lations of African elephants have steadily declined,
there has been increased pressure on hippos for their
ivory. The lower canine tusks of males are often as
large as elephant tusks now entering the illegal mar-
ket, and a sharp rise in the export of hippo ivory coin-
cided with the placing of the African elephant under
the more protective listing of appendix 1 of CITES.
The Vikings were probably the first culture to ex-
ploit the narwhal extensively for its tusk, which sold
for high prices as early as the tenth century. The tusks
were also in great demand in Asia, where they were
used for carving and as medicine. During the late
1900’s, narwhal tusks were sold for as much as forty-
five hundred dollars. The annual kill of narwhals in
Canadian waters isestimated to be approximately one
thousand. The species has received little firm protec-
tion from any conservation law.
Uses of Ivory
For many years, the use of ivory centered around dec-
orative items, such as carved figurines and various
gewgaws, primarily for customers in Europe, Asia, and
the United States. The manufacture of ivory piano
keys and billiard balls was a major factor in the demise
of both Asiatic and African elephants. Estimates indi-
cated that consumption of ivory—for the making of
piano keys—in Great Britain in 1831 accounted for
the deaths of four thousand elephants. More modern
uses of ivory have been for flatware, jewelry, and furni
-
Global Resources Ivory • 647