A New Ecology - Systems Perspective - Chapter 9 potx
Bạn đang xem bản rút gọn của tài liệu. Xem và tải ngay bản đầy đủ của tài liệu tại đây (771.43 KB, 44 trang )
9
Ecosystem principles have
applications
Tempus item per se non est, sed rebus ab ipsis
consequitur sensus, transactum quid sit in aevo,
tumquae res instet, quid porro deinde sequantur.
Time per se does not exist: the sense of what
has been done in the past, what is in the present
and what will be is embodied in things themselves.
(Lucretius, De Rerum Natura, I, 459–461)
9.1 INTRODUCTION
Orientors, being holistic ecological indicators, can give further information on the state
of an ecosystem than can simply reductionistic indicators. Information coming from
systematic or analytical approaches should never be neglected but holistic indicators
allow us to understand if the system under study is globally following a path that takes
the system to a “better” or to a “worse” state. And, we can also compare macroscopic
state of different systems, which is impossible to do with isolated reductionistic infor-
mation. So, advantages of holistic indicators are: additional aggregate information with-
out losing information; ability to compare; ability to compare states of the same system
at different times; and possibility of understanding what new data types are needed for
this approach.
With indicator concepts like ecosystem health, ecosystem integrity can find opera-
tional values, using information coming from approaches like network analysis, eco-
exergy, ascendency, emergy evaluation, and the other related indicators. Here, we present
several examples in which the systems perspective in ecology has been applied. The types
and locations of systems in which they have been applied are very diverse: terrestrial and
aquatic ecosystems in Europe, North and South America, and Asia, as are the goals of the
research and management questions involved. Regardless of the setting or objective, at
its core, holistic indicators always give a broader understanding of the amalgamation of
the ecosystem parts into a context of the whole.
199
Else_SP-Jorgensen_ch009.qxd 4/18/2007 11:44 Page 199
200
A New Ecology: Systems Perspective
9.2 ENTROPY PRODUCTION AS AN INDICATOR OF ECOSYSTEM
TROPHIC STATE
References from which these applications of entropy production are extracted:
Aoki I. 1987. Entropy balance in lake Biwa. Ecol. Model. 37, 235–248.
Aoki I. 1995. Entropy production in living systems: from organisms to ecosystems.
Thermochim. Acta 250, 359–370.
Aoki I. 2000. Entropy and Exergy principles in living systems. Thermodynamics and
Ecological Modelling, Lewis Publishers, New York, NY, pp. 165–190.
Ludovisi A, Poletti A. 2003. Use of thermodynamic indices as ecological indicators of
the development state of lake ecosystems. 1. Entropy production indices. Ecol.
Model. 159, 203–222.
Entropy flow and entropy production (see Chapter 2) can be quantitatively estimated
using physical modelling or calculated from observed energy flow data of biological sys-
tems. Here entropy production in lake ecosystems is examined in detail for three ecosys-
tems located in Japan, USA, and Italy.
Case studies
Lake Biwa is located at 34Њ58Ј–35Њ3Ј N, 135Њ52Ј–136Њ17Ј E (near Kyoto, Japan) and
consists of a northern basin (the main part) and a southern basin (the smaller part). The for-
mer is oligotrophic and the latter is nearly eutrophic. Only the northern basin is considered.
Data for this study were collected in 1970s. The annual adsorbed solar energy was 4153MJ
while the mean depth of the lake is 44m. It is possible to identify two zones in the column
water: a light one (Ͻ20m) and a dark one (between 20m and 24m). The average amount
of suspended solid (SS) in the light zone was 1.3 [gm
Ϫ3
J] (National Institute for Research
Advancement, 1984) while the average amount of dissolved organic carbon (DOC) was 1.6
[gC m
Ϫ3
] (Mitamura and Sijo, 1981). The average amount of total plankton plus zooben-
thos in the whole water column was 0.16 [gC m
Ϫ3
] (Sakamoto, 1975).
Lake Mendota is located at 43Њ04Ј N, 89Њ24Ј W (near Madison, Wisconsin, USA) and
is a eutrophic lake. Its energy budget was investigated by Dutton and Bryson (1962) and
Stewart (1973). The annual adsorbed solar energy was 4494 MJ while the mean depth of
the lake is 12.2m. Two zones of the water column were identified: the euphotic one (until
9m) and the aphotic one (the last 3.2m). The average amount of SS in the light zone was
1.9 [gm
Ϫ3
] (National Institute for Research Advancement, 1984) while the average
amount of DOC was 3.3 [gC m
Ϫ3
J] (Brock, 1985). The average amount of total plankton
plus zoobenthos in the whole water column was 0.62 [gC m
Ϫ3
] (Brock, 1985).
Lake Trasimeno is the largest lake in peninsular Italy (area 124km
2
); it is shallow
(mean depth 4.7m, maximum 6.3m), and accumulation processes are favored. The
water level of the lake showed strong fluctuations with respect to meteorological condi-
tions; hydrological crises occur after several years with annual rainfall Ͻ700 mm. Lake
Trasimeno can be considered homogeneous for chemical and physical parameters
(Maru, 1994) and very sensitive to meteorological variability or human impact.
According to the Vollenweider–OECD classification (Giovanardi et al., 1995), Lake
Trasimeno is mesotrophic, whereas by using the annual phosphorus loading estimation
Else_SP-Jorgensen_ch009.qxd 4/18/2007 11:44 Page 200
method (Maru, 1994) and the Hillbrich–Ilkowska method (Hamza et al., 1995), the lake
is classified as eutrophic.
Entropy production indices for waterbodies
The quantities necessary to estimate entropy production (see Aoki, 1989, 1990) can be
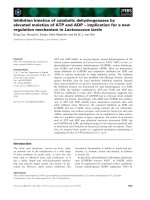
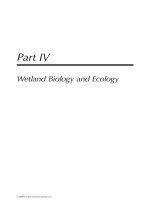
obtained from experimentally observed data. Entropy production plotted against
adsorbed solar radiation energy for Lake Biwa and Lake Mendota are shown in
Figures 9.1 and 9.2, respectively. The monthly entropy production per unit of volume (S
p
)
of the Trasimeno Lake was calculated by simple division of entropy production per sur-
face units (S
prod
) by monthly mean values of water depth; the annual values were calcu-
lated as the sum of monthly values and are given in Table 9.1.
Entropy production is expressed in MJm
Ϫ2
month
Ϫ1
K
Ϫ1
, while solar radiation in MJ
m
Ϫ2
month
Ϫ1
. According to Aoki, entropy production in month j (denoted as (⌬
i
S )
j
) is a
linear function of the absorbed solar radiation energy in month j (denoted as Q
j
):
(9.1)
According to Ludovisi (2003) the definition of the b index as a ratio of S
p
(in units
MJm
Ϫ3
year
Ϫ1
K
Ϫ1
) and the solar energy absorbed by the lake surface (Q
s
) (MJm
Ϫ2
per year
K
Ϫ1
) in a year is not proper, because entropy and energy flows do not refer to the same
()
ij j
SabQϭϩ
Chapter 9: Ecosystem principles have applications
201
Lake Biwa (northern basin)
0.0
1.0
2.0
0 200 400 600
Absorbed solar energy/ [MJ m
-2
month
-1
]
Entropy production/ [MJ m
-2
month
-1
K
-1
]
Figure 9.1 Monthly entropy production (S
prod
) in the northern basin of Lake Biwa per m
2
of the
lake surface plotted against monthly solar radiation energy absorbed by 1m
2
of the lake surface
(Qs). The circles represent, from left to right, the months: December, January, November, February,
October, September, March, April, June, July, August, May.
Else_SP-Jorgensen_ch009.qxd 4/18/2007 11:44 Page 201
spatial unit. This fact introduces an artificial dependence on the water depth. Partially fol-
lowing Aoki’s indices, a set of new ones (c, d, dЈ) analogous to the a, b, and bЈ were pro-
posed by Ludovisi (2003) on the basis of the relationship between the S
prod
and Q
s
. The
index dЈ does not demonstrate any significant trend during the years 1988–1996 (Table 9.1).
A good linear correlation between the monthly entropy production (S
prod
) per surface
unit of Lake Trasimeno and the monthly Q
s
has been found on a monthly time scale
(Figure 9.3) and the regression coefficients of the curve (c, intercept and d, slope) can be
compared with the analogous Aoki’s indices a, b (Table 9.2).
The comparison of c, d (regression coefficients of the curve Figure 9.3 intercept and
slope), dЈ (the ratio between the annual S
prod
and Q
s
) values (Table 9.2) calculated for
Lake Mendota and the northern basin of Lake Biwa significantly distinguishes the
eutrophic Lake Mendota from the oligotrophic Lake Biwa, and attributes to Lake
Trasimeno higher values of d and dЈ than both other lakes.
Regarding Equation 9.1, the second term on the right-hand side is the entropy pro-
duction dependent on solar radiation energy, which is caused by the conversion into heat
of the solar energy absorbed by water, by dissolved organic matter, and by SS (negligible
are the contributions from photosynthesis and light respiration of phytoplankton). The
first term on the right-hand side of Equation 9.1 is the entropy production independent
of solar radiation energy and it is caused by respiration of organisms in the lake.
For Lake Biwa and Lake Mendota total and solar energy-dependent entropy produc-
tions (per year, per MJ of absorbed solar radiation energy per m
3
of the lake water), and
202
A New Ecology: Systems Perspective
Absorbed solar energy [MJ m
-2
month
-1
]
0.0
1.0
2.0
0 200 400 800600
Entropy production [MJ m
-2
month
-1
K
-1
]
Lake Mendota
Figure 9.2 Monthly entropy production (S
prod
) in Lake Mendota per m
2
of the lake surface plot-
ted against monthly solar radiation energy absorbed by 1 m
2
of the lake surface (Qs). The circles
represent, from left to right, the months: January, February, December, November, March, October,
September, April, August, May, June, July.
Else_SP-Jorgensen_ch009.qxd 4/18/2007 11:44 Page 202
entropy productions independent of solar radiation energy (per year, per m
3
of the lake
water) are shown in Table 9.3. The values of entropy production dependent on solar radi-
ation in the light zone (euphotic zone) are related to the amount of dissolved organic mat-
ter and SS per m
3
of lake water in the light zone. The ratio of the amount of SS in Lake
Mendota to that in Lake Biwa (1:5) and the ratio of DOC in Lake Mendota to that in Lake
Biwa (2:1) are consistent with the ratio of entropy production dependent on solar radia-
tion between Lake Mendota and Lake Biwa (Table 9.3). Thus, the greater the amount of
SS and DOC, the more the entropy production is dependent on solar radiation. The
entropy production dependent on solar radiation gives a kind of physical measure for the
Chapter 9: Ecosystem principles have applications
203
Table 9.1 Annual values of S
prod
(MJm
Ϫ2
year
Ϫ1
K
Ϫ1
), S
p
(MJm
Ϫ3
year
Ϫ1
K
Ϫ1
),
and the indices bЈ (10
Ϫ4
m
Ϫ1
K
Ϫ1
), dЈ (10
Ϫ4
K
Ϫ1
), calculated for Lake Trasimeno
in the years 1988–1996
Year S
prod
S
p
bЈ dЈ
1988 16.02 3.20 6.2 31.0
1989 15.60 3.34 6.4 29.9
1990 15.72 3.65 7.3 31.4
1991 15.57 3.74 7.4 30.8
1992 15.42 3.54 7.1 30.8
1993 15.62 3.68 7.1 30.1
1994 16.40 3.91 7.4 30.8
1995 15.60 3.93 7.6 30.2
1996 15.62 4.17 8.0 29.8
Average 15.73 3.69 7.2 30.6
0 200 400 600 800
0.0
0.5
1.0
1.5
2.0
2.5
3.0
Q
s
(MJ m
-2
month
-1
)
S
prod
(MJ m
-2
month
-1
K
-1
)
S
prod
= c + d * Q
s
R = 0.97
Figure 9.3 Linear regression between the monthly entropy production (S
prod
) per surface unit of
Lake Trasimeno and the monthly solar energy absorbed by the lake (Q
s
).
Else_SP-Jorgensen_ch009.qxd 4/18/2007 11:44 Page 203
amount of dissolved organic matter and SS in the lake water by means of reactions to
incident solar radiation.
The entropy production independent of solar radiation energy (Table 9.3) is the meas-
ure of activity of respiration of organisms distributed over the whole water column. The
ratio of the amount of plankton plus zoobenthos in Lake Mendota with respect to Lake
204
A New Ecology: Systems Perspective
Table 9.2 Environmental parameters, TSI values, and values of trophic indices (a, b, bЈ)
proposed by Aoki (1995) and those of the new set of indices c, d, dЈ for Lake Mendota, Lake
Biwa, and Lake Trasimeno
Parameter Lake Biwa Lake Mendota Lake Trasimeno
Mean depth (m) 44 12.2 4.7
Residence time (year) 5.5 3.1–8.8 Ͼ20
Transparency (secchi
depth in m) 5.2 2.9 1.2
Chlorophyll ␣ (gl
Ϫ1
) 5 32 8
Total phosphorus (mgl
Ϫ1
) 0.01 0.07 0.05
TSI (SD)
1
36 45 58
TSI (Chl␣)
1
46 65 51
TSI (TP)
1
37 65 59
TSI (average)
1
39 58 56
Trophic classification
2
Oligotrophic Hyper-eutrophic Eutrophic
a (MJ m
Ϫ3
month
Ϫ1
K
Ϫ1
) 0.002 0.006
b (10
Ϫ4
m
Ϫ1
K
Ϫ1
) 0.6 2.3
bЈ (10
Ϫ4
m
Ϫ1
K
Ϫ1
) 0.6 2.4 7.2
3
c (MJ m
Ϫ2
month
Ϫ1
K
Ϫ1
) 0.070 0.070 0.014
d (10
Ϫ4
K
Ϫ1
) 26.7 27.9 31.0
dЈ(10
Ϫ4
K
Ϫ1
) 26.4 29.3 30.7
3
1
Trophic state index calculated by using Carlson (1977) equations
2
Based on the Kratzer and Brezonik (1981) classifcation system
3
Average value of the years 1988–1996
Table 9.3 Comparison of entropy productions in Lake Biwa and Lake Mendota
Lake Total (in whole Solar energy Solar energy ind-
water column) dependent ependent (in whole
(in light zone) water column)
Lake Biwa 0.07 0.13 19
Lake Mendota 0.24 0.31 69
Lake Mendota/Lake Biwa 3:7 2:3 3:6
Note: Total and solar energy-dependent entropy productions (per year per MJ of absorbed solar radiation
energy per m
3
of the lake water) are shown, respectively, in the first and in the second column, and entropy
productions independent of solar radiation energy (per year m
3
of the lake water) are in the third column.
Units are (kJ K
Ϫ1
m
Ϫ3
year
Ϫ1
). Ratios of the values for the two lakes are shown in the last row.
Else_SP-Jorgensen_ch009.qxd 4/18/2007 11:44 Page 204
Biwa is 3:9 and is consistent with the ratio of entropy production independent of solar
radiation (3:6). The larger the amount of organisms, the more the entropy production is
independent of solar radiation. The entropy productions in eutrophic Lake Mendota are
larger than those in oligotrophic Lake Biwa in any of the categories considered (i.e., due
to light absorption, respiration, and total).
Figure 9.4 reports the linear regression curves between d and TSI, TSI (SD) (Carlson,
1977) and the mean depth (because of the little data available, the regression curves cannot
Chapter 9: Ecosystem principles have applications
205
35 40 45 50 55 60 65
26
27
28
29
30
31
Trasimeno
Mendota
Biwa
d′ = 20 + 0.2 * TSI(SD)
R = 0.95
d′ (10
- 4
°K
-1
)
TSI (SD)
0 1020304050
26
27
28
29
30
31
Trasimeno
Mendota
Biwa
d′ = 30.9 - 0.1 * mean depth
R= -0.99
d′ (10
- 4
°K
-1
)
Mean depth (m)
35 40 45 50 55 60 65
26
27
28
29
30
31
Trasimeno
Mendota
Biwa
d′ = 19.1 + 0.2 * TSI
R = 0.91
d′ (10
- 4
°K
-1
)
TSI
Figure 9.4 Linear regression between the entropy production index dЈ and TSI, TSI (SD), the
mean water depth for Lake Biwa, Lake Mendota, and Lake Trasimeno.
Else_SP-Jorgensen_ch009.qxd 4/18/2007 11:44 Page 205
be considered highly significant). As can be seen, dЈ is positively correlated to TSI,
although the relation is not very sharp, because of the similarity of TSI for Lake Trasimeno
and Lake Mendota. The index dЈ shows a good negative linear correlation with the lake’s
mean depth: the intercept value given by the linear regressions (30.9ϫ10
Ϫ4
K
Ϫ1
) could
approach the higher values for dЈ at the limits of existence of an aquatic ecosystem, which
is reached at a rate of 0.1ϫ10
Ϫ4
K
Ϫ1
m
Ϫ1
.
The indices d and dЈ could be considered measures of the ability of the ecosystems to
dissipate the incoming solar energy into the system; the positive correlation between
these indices and the trophic state of the lakes indicates that they could account for the
influence of the biological productivity on the whole entropy production of the system.
As high nutrient concentrations increase the whole biological production as well as the
energy flow through an ecosystem, an increase in d and dЈ values with eutrophication is
expected because of the irreversibility of the biological processes.
Furthermore, the efficiency of the energy transfer between the trophic levels in
eutrophic systems was found to be lower than in oligotrophic systems (Jonasson and
Lindegaard, 1988). In ecological terms, this should mean that a higher nutrient availabi-
lity in more eutrophic systems induces the achievement of a biological community pos-
sessing a better ability to dissipate energy, following a development strategy based on the
maximization of the productivity, rather than optimization of the energy exploitation.
Conclusions
The entropy production of the three categories (total entropy production, dependent
entropy production, and independent entropy production) can be proposed to be larger in
a eutrophic lake than in an oligotrophic lake. Natural processes tends to proceed with time
from oligotrophy to eutrophy in most of present lake ecosystems surrounded by the envi-
ronment full of organic matter; the entropy production of the three categories in a lake will
increase with time accompanying the process of eutrophication (Aoki, 1989, 1990).
These entropy production indices can be useful tools for characterizing the trophic
status of a water body; however, their ecological interpretation might need more investi-
gation as they depend on the successional stage (Margalef, 1977; Reynolds, 1984) or on
the “prevailing condition” the system is following.
9.3 THE USE OF ECOLOGICAL NETWORK ANALYSIS (ENA) FOR THE
SIMULATION OF THE INTERACTION OF THE AMERICAN BLACK
BEAR AND ITS ENVIRONMENT
Reference from which these applications of ENA are extracted:
Patten BC. 1997. Synthesis of chaos and sustainability in a nonstationary linear
dynamic model of the American black bear (Ursus americanus Pallas) in the
Adirondack Mountains of New York. Ecol. Model. 100, 11–42.
Here an application of a dynamic model is used to show the importance of indirect effects
(see chapter 5) even within a linear approach.
206
A New Ecology: Systems Perspective
Else_SP-Jorgensen_ch009.qxd 4/18/2007 11:44 Page 206
There are many examples of indirect relationships in natural systems, some of them
involving the global one—the biosphere. The majority of these relationships remain either
overlooked or poorly understood (Krivtsov et al., 2000). To model such systems requires
the use of many integrated submodels, due to the complexity of processes involved.
The knowledge that all species in nature are complexly interconnected directly and
indirectly to all other biotic and abiotic components of their ecosystems is slow in being
translated into models and even more in management practice.
An example for such a synthesis is the simulation model of a wildlife population, the
American black bear (Ursus americanus Pallas) on the 6000ha Huntington Wildlife Forest
in the central Adirondack Mountain region of upper New York State, USA (Costello,
1992). The model was designed to be conceptually complex but mathematically simple, so
its behavior would derive more from biology and ecology than from mathematics. The
STELLA II (High Performance Systems, Hanover, NH) model of the Adirondack black
bear is linear, donor controlled, nonstationary, and phenomenological (Patten, 1983).
The model’s purposes are to express black bear biology as a population system insep-
arable from its ecosystem and to demonstrate how chaos and sustainability can be realis-
tically incorporated into models, minimizing the use of inappropriate mathematics that,
though traditional or classical, may not be well chosen due to an inadequate rationale.
If envirograms for all the taxa and significant abiotic categories of the Huntington
Wildlife Forest could be formed, then the centrum of each would account for one row and
one column of an nϫ n interconnection matrix for the whole ecosystem. The centrum of
each black bear envirogram for a life history stage would then represent one such row and
column within the ecosystem matrix and from these indirect connections between bear
and ecosystem compartments could be determined. Of course the forest ecosystem model
does not exist, but the rationale for embedding the bear subsystem within it is clear, and
the purpose of the envirograms was to implement this in principle by way of organizing
relevant information for modeling.
A further criterion was that all the direct interactions between the bear compartments
and the environment would be by mass energy transactions, enabling the conservation
principle to be used in formulating system equations. The envirograms prepared for this
model are depicted in Simek (1995) and were then used to construct a quantitative dif-
ference equation model employing STELLA II.
Quantification of the model is still approximate, based on general data and knowledge
of the bear’s life history, reproductive behavior, environmental relationships, and seasonal
dynamics as known for the Huntington Forest and the Adirondack region. The equations
are all linear, and donor controlled, with details of temporal dynamics introduced by non-
stationary (time-varying) coefficients rather than by nonlinear state variables and con-
stant coefficients.
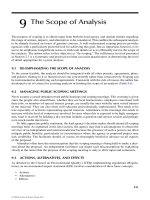
The model’s behavior is here described in detail only for the cub compartment and
selected associated parameters (Figure 9.5). The other compartments behave with simi-
lar realism.
A baseline simulation was achieved which generated 33–64 individuals 6000ha dur-
ing a typical model year; this is consistent with a mean of about 50 animals typically con-
sidered to occur on the Huntington property. Yearling M/F sex ratios generated by the
Chapter 9: Ecosystem principles have applications
207
Else_SP-Jorgensen_ch009.qxd 4/18/2007 11:44 Page 207
208
A New Ecology: Systems Perspective
Figure 9.5 Submodel layer depiction of the cub compartment of the black bear model.
Else_SP-Jorgensen_ch009.qxd 4/18/2007 11:44 Page 208
Chapter 9: Ecosystem principles have applications
209
2
3
1
1
1
2
2
3
3
2
1
6.00
12.00
0.00
0.00 48.0036.0024.0012.00
0.00 48.0036.0024.0012.00
6.00
12.00
0.00
1 1
1
2
2
2
2
3
3
3
3
Months
1
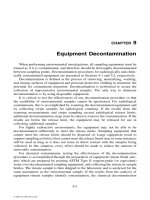
Input Sensitivity: Cubs to Fruit Food
1: 1x 2: 10x 3: 19x
Input Sensitivity: Cubs to Plant Food
1: 1x 2: 10x 3: 19x
Figure 9.6 Sensitivity of cubs to plant food and fruit. Plant food, principally leaves, fruits, and
tubers, comprise 90% of their diets. Fruit is a late-season resource (after July) whereas plant food
availability began in May–June. Fruit production occurs when they are approaching going into neg-
ative energy balance.
Else_SP-Jorgensen_ch009.qxd 4/18/2007 11:44 Page 209
model varied slightly around 0.85, compared to 0.6 observed during 1989–1994. Besides
the baseline simulation, model parameters were manipulated to investigate sensitivity
relationships. The compartments were indicated to be more sensitive to inputs and less
sensitive to outputs. The sensitivity relationships described for cubs generally hold true
also for the other age classes in the model.
Conclusions
In descending order, the most sensitive inputs were maternal milk (cubs), fruit production,
and plant food availability (Figure 9.6); relatively insensitive inputs were immigration,
animal food, and recruitment (to yearlings and adults). Sensitivities to outputs, lower than
for inputs, were, in descending order, respiration, egestion, accidental mortality, emigra-
tion, parasitic infection, predation (on cubs), harvest, and sickness. Since the model is lin-
ear, it can be considered to represent near steady-state dynamics, but its realism suggests
that the neighborhood of applicability may actually be very broad around steady state.
9.4 APPLICATIONS OF NETWORK ANALYSIS AND ASCENDENCY TO
SOUTH FLORIDA ECOSYSTEMS
Reference from which these applications of ascendency are extracted:
Heymans JJ, Ulanowicz RE, Bondavalli C. 2002. Network analysis of the South
Florida Everglades graminoid marshes and comparison with nearby cypress ecosys-
tems. Ecol. Model. 149, 5–23.
Ascendency (see Chapter 4) is used to compare a cypress system and a graminoids one
and to discern the degree of maturity shown by the two systems.
Case studies
The Everglades ecosystem in southern Florida occupies a 9300 km
2
basin that extends
from the southern shore of Lake Okeechobee south and southwest to the Gulf of Mexico
(Hoffman et al., 1990). Currently, the basin can be divided into three sections: Everglades
agricultural area, water conservation areas, and the southern Everglades, the latter of
which includes the marshes south of Tamiami Trail and the Shark River Slough. There are
two distinct communities in the graminoid system that are differentiated according to
short and long hydroperiod areas (Lodge, 1994) and occur in areal ratio of approximately
3:1. Short hydroperiod areas flank both sides of the southern Everglades, and are occu-
pied by a low sawgrass community of plants with a high diversity (100 species) (Lodge,
1994). Typically, vegetation in the short hydroperiod marsh is less than 1m tall (Herndorn
and Taylor, 1986). Long hydroperiod, deeper marsh communities are developed over peat
soil (Goodrick, 1984). The long hydroperiod community occurs more commonly in the
central Everglades where they typically are straddled between sawgrass marshes and
sloughs. These inundated areas are important for fish and aquatic invertebrates, such as
prawns. Long hydroperiod areas provide an abundant reserve of prey for wading birds
toward the end of the dry season (March–April).
210
A New Ecology: Systems Perspective
Else_SP-Jorgensen_ch009.qxd 4/18/2007 11:44 Page 210
The freshwater marshes of the Everglades are relatively oligotrophic and have been
typified as not being very productive—averaging only about 150gm
Ϫ2
per year in wet
prairie areas according to DeAngelis et al. (1998). Graminoid ecosystems provide valu-
able habitat for a wide range of animals, including species listed by the U.S. Fish and
Wildlife Service as endangered, threatened, or of concern.
The cypress system is a 295,000 ha wetlands of the Big Cypress Natural Preserve and
the adjacent Fakahatchee Strand State Preserve. Both areas cover a flat, gently sloping
limestone plain (Bondavalli and Ulanowicz, 1999) with many strands and domes of
cypress trees. The cypress swamp does not have a distinct fauna, but shares many species
with the adjacent communities (Bondavalli and Ulanowicz, 1999).
The network models of the ecosystems
A model of the freshwater graminoid marshes was constructed by Heymans et al. (2002)
and consists of 66 compartments, of which three represent nonliving groups and 63
depict living compartments (see reference for details). The three nonliving compartments
include sediment carbon, labile detritus, and refractory detritus, all of which are utilized
mainly by bacteria and microorganisms in the sediment (living sediment) and in the water
column (living POC—Particulate Organic Carbon). The primary producers include
macrophytes, periphyton, Utricularia, and other floating vegetation.
Lodge (1994) suggested that: “the Everglades does not have a great diversity of fresh-
water invertebrates due to its limited type of habitat and its nearly tropical climate, which
many temperate species cannot tolerate.” The source of most fauna in South Florida is
from temperate areas further north. Accordingly, the invertebrate component of the
graminoid marshes are broken down into eight compartments, consisting of apple snails
(Pomacea paludosa), freshwater prawns (Palaemonetes paludosus), crayfish
(Procambarus alleni), mesoinvertebrates, other macroinvertebrates, large aquatic insects,
terrestrial invertebrates, and fishing spiders. Loftus and Kushlan (1987) described an
assemblage of 30 species of fish in the freshwater marshes, of which 16 species are found
in the sawgrass marshes.
The Everglades assemblage of herpetofauna consists of some 56 species of reptiles
and amphibians. Nine compartments of mammals were identified for the graminoid
marshes. Approximately 350 species of birds have been recorded within the Everglades
National Park, and just slightly less than 300 species are considered to occur on a regu-
lar basis (Robertson and Kushlan, 1984). Sixty percent of these birds are either winter
residents, migrating into South Florida from the north, or else visit briefly in the spring
or fall. The remaining 40% breed in South Florida (Lodge, 1994), but of these only eight
groups nest or breed in the graminoids. Various species of wading and terrestrial birds
roost or breed in the cypress wetlands and feed in the graminoid marshes including anhin-
gas, egrets, herons, wood storks, and ibises. These birds are explicit components of the
cypress network. They feed on the aquatic and terrestrial invertebrate members of
the graminoid wetland; however, this capture of prey is represented as an export from the
graminoid system and an import into the cypress swamp. Waders were not included as
explicit components in the graminoid network.
Chapter 9: Ecosystem principles have applications
211
Else_SP-Jorgensen_ch009.qxd 4/18/2007 11:44 Page 211
The cypress swamp model consists of 68 compartments and similar to the graminoid
system, the cypress model has three nonliving compartments (refractory detritus, labile
detritus, and vertebrate detritus) and two microbial compartments (living POC and
living sediment). Ulanowicz et al. (1997), Bondavalli and Ulanowicz (1999) give a
breakdown of the construction of the model. The primary producers are more diverse
than those found in the graminoids and are represented by 12 compartments, seven of
which are essentially terrestrial producers: understory, vines, hardwood leaves, cypress
leaves, cypress wood, hardwood, and roots (Bondavalli and Ulanowicz, 1999). These
seven compartments ramify the spatial dimension of the ecosystem in the vertical
extent—an attribute not shared by the graminoid marshes. Other primary producer
compartments include phytoplankton, floating vegetation, periphyton, macrophytes, and
epiphytes (Bondavalli and Ulanowicz, 1999).
According to Bondavalli and Ulanowicz (1999), cypress swamps do not possess a dis-
tinct faunal assemblage, but rather share most species with adjacent plant communities.
Most fauna spend only parts of their lives in the swamp. Benthic invertebrates form the
heterotrophic base of the food chain. A high diversity of invertebrates has been recorded
in cypress domes and strands, but a lack of data at the species level mandated that they
resolve the invertebrates into only five compartments (Bondavalli and Ulanowicz, 1999).
Similarly, the fish component of this model could not be resolved into more than three
compartments, two containing small fish and a third consisting of large fish (Bondavalli
and Ulanowicz, 1999).
The herpetofauna compartments of the cypress model were similar to those of the
graminoids. The bird community of the cypress swamps was much more diverse than that
in the graminoids. The increased diversity can be traced to the inclusion of wading birds
in the cypress model. The wading birds do not roost or nest in the graminoids, although
they do feed there; therefore, it was assumed that an export of energy and carbon flowed
from the graminoids into the cypress. The 17 bird taxa in the cypress include five types
of wading birds, two passerines collections, and various predatory birds (Bondavalli and
Ulanowicz, 1999). The mammals of the cypress include all the mammalian compart-
ments of the graminoids, as well as some terrestrial mammals unique to the cypress
[shrews, bats, feral pigs, squirrel, skunks, bear, armadillos, and foxes (Bondavalli and
Ulanowicz, 1999)]. These species are found mostly in the cypress trees and cypress
domes, which extend the spatial extent of the ecosystem into the third dimension.
Ascendency, redundancy, and development capacity
Information theory is employed to quantify how well “organized” the trophic web is
(expressed in terms of an index called the system’s “ascendency”), how much functional
redundancy it possesses (what is termed the “overhead”), what its potential for develop-
ment is, and how much of its autonomy is encumbered by the necessary exchanges with
the external world (Ulanowicz and Kay, 1991).
According to the “total system throughput (TST)”, the graminoid system is far more
active than the cypress system (Table 9.4). Its TST (10,978 gCm
Ϫ2
per year) is fourfold
that of the cypress system (2952 g Cm
Ϫ2
per year). The development capacity of an
212
A New Ecology: Systems Perspective
Else_SP-Jorgensen_ch009.qxd 4/18/2007 11:44 Page 212
ecosystem is gauged by the product of the diversity of its processes as scaled by the TST.
The development capacity of the graminoid system (39,799 gC bitsm
Ϫ2
per year) is
significantly higher than that of the cypress (14,659 gC bits m
Ϫ2
per year), a difference
that one might be inclined to attribute to the disparity in the scalar factor (TST) between
the systems. When one regards the normalized ascendency, however, (ascendency is a
measure of the constraint inherent in the network structure), one notices that the frac-
tion of the development capacity that appears as ordered flow (ascendency/capacity) is
52.5% in the graminoids. This is markedly higher than the corresponding fraction in the
cypress system (34.3%).
The graminoid system has been stressed by a number of modifications to the patterns
of its hydrological flow, which have resulted in the loss of transitional glades, reduced
hydroperiods, unnatural pooling, and over-drainage (Light and Dineen, 1994). In com-
parison with the cypress community, however, the system has exhibited fewer changes in
its faunal community and is sustained by an abundance of flora and microbiota. The
cypress ecosystem, like that of the graminoids, is limited by a dearth of phosphorus,
which remains abundant in marine and estuarine waters and sediments. The graminoid
system compensates for this scarcity of nutrients with a profusion of periphyton.
Periphyton exhibits a high P/B ratio, even under oligotrophic conditions.
The natural stressors that affect the cypress ecosystem appear to have far greater
impacts, in that they modulate the rates of material and energy processing to a far greater
extent in that system. This analysis is phenomenological and there is no clear reason why
the modulation of rates of material and energy occur in the cypress. Thus, even though
these systems are (1) adjacent to one another, (2) share many of the same species, and
Chapter 9: Ecosystem principles have applications
213
Table 9.4 Information indices for both the graminoid and cypress systems
Index Cypress Graminoids
Index % of C Index % of C
Total system throughput (TST) (g C m
Ϫ2
per year) 2952.3 10,978
Development capacityϭC (gC-bitsm
Ϫ2
per year) 14,659 39,799
Ascendancy (gC-bitsm
Ϫ2
per year) 4026.1 34.3 20,896 52.5
Overhead on imports (gC-bitsm
Ϫ2
per year) 2881.6 19.7 3637 9.1
Overhead on exports (gC-bitsm
Ϫ2
per year) 75.4 0.5 606 1.5
Dissipative overhead (gC-bitsm
Ϫ2
per year) 2940 20.1 4932 12.4
Redundancy (gC-bitsm
Ϫ2
per year) 3735.8 25.5 9728 24.4
Internal capacity (g C-bits m
Ϫ2
per year) 5443.4 18,122
Internal ascendancy (gC-bitsm
Ϫ2
per year) 1707.5 31.4 8394 46.3
Redundancy (gC-bitsm
Ϫ2
per year) 3735.8 68.6 9728 53.7
Connectance indices
Overall connectance 1.826 1.586
Intercompartmental connectance 3.163 1.807
Foodweb connectance 2.293
Else_SP-Jorgensen_ch009.qxd 4/18/2007 11:44 Page 213
(3) some of the heterotrophs of the cypress feed off the graminoid system, the characteris-
tic indices of the graminoid system remain distinct from those of the cypress community.
Calculating and ranking “relative sensitivities” proves to be an interesting exercise.
For example, when the average trophic levels of the 66 compartments of the graminoid
wetland ecosystem were calculated, lizards, alligators, snakes, and mink were revealed to
be feeding at trophic levels higher than some of the “charismatic megafauna,” such as the
snail kite, nighthawk, Florida panther, or bobcat (Table 9.5).
The relative contributions to ascendency by the latter actually outweighed those of the
former, however. The relative values of these sensitivities thus seemed to accord with
most people’s normative judgments concerning the specific “value” of the various taxa
to the organization of the system as a whole (Table 9.5).
Similarly, in the cypress system white ibis, large fish, alligators, and snakes feed at
high effective trophic levels, but the system performance seemed to be enhanced more by
the activities of the vultures, gray fox, bobcat, and panthers (Table 9.5).
In comparing the component sensitivities in the graminoid and cypress systems, one dis-
covers numerous similarities between the taxa of the two systems (Table 9.5). For example,
the avian and feline predators ranked high in both systems. The contributions of snail kites
and nighthawks to the performance of the graminoid system were highest (at ca. 14 bits),
while that of the bobcat and panther were highest in the cypress (at ca. 13 bits). Both bob-
cat and panther seem to be more sensitive in the cypress than in the graminoids.
The low sensitivity of crayfish (0.99bits) in the graminoids was not repeated in the
cypress, although aquatic invertebrates generally had a low sensitivity in that system, too
(2.01bits). The sensitivity of labile detritus was similar in both systems (around 1.5bits),
while refractory detritus was more sensitive in the graminoid (1.59bits), indicating a
greater importance in that system. The sensitivities of the primary producers are lower in
the cypress (1.51bits) than in the graminoids (1.66bits) and are uniform within both sys-
tems, except for Utricularia in the graminoids. Utricularia are carnivorous plants, and,
therefore, both its effective trophic level and its sensitivities are higher than those of the
other primary producers (Table 9.5). Utricularia can exhibit an interesting example of pos-
itive feedback in ecosystems; indeed, it harnesses the production of its own periphyton via
intermediary zooplankton grazers. This subsidy to the plant apparently allows it to drive
in oligotrophic environments that would stress other macrophytes with similar direct
uptake rates. As ambient nutrient level rise, however, the advantage gained by positive
feedback wanes, until a point is reached where the system collapses (Ulanowicz, 1995).
The cypress system exhibits an additional spatial dimension in comparison with that of
the graminoids. The third, vertical (terrestrial) dimension of cypress vegetation provides
both additional habitat and food for the higher trophic levels. In the cypress, the appearance
of terrestrial vegetation affords increased herbivory by terrestrial fauna such as mammals,
birds, and terrestrial invertebrates. Furthermore, much of what is produced by the bacteria
is consumed by the higher trophic levels, and less production is recycled back into the detri-
tus. With the addition of the arboreal dimension in the cypress, one would expect that sys-
tem to be more productive than its graminoid counterpart, and that the total systems
throughput (and, consequently, other systems properties) would be higher in the cypress as
well. This is not the case, however. In fact, the throughput of the graminoids exceeds that
214
A New Ecology: Systems Perspective
Else_SP-Jorgensen_ch009.qxd 4/18/2007 11:44 Page 214
Chapter 9: Ecosystem principles have applications
215
Table 9.5 Ascendency sensitivity coefficients (Sens. in bits) and effective trophic levels (ETL)
for both the graminoid and cypress systems
Graminoids Cypress
Compartment ETL Sens. Compartment ETL Sens.
1 Crayfish 2.14 0.99 Liable detritus 1.00 1.42
2 Mesoinvertebrates 2.15 1.12 Refractory detritus 1.00 1.45
3 Other
macroinvertebrates 2.12 1.15 Phytoplankton 1.00 1.51
4 Flagfish 2.00 1.27 Floating vegetation 1.00 1.51
5 Poecilids 2.20 1.47 Periphyton macroalgae 1.00 1.51
6 Labile detritus 1.00 1.55 Macrophytes 1.00 1.51
7 Refractory detritus 1.00 1.59 Epiphytes 1.00 1.51
8 Apple snail 2.12 1.60 Understory 1.00 1.51
9 Tadpoles 2.03 1.63 Vine leaves 1.00 1.51
10 Periphyton 1.00 1.66 Hardwood leaves 1.00 1.51
11 Macrophytes 1.00 1.66 Cypress leaves 1.00 1.51
12 Floating vegetation 1.00 1.66 Cypress wood 1.00 1.51
13 Utricularia 1.03 1.69 Hardwood wood 1.00 1.51
14 Lizards 3.83 1.79 Roots 1.00 1.51
15 Freshwater prawn 2.27 2.12 Aquatic invertebrates 2.20 2.01
16 Ducks 2.20 2.32 Tadpoles 2.16 2.29
17 Bluefin killifish 2.57 2.34 Anseriformes 2.05 2.38
18 Other small fishes 2.48 2.44 Crayfish 2.26 2.46
19 Sediment carbon 1.00 2.44 Terrestrial invertebrates 2.00 2.55
20 Living sediments 2.00 2.58 Living sediment 2.00 2.64
21 Mosquitofishes 2.47 2.64 Squirrels 2.00 2.72
22 Living POC 2.00 2.80 Apple snail 2.26 2.74
23 Chubsuckers 2.50 2.86 Prawn 2.26 2.91
24 Shiners and minnows 2.68 3.60 Rabbits 2.00 2.97
25 Gruifornes 2.01 3.76 White tailed deer 2.00 2.97
26 Muskrats 2.00 3.83 Living POC 2.00 3.08
27 W-T deer 2.00 3.83 Black bear 2.26 3.30
28 Terrestrial inverts 2.00 3.91 Small herb and omni fish 2.60 3.48
29 Rabbits 2.00 5.10 Galliformes 2.33 3.58
30 Killifishes 2.81 5.13 Mice and rats 2.37 3.77
31 Turtles 2.74 2.57 Wood stork 3.24 3.82
32 Large aquatic insects 2.96 5.63 Raccoon 2.74 3.84
33 Salamander larvae 2.57 5.64 Great blue heron 3.24 3.85
34 Grebes 2.63 5.79 Egrets 3.23 3.90
35 Other centrarchids 3.02 6.59 Hogs 2.44 3.96
(continued)
Else_SP-Jorgensen_ch009.qxd 4/18/2007 11:44 Page 215
216
A New Ecology: Systems Perspective
36 Rats and mice 2.27 6.66 Other herons 3.21 4.10
37 Raccoons 2.59 6.72 White ibis 3.58 4.19
38 Opossum 2.45 6.77 Turtles 2.82 4.28
39 Pigmy sunfish 3.09 6.79 Wood peckers 2.52 4.43
40 Bluespotted sunfish 3.09 6.83 Omnivorous passerines 2.53 4.45
41 Dollar sunfish 3.09 6.87 Hummingbirds 2.53 4.45
42 Seaside sparrow 2.57 7.10 Small carnivorous fish 3.07 5.56
43 Passerines 2.96 7.16 Opossum 2.35 5.61
44 Topminnows 3.10 7.47 Kites and hawks 3.37 6.10
45 Redear sunfish 3.13 9.09 Owls 3.36 6.10
46 Catfish 3.11 9.21 Mink 3.25 6.21
47 Spotted sunfish 3.16 9.32 Otter 3.25 6.23
48 Warmouth 3.21 9.42 Medium frogs 3.21 6.24
49 Mink 3.41 9.53 Small frogs 3.21 6.24
50 Snakes 3.32 9.66 Salamanders 3.28 6.32
51 Otter 3.34 9.71 Large frogs 3.32 6.38
52 Bitterns 3.25 9.75 Gruiformes 3.35 6.53
53 Alligators 3.39 9.96 Armadillo 2.90 6.54
54 Large frogs 3.29 10.19 Pelecaniformes 3.40 6.61
55 Small frogs 3.17 10.33 Large fish 3.42 6.99
56 Other large fishes 3.27 10.69 Lizards 3.00 7.64
57 Largemouth bass 3.24 10.92 Caprimulgiformes 3.00 7.64
58 Medium frogs 3.16 10.93 Bats 3.00 7.64
59 Gar 3.45 10.96 Predatory passerines 3.00 7.64
60 Cichlids 3.22 10.98 Shrews 3.00 7.65
61 Fishing spider 3.27 11.77 Alligators 3.78 8.30
62 Bobcat 3.02 12.01 Snakes 3.79 8.58
63 Salamanders 3.32 12.29 Salamander larvae 3.20 8.62
64 Panthers 3.17 12.33 Vertebrates detritus 1.00 8.82
65 Snailkites 3.13 14.38 Vultures 2.00 10.03
66 Nighthawks 3.00 14.69 Gray fox 3.41 10.29
67 Bobcat 3.03 12.96
68 Florida panther 3.36 13.48
Table 9.5 (Continued )
Graminoids Cypress
Compartment ETL Sens. Compartment ETL Sens.
Else_SP-Jorgensen_ch009.qxd 4/18/2007 11:44 Page 216
of the cypress by some fourfold. Although the total biomass in the cypress is three times
greater than that in the graminoids, the cypress system’s P/B ratio is four times lower there
than in the graminoids, thereby yielding the greater throughput in the graminoids.
The increase in throughput in the graminoids increases its development capacity and
ascendency. The relative ascendency, which excludes the effects of the throughput, is per-
haps a better index with which to compare these two systems. The relative ascendency of
the graminoids is exceptionally high. For example, Heymans and Baird (2000) found that
upwelling systems have the highest relative ascendency of all the systems they compared
(which were mostly estuarine or marine in origin), but the relative ascendency of 52% for
the graminoids is higher than any such index they had encountered. The relative ascen-
dency of 34% reported for the cypress is lower than most of the relative ascendencies
reported by Heymans and Baird (2000).
Some reasons behind the higher relative ascendency of the graminoids can be explored
with reference to the relative contributions of the various components to the community
ascendency (Table 9.5). The highest such “sensitivity” in the cypress is more than one bit
lower than its counterpart in the graminoids, and, on average, most higher trophic level
compartments that are present in both models exhibit higher sensitivity in the graminoids
than in the cypress. It is also noteworthy that 41 compartments in the cypress show sensi-
tivities of less than 5bits, while only 28 compartments lie below the same threshold in the
graminoids. The higher sensitivities in the graminoids owe mainly to the greater activity
among the lowest trophic compartments, which causes the other compartments to seem
rare by comparison. Thus, in the graminoids, community performance seems sensitive to
a larger number of taxa, which accords with the analysis of dependency coefficients and
stability discussed in Heymans et al. (2002). Pahl-Wostl (1998) suggested that the organ-
ization of ecosystems along a continuum of scales derives from a tendency for component
populations to fill the envelope of available niche spaces as fully as possible. This expan-
sive behavior is seen in the cypress system, where the arboreal third dimension of the
cypress trees fills with various terrestrial invertebrates, mammals, and birds not present in
the graminoids. The graminoid system, however, appears to be more tightly organized
(higher relative ascendency) than the cypress in that it utilizes primary production with
much higher turnover rates. This confirms Kolasa and Waltho (1998) suggestion that niche
space is not a rigid structure but rather coevolves and changes in mutual interaction with
the network components and the dynamical pattern of the environment. The graminoid
system is more responsive, because it utilizes primary producers with higher turnover
rates, and has, therefore, been able to track more closely environmental and anthropogenic
changes. The cypress system, on the other hand, should have more resilience over the long
term due to its higher overhead, especially its redundancy (Table 9.4).
Conclusions
According to Bondavalli et al. (2000), a high value of redundancy signifies that either the
system is maintaining a higher number of parallel trophic channels in order to compensate
the effects of environmental stress, or it is well along its way to maturity. Even though
these authors suggest that the cypress system is not very mature, in comparison to the
Chapter 9: Ecosystem principles have applications
217
Else_SP-Jorgensen_ch009.qxd 4/18/2007 11:44 Page 217
graminoids, one would have to conclude that the cypress is a more mature system. A slower
turnover rate, as one observes in arboreal systems such as the cypress, is indicative of a
more mature ecosystem. Furthermore, the third dimension of terrestrial vegetation affords
the system a greater number of parallel trophic channels to the higher trophic levels, com-
pared with the mainly periphyton dominated graminoid system. Although the graminoid
system has a large throughput of carbon and a substantial base of fast-producing periphy-
ton, it appears relatively fragile in comparison to the cypress system, which is more resilient
over the long run and has more trophic links between the primary trophic level and the het-
erotrophs. In conclusion, according to ascendency indices, scale—in the guise of the verti-
cal dimension, of the cypress makes that system more resilient as a whole, and less sensitive
with respect to changes in material processing by many of its composite species.
9.5 THE APPLICATION OF ECO-EXERGY AS ECOLOGICAL INDICATOR
FOR ASSESSMENT OF ECOSYSTEM HEALTH
Reference from which these applications of eco-exergy used as ecosystem health indicator
are extracted:
Zaldívar JM, Austoni M, Plus M, De Leo GA, Giordani G, Viaroli P. 2005. Ecosystem
Health Assessment and Bioeconomic Analysis in Coastal Lagoon. Handbook of
Ecological Indicator for Assessment of Ecosystem Health. CRC Press, pp. 163–184.
In this paragraph an application of Eco-Exergy is reported (see Chapters 2 and 7) to
assess the ecosystem health of a coastal lagoon.
Coastal lagoons are subjected to strong anthropogenic pressure. This is partly due to
freshwater input rich in organic and mineral nutrients derived from urban, agricultural, or
industrial effluent and domestic sewage, but also due to the intensive shellfish farming.
The Sacca di Goro is a shallow water embayment of the Po Delta. The surface area is
26 km
2
and the total water volume is approximately 40ϫ10
6
m
3
. The catchment basin is
heavily exploited for agriculture, while the lagoon is one of the most important clam (Tapes
philippinarum) aquaculture systems in Italy. The combination of all these anthropogenic
pressures call for an integrated management that considers all different aspects, from
lagoon fluid dynamics, ecology, nutrient cycles, river runoff influence, shellfish farming,
macro-algal blooms, and sediments, as well as the socio-economical implication of differ-
ent possible management strategies. All these factors are responsible for important disrup-
tions in ecosystem functioning characterized by eutrophic and dystrophic conditions in
summer (Viaroli et al., 2001), algal blooms, oxygen depletion, and sulfide production
(Chapelle et al., 2000). Water quality is the major problem. In fact from 1987 to 1992 the
Sacca di Goro experienced an abnormal proliferation of macroalga Ulva sp. This species
has become an important component of the ecosystem in Sacca di Goro. The massive pres-
ence of this macroalga has heavily affected the lagoon ecosystem and has prompted several
interventions aimed at removing its biomass in order to avoid anoxic crises, especially dur-
ing the summer, when the Ulva biomass starts decomposing. Such crises are responsible for
considerable damage to the aquaculture industry and to the ecosystem functioning.
218
A New Ecology: Systems Perspective
Else_SP-Jorgensen_ch009.qxd 4/18/2007 11:44 Page 218
To carry out such an integrated approach a biogeochemical model, partially validated
with field data from 1989 to 1998, has been developed (Zaldívar et al., 2003). To analyze
its results it is necessary to utilize ecological indicators, using not only indicators based on
particular species or component (macrophytes or zooplankton) but also indicators able to
include structural, functional, and system-level aspects. Eco-exergy and specific eco-exergy
are used to assess the ecosystem health of this coastal lagoon. Effects of Ulva’s mechanical
removal on the lagoon’s eutrophication level are also studied with specific exergy
(Jørgensen, 1997) and cost–benefit analysis (De Leo et al., 2002). Three scenarios are ana-
lyzed (for a system with clam production and eutrophication by Ulva) using a lagoon
model: (a) present situation, (b) optimal strategy based on cost–benefit for removal of Ulva,
and (c) a significant nutrient loading reduction from watershed. The cost–benefit model
evaluates the direct cost of Ulva harvesting including vessel cost for day and damage to
shellfish production and the subsequent mortality increase in the clam population. To take
into account this factor, the total benefit obtained from simulating the biomass increase was
evaluated using the averaged prices for clam in northern Adriatic; therefore, an increase in
clam biomass harvested from the lagoon will result in an increase of benefit.
The Sacca di Goro model has several state variables for which the exergy was computed:
organic matter (detritus), phytoplankton (diatoms and flagellates), zooplankton (micro- and
meso-), bacteria, macroalgae (Ulva sp.), and shellfish (Tapes philippinarum). The exergy
and the specific eco-exergy are calculated using the data from Table 9.6 on genetic informa-
tion content and all biomasses were reduced to gdwl
Ϫ1
(grams of dry weight per liter) .
Figures 9.7 and 9.8 present the evolution of exergy and specific exergy under the two
proposed scenarios: Ulva removal and nutrient load reduction, in comparison with the
“do nothing” alternative. As it can be seen the eco-exergy and specific eco-exergy of both
increase, due to the fact that in our model both functions are dominated by clam biomass.
However, the optimal result from the cost/benefit analysis will considerably improve
the ecological status of the lagoon in term of specific exergy.
Chapter 9: Ecosystem principles have applications
219
Table 9.6 Parameters used to evaluate the genetic information content
Ecosystem component Number of information genes Conversion factor
Detritus 0 1
Bacteria 600 2.7
Flagellates 850 3.4
Diatoms 850 3.4
Micro-zooplankton 10,000 29.0
Meso-zooplankton 15,000 43.0
Ulva sp. 2000
1
6.6
Shellfish (bivalves) – 287
2
Source: Jørgensen (2000b).
1
Coffaro et al. (1997).
2
Marques et al. (1997); Fonseca et al. (2000).
Else_SP-Jorgensen_ch009.qxd 4/18/2007 11:44 Page 219
220
A New Ecology: Systems Perspective
Figure 9.7 Eco-exergy mean annual values: present scenario (continuous line), removal of Ulva,
optimal strategy from cost–benefit point of view (dotted line), and nutrients load reduction from
watershed (dashed line). Reprinted with permission.*
Figure 9.8 Specific eco-exergy mean annual values: present scenario (continuous line), removal
of Ulva, optimal strategy from cost–benefit point of view (dotted line), and nutrients load reduc-
tion from watershed (dashed line). Reprinted with permission.*
*Copyright © 2005 Handbook of Ecological Indicators for Assessment of Ecosystem Health, edited by
S.E. Jørgensen, F-L Xu, R. Costanza, from chapter by J.M. Zaldívar et al. Two figures reproduced by
permission of Taylor & Francis, a division of Informa plc.
Else_SP-Jorgensen_ch009.qxd 4/18/2007 11:44 Page 220
Conclusions
The results show that cost–benefit optimal solution for removal of Ulva has the highest
eco-exergy and specific eco-exergy, followed by a significant removal of nutrients from
the watershed. In the case of removal of Ulva, specific exergy continues to increase as
the number of vessels operating in the lagoon increase. The present situation had the low-
est eco-exergy and specific eco-exergy. The result shows that it is a good sustainability
policy to take care of natural resources, in this case the clams.
Eco-exergy expresses the system biomass and genetic information embedded in that bio-
mass, while specific eco-exergy tells us how rich in information the system is. These indi-
cators broadly encompass ecosystem characteristics and it has been shown that they are
correlated with several important parameters such as respiration, biomass, etc. However it
has been pointed out (Jørgensen, 2000b) that eco-exergy is not related to biodiversity, and
for example, a very eutrophic system often has a low biodiversity but high eco-exergy.
When a manager has to select between different alternatives, it is difficult to evaluate the
optimal solution from an ecological point of view. As eco-exergy and specific exergy are
global parameters of the ecosystem, they give an idea of benefits that a measure will produce.
9.6 EMERGY AS ECOLOGICAL INDICATOR TO ASSESS
ECOSYSTEM HEALTH
Reference from which these applications of emergy as ecological indicator are extracted:
Howington TM, Brown MI, Wiggington M. 1997. Effect of hydrologic subsidy on
self-organization of a constructed wetland in Central Florida. Ecol. Eng. 9, 137–156.
Emergy (see Chapter 6) is used to study and explain theories concerning the effect of an
external subsidy on a complex system (constructed wetland) seen by a holistic point of view.
Lake Apopka is a shallow (mean depth ϭ 1.7 m) hypereutrophic lake in Central Florida,
with an area of 124km
2
(Lowe et al., 1989, 1992). In the early 1940s a hurricane removed
most of the rooted macrophytes in the lake which led to the early stages of increased nutri-
ent availability and subsequently increased algal productivity (Schelske and Brezonik,
1992). Addressing the nutrient status of this lake, the St. Johns River Water Management
District (SJRWMD) constructed a 200ha freshwater marsh on former agricultural lands
with the goal of reducing the nutrient levels in the lake. It was suggested that by pumping
enriched lake water through a constructed marsh, filtration of phosphorus and suspended
sediments could be maximized. The pump system was turned on in early 1991. The
subsidized and unsubsidized marsh maintained similar average water levels (0.76m)
throughout the study period varying yearly by no more than 0.2m. Theory suggests that
an external subsidy should increase the carrying capacity for wildlife of an ecosystem, all
other things being equal. The increased capacity for wildlife may be an indirect result of
certain self-organizational processes such as changes in vegetative cover. Other factors
influencing the relationship between wetland productivity and hydro-period include nutri-
ent inputs, export, nutrient cycling, and decomposition (Carpenter et al., 1985).
This study tested theories concerning the effect of an external subsidy on ecosystem
structure and organization. Two newly established marshes (one receiving nutrient-enriched
Chapter 9: Ecosystem principles have applications
221
Else_SP-Jorgensen_ch009.qxd 4/18/2007 11:44 Page 221
lake water and the other not receiving the subsidy) were the areas under study. The 63ha sub-
sidized marsh is the first of two cells that constitute the treatment wetland receiving lake
water. The unsubsidized marsh, 46ha, was created as a result of being a borrow pit for build-
ing berms around the treatment wetland. Vegetative cover richness and percent cover were
determined using aerial photos and GIS, and was calculated using Margalef’s (1977) index
for species richness. Percent cover provided a further description of the changes in structural
complexity of each marsh over time. Also avifauna surveys were conducted. Shannon diver-
sity indexes were used to compare the avian communities found in the surveyed marshes. A
synoptic study on the fish population of the subsidized and unsubsidized marshes was also
conducted. A model of the marsh system (see Figure 9.9 for energy symbols) was created to
222
A New Ecology: Systems Perspective
Figure 9.9 Energy symbols used to make an energy diagram.
Else_SP-Jorgensen_ch009.qxd 4/18/2007 11:44 Page 222
describe the role of the most important components and relationships (Figure 9.10). An
emergy analysis was performed to evaluate on a common basis (solar energy) the contribu-
tions of the various inputs (pumps, water, nutrients, human services, and renewable energies)
driving the marshes ecosystems.
Emergy evaluation separates inputs on the basis of the origin (local or purchased) and
of their renewability (see also Chapter 6). An environmental loading ratio (ratio of local
and exogenous nonrenewable emergy to renewable emergy) and an investment ratio (ratio
of exogenous to local emergies) were calculated to compare the quantities and qualities
of the energies entering each system. Emergy analysis tables were developed separately
in Tables 9.7 and 9.8 for the subsidized and unsubsidized marshes.
The environmental loading ratio showed a large contrast between the two marshes.
Investment ratios for the two marshes showed a large difference in the amount of pur-
chased energy necessary to maintain the flows of environmental inputs.
Table 9.9 contains the ratios of free to purchased energy (environmental loading) and
nonrenewable energy to renewable energy (investment ratio). Renewable energy sources
Chapter 9: Ecosystem principles have applications
223
Lake
Apopka
nutrients
Rain
and
Nutrients
Peat
Nutrients
Sun
Water
Plants
nutrients
Detritus
Insects
Fish
Birds
Pump
System
Fuel
Figure 9.10 Diagram of constructed marsh. Removal of pump system simulated unsubsidized marsh.
Else_SP-Jorgensen_ch009.qxd 4/18/2007 11:44 Page 223