hướng dẫn sử dụng để arcview 3.3 để các nhà quy hoạch sử dụng đất tại quận puttalam
Bạn đang xem bản rút gọn của tài liệu. Xem và tải ngay bản đầy đủ của tài liệu tại đây (1.99 MB, 32 trang )
User’s Guide to ArcView 3.3 for Land
Use Planners in Puttalam District
IUCN Sri Lanka, Country Ofce
Dilhari Weragodatenna
Table of Content
Intr
oducon……… ………………………………… ……… 1
1. Gengstarted…………… …………………………………………………… 2
2. Geo-referencing…………………………………………… …………………… 6
3. Digizing(CapturingtheData)………………………………… …………… 10
4. Tablesandaributeinformaon…………………………… ……………… 13
5. Calculangeldvalues…… ……………………………………………… 14
6. ModifyingtheTheme…………………………………………… ……………. 15
7. MapScale…………………………………………………………………… 16
8. LabellingtheMap………………………………………………………… … 17
9. CreangamapLayout…………………………………………… ………… 19
10. AddingMapelementstothelayout……………………………………… …21
11. ExporngamaptoPDF,TIFF,JPEG,andotherformats…… ………… 24
12. PrinngtheMap……………………………………………… ……… 25
13. TransferringDatafromGPS………………………… ……………… 26
14. References…………………………………………………………… 27
P
ageNo
1
User’sGuidetoArcView3.3forLandUsePlannersinPualamDistrict
Introducon
GeographicalInformaonSystems(GIS)isacolleconofcomputerhardware,soware,and
geographic data for capturing, managing, analyzing,and displaying all forms ofdata with
geographicallyreferencedinformaon.Itisthemergingofmappinganddatabasetechnology.
GISisoenusedasadecisionsupporttoolinvolvingintegraonofspaallyreferenceddata
inaproblem-solvingenvironmentaswell.Typically,GISisusedforhandlingmapsofonekind
oranother.These mightberepresentedasseveraldierentlayerswhereeachlayerholds
a parcular kind ofdata. Eachfeature is linkedto a posionon thegraphicalimageon a
mapand a record in an aributetable.GIS can revealhidden paerns,relaonships,and
trendsthatarenotreadilyapparentinspreadsheetsorstascalpackages, oencreang
newinformaonfromexisngdataresources.ThereforeGISallowstoseepaern,distance,
area,relaonship,trend,andLocaonontheground.AndalsoGIStechnologyisoenused
fordecision-making,becausethedatacanbeeasilymodied,shared,accessed,updatedand
linkedwithphotographs,videoandaudioclips.
Currently, many government agencies as well as non-government agencies in Sri Lanka
successfullyapplyGIStechnologyasadecisionmakingtooltocoordinateresourceulizaon
plans. However, there areoen limitaonsin using ofthis new technologydue to lack of
fundsforobtainingtherelevantsowareandexperseinthearea.
IUCN,InternaonalUnionforConservaonofNatureandNaturalResources,SriLanka
implementedtheproject,Ecologicallyandsocio-economicallysoundcoastalecosystem
rehabilitaon and conservaon in tsunami-aected countries of the Indian Ocean
withnancialassistancefromBundesministerium für wirtschaliche Zusammenarbeit
und Entwicklung (BMZ)
(German Federal Ministry for Economic Cooperaon and
Development) in the Pualam lagoon area in the North Western Province of Sri
Lanka. An important component of this project was the capacity building of State
Instuons responsible for managing the resources in the Pualam Lagoon. As
a part of thisprogramme, various StateAgenciesin the Pualam Lagoon area were
providedwithGISMapsincorporangseveraldatabasescollatedandanalysedbythe
Project.TherecipientsweretrainedontheGIStechniques.Asaconnuingcapacity
buildingexercise,itwasfeltnecessarythatauser’sguideforoperangGISsowarebe
provided.
This user’s guide was prepared drawing heavily from Arc View 3.3 help menu and
Arc View 9.2 for the sole purpose of providing simplied instrucons to the users of
GIS maps produced under the BMZ project. Copies of this User’s Guide will be given
to selected users free of charge and IUCN does not have any commercial interest in
preparing and distribuon of this Guide.
User’sGuidetoArcView3.3forLandUsePlannersinPualamDistrict
2
1. Geng Started
Step 1
• DoubleclickonArcView GIS 3.3inyourDesktop(SeeFig.1.1)
Fig. 1.1
Step 2
• ClickOK buoninthedialogueBox(SeeFig.1.2)
Fig. 1.2
Click OK
To start the work double click Arc
view GIS 3.3
3
User’sGuidetoArcView3.3forLandUsePlannersinPualamDistrict
Step 3
Open a new View
• Tostartworkhighlight viewintheprojectwindowandclicktheNewbuon
• The
defaultnameofthenewViewisView 1.
• T
orenametheView,chooseProperes fromtheView menu.(SeeFig.1.3)
WhentheviewwindowisopenedrenamethenewviewinNamecolumn
Fig. 1.3
Thebasicfeaturesofthestartupscreenare,(SeeFig.1.4)
Fig.
1.4
3
The New View
User’sGuidetoArcView3.3forLandUsePlannersinPualamDistrict
4
Project window
Shapelesaresavedinprojects (Shapeleisanon-topologicalformatforstoringthegeometric
locaonandaributeinformaonofgeographicfeatures.Itsavesasveles,suchas.shp,
.shx,.dbf,.sbn,sbx.).TheveProjectwindowobjectsareViews,Tables,Charts,Layouts,and
Scripts.
Menu bar
User-programmablepull-downmenus,uniquelydenedforeachProjectwindowobject.
Buon bar
User-denedacons(scripts)whichareimplementedimmediatelyonclicking.
Tool bar
User-denedacons(scripts)whichapplywhilethetoolisacvated(clickon,clicko)
Standard View Buons
When
movethecursorovereachbuoninstandardbaryoucanseeanexplanaonofits
funconinthestatusbar.
Theaconofsomeofimportantbuonisexplainedbellow
Save Project - Saves changes of all works to the project le.
Add Theme - Upload data from existing data sources to the view.
Edit Legend
- Toggle the legend visibility for active themes in the Standard View.
Open Theme Table
- Display the selected records after graphically select features in a
theme. Ensure that the theme in which you selected the features is the only active.
Query Builder - It can be built a query by double-clicking on these options with the
mouse or by typing your query directly into the query text box.
Zoom to full extent/Zoom to active theme(s) - zooms the active window to the extent
of all themes in the legend and the active window to the extent of all ACTIVE themes in
the legend
Zoom to full previous extent - Zoom the active window back to the previously zoomed
area.
Clear Selection Features - Unselect the selected features in active themes
5
User’sGuidetoArcView3.3forLandUsePlannersinPualamDistrict
Identify - Show database information about a feature.
Pointer - Select shapes or points by clicking or dragging a box.
Select Feature - Selects features in the visible, active themes by clicking or dragging a
box.
Pan - Pan can drag by click-and-holding to the inside the view window in any direction.
Ruler -
Measure the distance between two or more points by left clicking on both the
starting and ending point.
Label - label features with graphic text using database attributes.
Text - Create text on the display by clicking the location for the text, typing it in the box
provided, then positioning it using the “arrow” tool.
Draw Point
- Add graphic shapes to a view by selecting a graphic shape type from the
drop down menu of layout options (i.e., points, lines, boxes).
User’sGuidetoArcView3.3forLandUsePlannersinPualamDistrict
6
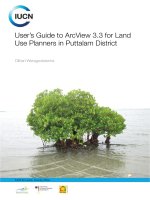
2. Geo-referencing
Alltheelementsinamaplayerhaveaspecicgeographiclocaonandextentthatenables
themtobelocatedonorneartheearth’ssurface.Theabilitytoaccuratelydescribegeographic
locaonsiscricalinbothmappingandGIS.Thisprocessiscalledgeo-referencing.
Images are stored as raster data, where each cell in the image has a row and column
number.(Rasterdataisdenedbyitscoloursandpixelsandisnotdenedmathemacally.
Digital pictures are raster data) Shape les and ARC/INFO coverage are stored in real-
worldcoordinates.Inordertodisplayimageswithcoveragesorshapeles,itisnecessary
toestablishanimage-to-worldtransformaonthatconvertstheimagecoordinatestoreal-
worldcoordinates.Thistransformaoninformaonistypicallystoredwiththeimage.
Step 1
Select Extensions t
o Geo-reference
• Inordertoaddimageles(JPEG,BMP,TIFF…)youneedtoturnontheExtensions
fr
omle
menu.
• SinceImagesareJPEGlesyouhavetoacvatetheImage Analysisinthe
extensionmenu.
• clickOK (See
Fig.2.1)
Fig. 2.1
1. Select File
2. Select Extensions
4. Click OK
3. Put a ck on Image Analysis
7
User’sGuidetoArcView3.3forLandUsePlannersinPualamDistrict
Step 2
Adding the Raster image data such as aerial photographs, satellite images, etc. as a Theme
(Add Data into Arc View)
• UsetheAdd ThemeBuontoloadtheimagethatyouneedtogeo-reference
• SelectImage Analysis Data Source fromSet Data Source Types
• Givethepathwheretheimageisstoredfromdrivers
•
ClickOK t
oaddtheselectedle(s)toyourViewwindow.(SeeFig.2.2)
Not
e:WhenyouselecttheImageAnalysis,AlignToolappearintheToolBar
Fig.
2.2
Step 3
Giving real coordinates in to the Image
•
ChooseAlign Tool
fromToolBarandclickontheLanduseTypewhichyoucan
getRealworldcoordinates(AlignToolshouldbetherstBuonfromRightin
theToolBar)-(Land use type can be a Juncon, corner of the Lake, Corner of the
Building etc)
•
ThenRight click
andchooseEnter to CoordinatesfromtheDialogueBox
• TypetheX, Y CoordinatesDigitsintheTo PointDialogueBoxandClickOK
• GiveMinimum Four Coordinates
totheImage(SeeFig.2.3)
1. Select Add Theme buon
5. Highlight the Image
2. Select Image Analysis
Data Source
3. Select the Drive
4. Click the File Name
6. Click OK
User’sGuidetoArcView3.3forLandUsePlannersinPualamDistrict
8
Fig. 2.3
Step 4
Saving the Geo - referenced Image (Raster data)
• ChooseSave Image AsfromThemeinMenu Bar
• SelecttheTIFFfromList les of Type
• SelecttheDirectorytosavetheImage
• ClicktheFile NamewhereyouwanttosavetheImage
• TypeNameoftheImageinFile Name BarandClickOK (SeeFig.2.4)
Fig. 2.4
1. Select Align Tool
2. Select Enter “To”
Coordinate
3. Type X, Y
Coordinates Digits and click ok
2. Select Save Image As and give a path to save the image
9
User’sGuidetoArcView3.3forLandUsePlannersinPualamDistrict
Step 5
Open the Saved Image to connue the work
•
UsetheAdd themeBuontoloadtheSaveImage.
• SelecttheImage Data Source
fromDataSourceType.
• ChangetheDirectorytoyourFilelocaon.
• ClicktheFile Name
tohighlighttheselectedImageandOK
User’sGuidetoArcView3.3forLandUsePlannersinPualamDistrict
10
3. Digizing (Capturing the Data)
Theprocessof represenng an analogue signal or an image by a discrete set of its points
is known as digizing. This data aer conversion is in the binary format, which isdirectly
readablebycomputer.Thedatatobeconvertedcanbeatext,animage,audiooravideo.
Whenyoudigizeamap,youuseadigizingtabletconnectedtoyourcomputertotraceover
featuresyouareinterestedin.TheX,Ycoordinatesofthesefeaturesareautomacallyrecord
andstoreinthecomputerasspaaldata.
Step 1
Creang a New Theme
Y
ouarenowreadytodigizefeaturesinArcView.
• ChooseNew ThemefromtheViewMenu.
• Choose
PolygonfromthelistofchoicesinFeaturetype(Point,Line,andPolygon)
Alltheedinganddrawingtoolsthatyoucanusewiththemouseareavailable
usingthedigizer.Choosingthecorrecttoolisveryimportantinordertobe
producveandtodigizefeaturesaccurately.
• Choosethedefaultorprovideanameandlocaonforthenewtheme.(SeeFig.
3.1and3.2)
Fig. 3.1
1. Click View and New Theme
2. Select Type
3. Click OK
11
User’sGuidetoArcView3.3forLandUsePlannersinPualamDistrict
Fig. 3.2
Step 2
Capturing data
Ifyouwanttoeditanexisngtheme,makeitacveandchooseStartEdingfromthe
Thememenu.Ifyoujustwanttoaddgraphicstoyourviewwithoutcreangatheme,go
aheadanddigize.
• Clickathemelegendboxtomakeit“Acve”(themeissurroundedbyaboxand
appearsraised).Athemecanonlybeeditedwhenitis“Acve”.
• GotoThemeandselectStart Eding.
• ChoosetheDraw Polygontoolfromthe“DrawingTools”drop-downmenu.
• Clickonthe"drawingtool"pull-downmenubuonandselectthedrawingtool
matchingtheshapeofthe"acve"theme(SeeFig.3.1).
Usethistoolifthe“acve”themeisapoint
Usethistoolifthe“acve”themeisaline
Usethistoolifthe“acve”themeisamul-
pointline
Usethistooltodrawarectangle
Usethistooltodrawacircle
5. Type name of the New Theme
3. Click OK
4. Select File
User’sGuidetoArcView3.3forLandUsePlannersinPualamDistrict
12
Fig. 3.3
Step 3
• Drawthepolygonbyclickingforeachverce(the cursor will be a crosshair)
Doubleclickonthelastverce.
• Ifyouwanttoconnuethedrawing,rightclicksandselectsPantomove.
Select Polygon
Highlight the Theme
13
User’sGuidetoArcView3.3forLandUsePlannersinPualamDistrict
4. Tables and aribute informaon
Tabularinformaonisthebasisofgeographicfeatures,allowingyoutovisualize,query,and
analyseyourdata.Inthesimplestterms,tablesaremadeupofrowsandcolumns.InGIS,
rowsareknownasrecordsandcolumnsareelds.Eacheldcanstoreaspecictypeofdata
suchasanumber,date,ortext.
Step 1
Insert Data into a table
•
ClicktheOpen Theme Table bu
onintheViewbuonbar.
• AddeldstothetablefromtheTable Menu barandselecttheAdd Fieldchoice
fromtheEditmenu.TheFieldDeniondialogboxwillappearallowingyouto
denetheeldinthetable.
• AddrecordstothetablefromtheTable menu bar,selecttheAdd Recordchoice
fromtheEditmenu.Thiswilladdasinglerecordtothetable.Repeatthisacon
asmanymesasneeded.
• AdddatatothetablefromtheTabletoolbar,selecttheEdit tool.Thisallowsyou
toedittheemptycellsinthetable.
• Toeditthevaluesinatable,FromtheTable menu,ChooseStart Eding.
• SelecttheEdit toolandplacethecursorintheeldoftherecordyouwantto
edit.Typethenewvalueintotheeld.WhenusingtheEdittoolinthetable,the
followingkeyboardacceleratorsaresupportedfortheeditablecell.
• Tonishedingandcommityourchanges,chooseStop EdingfromtheTable
menu.(seeFig.4.1)
Fig. 4.1
Select Table
Select Edit Tool
to insert text or
digits
Select Theme
User’sGuidetoArcView3.3forLandUsePlannersinPualamDistrict
14
5. Calculang eld values
Enteringvalueswiththekeyboardisnottheonlywayyoucaneditvaluesinatable.Insome
cases,youmightwanttoperformamathemacalcalculaontosetaeldvalueforasingle
recordorevenall records. The ArcVieweldcalculatorletsyouperformsimpleas wellas
advancedcalculaonsonallorselectedrecords.Inaddion,youcancalculatearea,length,
perimeter,andothergeometricproperesoneldsinaributetables.
Step 1
To calculate a value for a eld
• ChooseStart EdingfromtheTablemenu.
• Clickonthenameoftheeldyouwishtocalculate.Notethatthenamesofelds
youcancalculateappearinanormalfont,anythatyoucan'tareshowninitalics.
• ClicktheCalculatebuon.
• IntheFieldCalculatordialogthatappears,typetheexpressionforthecalculaon
intheinputareaofthedialogbox.Youcanusetheeldandrequestlistitemsto
helpyouformtheexpressionbydouble-clickingoneldnamesandrequestsor
youcantypetheexpressionyourself.
• PressOKtoperformthecalculaon.ArcViewdisplaystheresultsinthetable.
(SeeFig.5.1)
Typethefollowingintotheexpressionbox
Forlength:
[Shape].ReturnLength/1000000
Forarea:
[Shape].ReturnArea/1000000
Forperimeter:
[Shape].ReturnLength/1000000
Note - The calculaon applies to the selected set of records. If no records are selected, the
calculaon applies to all records.
Fig. 5.1
1. Select Calculate
2. Type the expression here
3. Click OK
15
User’sGuidetoArcView3.3forLandUsePlannersinPualamDistrict
6. Modifying the Theme
AThemeisacolleconoffeaturesdrawnonaview.AThemehasanassociatedlegendthat
denesthesymbolizaonofthefeatures.
Step 1
Changing Theme Properes
• OpentheLegend Editorboxbydouble-clickingthethemelegendbox;orby
clickingThemeonthemenubar,thenclickingEdit Legend.
• Double-clicktheSymbol boxintheLegendEditortoopenthe“ThemeProperes
Editor”.Editthetheme’sproperesbyusingthebuonsonthepalee.
• FromFill PaleeyoucanchangethePaernoftheLegend.
• FromColor PaleeyoucanchangethecoloroftheLegend.
• FinishtheEdingClick Apply (seeFig.6.1).
Fig. 6.1
1. Double Click the Theme
2. Double Click the Symbol
3. Select the Fill Paern
4. Click Apply
User’sGuidetoArcView3.3forLandUsePlannersinPualamDistrict
16
7. Map Scale
Mapscaleistherelaonshipbetweenthedimensionsofamapandthedimensionsofthe
Earth.Itisusuallyexpressedasarao,like1:63,360.Thescalerao1:63,360meansthatone
unitofdistanceonthemaprepresents63,360ofthesameunitsofdistanceontheEarth.So
ona1:63,360scalemap,oneinchonthemapequalsonemileonthegroundbecauseone
statutemilehas63,360inches.Becausethescaleraoisaconstant,itistrueforwhatever
unitsinwhichthefraconisexpressed.Soonamapwithascaleof1:24,000,onecenmeter
equals24,000cenmetersontheground,justasoneinchrepresents24,000inches.
Step 1
Seng Map Scale
Mapunitsaretheunitsoftheview’sdisplaysurface.Iftheviewhasnotbeenprojected,Map
unitsaretheunitsin whichthecoordinatesofthespaaldata contained inyourvieware
stored.Iftheviewhasbeenprojected,Mapunitsaretheunitsintowhichthisdataisbeing
projectedintheview.ArcViewusesthemapunitssengtodeterminethecorrectscaleof
yourview.IfMapUnitsarenotsetcorrectly,thescaleArcViewdisplaysforyourviewmaybe
incorrect,andArcViewwon’tknowhowlargetodrawyourviewifyouspecifyascaleforyour
view
• ClickViewonthemenubartopulldownthe“View”menu.ThenclickProperes
toopenthe“ViewProperes”window.
• SelectMetersinMap UnitsandKilometersfromDistance Unit.
• ThenclickOK (SeeFig.7.1).
Fig. 7.1
2. Set Map Units
3. Scale will appear here
1. Click View and select
Properes
17
User’sGuidetoArcView3.3forLandUsePlannersinPualamDistrict
8. Labelling the Map
ArcViewhasthreewaysforyoutolabelthefeaturesinthetheme.
1. Interacvely posion and enter your own text
• ChoosethetexttoolfromtheStandard tool bar.
• Posionandclickthecursoronyourviewwhereyouwantyourtexttobegin.
• TypeyourtextintotheTextProperesdialogandclickOK.(SeeFig.8.1)
Fig. 8.1
2. Interacvely posion a label based on an aribute value
• Makethethemethatcontainsthefeaturesyouwanttolabelacvebyclickingon
itinthetableofContents.
• FromtheThememenuchooseProperes.
• ChoosetheText Labels iconintheTheme Properesdialog.
• Choosetheeld thatcontainsthevaluesyouwanttouseaslabelsandthenclick
OK.
• SelecttheLabeltool.
• Click
onthefeatureyouwanttolabel.Thelabelappearswhereyouclicked.
• Choose
theStop EditfromThemeMenuandSavetheEditoftheTheme.(See
Fig.8.2)
1. Select Text
3. Type of Name of the feature or place here
2. Click on the Map Text
User’sGuidetoArcView3.3forLandUsePlannersinPualamDistrict
18
Fig. 8.2
3. Automacally label some or all features
Youcanlabelallfeaturesorjustselectedfeaturesforanacvetheme.
• ClickonAuto-labelfromtheThememenu.
• SelectAuto-labeleitherallthefeaturesoftheacvethemeoraselectedsetof
features.(SeeFig.8.3)
Fig. 8.3
2. Select Text Labels
3. Select the eld Type
1. Select Properes
3. Click OK
2. Select the Field that you
want to label
1. Select Auto Label
19
User’sGuidetoArcView3.3forLandUsePlannersinPualamDistrict
9. Creang a map Layout
Producing the output of your work is one of the end product in GIS work. A layout is a
documentwhichcolleconofmapelementslaidoutandorganizedonapage.Commonmap
elementsincludeoneormoredataframeseachcontaininganorderedsetofmaplayers,a
scalebar,northarrow,maptle,descripvetext,andalegend.Layoutviewiswhereyouadd
mapsurrounds,frames,gracules, andothernishing touchestoamap.Itcanthendraw
thoseobjectstothescreen,sendthemtoaprinter,andsendthemtooneofseveralstandard
graphicsleformats.
Step 1
• ChooseLayout fromViewMenu.
• SelectPagePaern(e.g. Landscape, Portrait.)
• ClickOK.
• Click
onNewLayout.(SeeFig.9.1)
Fig. 9.1
Step 2
Seng the layout page size and orientaon
When
youwanttocreateamapusingalayoutyouwillneedtodenesomecharacteriscs
ofthelayoutpage.Theseinclude:pagesize,pageunits,orientaon,andmargins.(SeeFig.
10.2)
Page size
Ther
eareanumberoflargeandsmallformatsizesprovidedbydefaultinArcView.Ifyou
needasizeotherthanthese,youcanuseacustompagesizeanddeneitswidthand
height.Thedefaultpagesizeisderivedfromyourprinter.
4. Select Layout
3. Click OK
2. Select Page Paern
1. Select Layout
User’sGuidetoArcView3.3forLandUsePlannersinPualamDistrict
20
Page units
Selectpageunitsfromalistofchoices.Thedefaultpageunitsareinches.
Orientaon
Choosebetweenlandscapeandportraitorientaonforthelayoutpage.Thedefault
orientaonisderivedfromyourprinter.Ifyouchangetheorientaon,anynewlayoutswill
usetheneworientaonasthedefault.
Margins
Denemarginsforthepageoruseyourprinter’sdefaultmargins.
Output resoluon
Denestheresoluonthelayoutisprintedandexported
Fig. 9.2
Layout page size
Layout page Units orientaon
Layout page orientaon
Layout page margins orientaon
Layout Out put resoluon
21
User’sGuidetoArcView3.3forLandUsePlannersinPualamDistrict
10. Adding Map elements to the layout
Step 1
Scale
Sc
alebarsarecontainedwithinframesinthelayout.Whenyoucreateascalebarframe,it
isassociatedwithaviewframe.Iftheviewframeislivelinked,andthescaleoftheviewis
changedbyzoominginorout,thescalebarwillupdateaccordingly.
• Select
Scale Bar FramefromToolBar(SecondBuonformRightwithRulerSign).
• DragontheView.
• SelecttheView Frame.
• SelectKilometersfromUnits.
• Click
OK. (SeeFig.10.1)
Fig. 10.1
Step 2
Title
• Select
theTexttool.
• Clickwhereyouwantyourtexttobegin.
• TypeyourtextintheText Properes dialogandclickOK (SeeFig.10.2).
1. Select Scale bar frame
2. Select View Frame
3. Select Map Scale