Microsoft SQL Server 2008 R2 Unleashed- P13 ppt
Bạn đang xem bản rút gọn của tài liệu. Xem và tải ngay bản đầy đủ của tài liệu tại đây (789.35 KB, 10 trang )
ptg
74
CHAPTER 4 SQL Server Management Studio
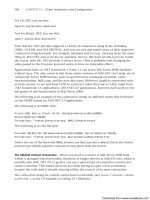
FIGURE 4.7 Scripting from administrative dialogs.
schema that it belongs to, or the date on which it was created. Again, for those who deal
with large databases and thousands of database objects, this feature is very helpful.
Administrators also find the enhanced scripting capabilities in the Object Explorer very
useful. The scripting enhancements are centered mostly on the administrative dialog
boxes. These dialogs now include a script button that allows you to see what SSMS is
doing behind the scenes to effect your changes. In the past, the Profiler could be used to
gather this information, but it was more time-consuming and less integrated than what is
available now.
Figure 4.7 shows an example of an administrative dialog, with the scripting options
selected at the top. You can script the commands to a new query window, a file, the
Windows Clipboard, or a job that can be scheduled to run at a later time.
Aside from these features, many of the features and much of the functionality associated
with the Object Explorer is similar to what was found in SQL Server 2000 and is almost
identical to what was found in SQL Server 2005. Keep in mind that there are some addi-
tional nodes in the Object Explorer tree and that some of the objects are located in differ-
ent places. For example, the
Management node now contains nodes for Policy Management,
Data Collection, and the Resource Governor, which are all new in SQL Server 2008.
Download from www.wowebook.com
ptg
75
Administration Tools
4
FIGURE 4.8 A Disk Usage Object Explorer Details report.
One often-overlooked Object Explorer feature is the reports option that was added in SQL
Server 2005 and still exists in SQL Server 2008. This option is available by right-clicking
on a node in the Object Explorer. Reports are not available for every node in the Object
Explorer tree, but many of them do have this option. Most reports are found in the top-
level nodes in the tree. For example, if you right-click on a database in the Object Explorer
tree and then select Reports and Standard Reports, you see more than a dozen available
reports. These reports include Disk Usage, Backup and Restore Events, Top Transactions by
Age, and a host of others. Graphs are included with some reports, and you can export or
print all these reports. Figure 4.8 shows an example of the Disk Usage report for the
AdventureWorks2008 database.
The graphs are easy to read, and some sections of the report can be expanded to provide
more detail. Bullets at the bottom of a report are nodes that can be expanded. For
example, the bullet Disk Space Used by Data Files at the bottom of Figure 4.8 can be
expanded to display details about each of the data files.
Activity Monitor
The Activity Monitor has seen some dramatic changes in SQL Server 2008. These changes
build on the foundation established in SQL Server 2005 and help provide much more
information related to the performance of your SQL Server instance.
Before we get into the details of the Activity Monitor, let’s make sure you know where to
find it. It is no longer found in the Management node of the Object Explorer. Instead, you
right-click on the name of the server instance in the Object Explorer, and you see a selec-
tion for Activity Monitor.
Download from www.wowebook.com
ptg
76
CHAPTER 4 SQL Server Management Studio
FIGURE 4.9 SQL Server 2008 Activity Monitor.
When the Activity Monitor launches, you see a new display with four different graphs, as
shown in Figure 4.9. The graphs include % Processor Time (from SQL Server), Waiting
Tasks, Database I/O and Batch Requests. These graphs give you a quick performance snap-
shot for your SQL Server in one spot without having to launch System Monitor or some
other monitoring tool to view this kind of information.
You also find more detailed performance information below the graphs. This information
is grouped into four categories: Processes, Resource Waits, Data File I/O and Recent
Expensive Queries. Clicking on the expand button for one of these categories presents the
details you are looking for. These details contain drop-down headings that allow you to
filter the results and view only the information you need.
The Processes Details window contains information similar to what was displayed in the
SQL Server 2005 Activity Monitor. These details include information similar to what is
returned with the
sp_who system stored procedure. The server process ID (SPID) is listed
in a column named Session ID, and the related information for each SPID is displayed in
the remaining columns. If you right-click on a particular process, you can see the details
of that process. You can then kill that process or launch the SQL Server Profiler to trace
the activity for the process. Figure 4.10 shows an example of the expanded Processes
details window.
The Resource Waits window (that is displayed below the Process window) can help you
identify bottlenecks on your server. It details the processes waiting for other resources on
the server. The amount of time a process is waiting and the wait category (what the
process is waiting for) are found in this display. If you click on the Cumulative Wait Time
column, the rows are sorted by this column and you can find the wait category that has
been waiting the longest. This sorting capability applies to all the columns in the display.
Download from www.wowebook.com
ptg
77
Administration Tools
4
FIGURE 4.10 Processes Details window in the Activity Monitor.
The Data File I/O window lists each database and its related database files. The amount of
disk I/O experienced by each of the files is detailed in the columns of this display. You can
isolate the database and files that are most heavily hit with read or write activity as well as
the databases that may be suffering from poor I/O response with this screen.
Finally, the Recent Expensive Queries window displays information similar to what you
can obtain using catalog views. It provides statistics for all the databases on the instance
and is a quick and easy way to find and tune expensive SQL statements. If you right-click
on a row in the display and click Edit Query Text, you can see the entire SQL text associ-
ated with the query. You are able to click on one of the column headings such as CPU to
sort the display according to the metric you feel defines cost. Best of all, you can right-
click on a row and choose Show Execution Plan, and you have the Query Plan ready for
analysis.
NOTE
When you mouse over the column headers in the detailed windows, ToolTips give you
more information about the columns. This information includes the system view that
the information is gathered from and where you can look in Books Online to obtain fur-
ther information.
Log File Viewer
The Log File Viewer is another nonmodal window that is essential for administering your
SQL Server. Like the Activity Monitor, it houses information that was previously displayed
in the document window in the SQL Server 2000 Enterprise Manager. It can display log
files that are generated from several different sources, including Database Mail, SQL Server
Agent, SQL Server, and Windows NT.
Download from www.wowebook.com
ptg
78
CHAPTER 4 SQL Server Management Studio
FIGURE 4.11 SQL Server logs displayed in the Log File Viewer.
The Log File Viewer can be launched from the related node in the SSMS Object Explorer.
For example, you can select the Management node and expand SQL Server Error Logs. If
you double-click one of the error logs listed, a new Log File Viewer window is launched,
displaying the SQL Server log file entries for the log type selected (see Figure 4.11).
NOTE
By default, entries are shown in the SQL Server Log File Viewer from newest to oldest.
This is different from the default order in the SQL Server 2000 Enterprise Manager,
which displayed the log file entries from oldest to newest.
Download from www.wowebook.com
ptg
79
Administration Tools
4
One of the first things you notice when you launch the Log File Viewer is that a tree struc-
ture at the top-left corner of the screen shows the log files you are viewing. You can see
that there are four different log types available: Database Mail, SQL Agent, SQL Server, and
Windows NT. You can choose to display multiple log files within a given log type (for
example, the current SQL Server log and Archive #1), or you can select logs from different
sources. For example, you can display all the current log entries for SQL Server and the
current log entry for the SQL Server Agent.
When multiple logs are selected, you can differentiate between the rows shown on the
right side of the Log File Viewer by looking at the Log Source column and the Log Type
column. The Log Source values match up with the names shown in the tree structure
where the log was selected. The Log Type column shows the type of log, such as SQL
Agent or SQL Server. Rows from the different log types are displayed together and sorted
according to the date on which the row was created. The sort order cannot be changed.
TIP
You can rear ra ng e the o rder of the columns shown in the Log F ile V iewer. You simply
click the column header and drag the column to the desired location. When you are
viewing rows for more than one log type or multiple logs, it is best to drag the Log Type
and Log Source columns to a location that is easily viewed so that you can distinguish
between the entries.
Other noteworthy features in the Log File Viewer include the capability to filter and load a
log from an external source. You can filter on dates, users, computers, the message text,
and the source of the message. You can import log files from other machines into the view
by using the Load Log facility. This facility works hand-in-hand with the Export option,
which allows you to export the log to a file. These files can be easily shared so that others
can review the files in their own Log File Viewer.
SQL Server Utility
The SQL Server Utility was added in SQL Server 2008 R2 and is geared toward multiserver
management. It provides several new hooks in the SSMS environment that improve visi-
bility and control across multiple SQL Server environments. Access to these new hooks is
provided through a new Utility Explorer that can be displayed within your SSMS environ-
ment. This Utility Explorer has a tree-like structure similar to the Object Explorer, and it
provides rich content related to the health and integrity of the SQL Server environments
you have selected to manage using the SQL Server Utility. Figure 4.12 shows an example
of the type of information the Utility Explorer can display.
Download from www.wowebook.com
ptg
80
CHAPTER 4 SQL Server Management Studio
FIGURE 4.12 Utility Explorer content.
The SQL Server Utility must first be configured to facilitate the display of information in
the Utility Explorer. The configuration is relatively straightforward, but you must meet
several requirements before starting it. The following requirements apply to the utility
control point (UCP), which is the SQL Server instance capturing the information and the
SQL Server instances being managed by the UCP:
. SQL Server must be version 10.50 or higher.
. The SQL Server instance type must be Database Engine.
. The SQL Server Utility must operate within a single Windows domain or domains
with two-way trust relationships.
. On Windows Server 2003, the SQL Server Agent service account must be a member
of Performance Monitor User group.
. The SQL Server service accounts on the UCP and all managed instances of SQL
Server must have read permission to Users in Active Directory.
Download from www.wowebook.com
ptg
81
Administration Tools
4
FIGURE 4.13 Utility Configuration Steps.
In addition, the UCP must be running the Data Center, Developer, or Enterprise Edition of
SQL Server.
When you have met these requirements, you are ready to start using the SQL Server
Utility. The first steps are to establish a UCP and to enroll SQL Server instances for the
UCP to manage. This is accomplished by selecting View on the SSMS menu bar and then
selecting Utility Explorer. A content pane is displayed in SSMS that contains options for
configuring the SQL Server Utility (see Figure 4.13). It also contains links to video that can
guide you through each step.
The first thing to do when configuring the SQL Server Utility is to click on the Create a
Utility Control Point (UCP) link on the Getting Started tab. This initiates a wizard that
will guide you through a five-step process that creates the UCP. The first wizard screen
that outlines these steps is shown in Figure 4.14.
Download from www.wowebook.com
ptg
82
CHAPTER 4 SQL Server Management Studio
FIGURE 4.14 Create Utility Control Point Wizard screen.
The first step of the wizard is the most critical because you choose the SQL Server Instance
that will be the UCP. The SQL Server instance you select in this step will store the infor-
mation related to the UCP and any other instances enrolled within that UCP. The infor-
mation collected by the UCP is stored in a database named sysutility_mdw created on the
UCP instance. This database drives the health and status information displayed in the
Utility Explorer.
After you complete the wizard steps to create a UCP, the UCP appears in the Utility
Explorer Tree, and summary information about the UCP is displayed in the Utility
Explorer Content tab. The UCP is the top-most node in the tree and contains other child
nodes that contain the different types of information managed by the UCP. An example of
the Utility Explorer tree is shown in Figure 4.15.
The first child node displayed in the Utility Explorer tree is named Deployed Data-tier
Applications. A data-tier application, or DAC, is a single entity that contains all the data-
base objects and related instance objects used by an application. This includes tables, stored
procedures, SQL Server Logins, and so on. DACs can be created from a Visual Studio 2010
data-tier application project or by using the Extract Data-Tier Application Wizard in SSMS.
The full scope of DAC capabilities is beyond the scope of this chapter, but it is important to
see how they fit into the Utility Explorer Display.
Download from www.wowebook.com
ptg
83
Administration Tools
4
FIGURE 4.15 Utility Explorer tree.
NOTE
Two diff er ent SQL Ser ver features use the same DAC acronym. The aforementioned
data-tier application is one of them, but a dedicated administrator connection is also
referred to as a DAC.
After creating a DAC deployment package, you can deploy it to another SQL Server
instance. This deployment creates the related database, the database objects along with
the related server objects. If the server to which the DAC is deployed is managed by the
UCP, you can show the deployed DAC information by clicking on the Deployed Data-
tier Applications node of the Utility Explorer.
The next node in the Utility Explorer tree, named Managed Instances, contains informa-
tion about SQL Server instances enrolled in the UCP. Enrolling an instance essentially
means you want to manage the instance through the UCP and gather information about
it. You can easily enroll this instance by right-clicking on the Managed Instances node
and selecting Enroll Instance.
Each instance enrolled in the UCP is listed at the top of the Utility Explorer Content tab.
When a managed instance is selected from this list, a set of resource and policy informa-
tion is made available in the lower half of the window. The available tabs in this window
which define the type of information that is captured include CPU Utilization, Storage
Utilization, Policy Details and Property Details. Figure 4.16 shows two managed instances
and the related CPU Utilization graphs for the top-most SQL Server instance.
The last node, Utility Administration, can be used to manage policy, security, and data
warehouse settings for a SQL Server Utility. These settings drive the SQL Server Utility
summary screen and set thresholds across the entities defined in the utility. Figure 4.17
shows an example of the Policy information that can be managed with Utility
Administration.
Download from www.wowebook.com