Microsoft SQL Server 2008 R2 Unleashed- P151 ppt
Bạn đang xem bản rút gọn của tài liệu. Xem và tải ngay bản đầy đủ của tài liệu tại đây (381.68 KB, 10 trang )
ptg
1444
CHAPTER 39 Monitoring SQL Server Performance
USE msdb;
GO
EXEC dbo.sp_syscollector_disable_collector;
GO
EXEC dbo.sp_syscollector_enable_collector;
GO
To force the running of a noncached collection set and have it upload to the MDW for
collection sets configured in noncached collection mode, use the
sp_syscollector_run_collection_set system procedure:
sp_syscollector_run_collection_set
[[ @collection_set_id = ] collection_set_id]
, [[ @name = ] ‘name’ ]
You can pass either the collection set ID or the collection name. When you are passing
one, the other parameter can be
NULL:
USE msdb;
GO
EXEC sp_syscollector_run_collection_set @name = ‘Disk Usage’
go
To force a manual update of a cached mode Data Collector, you can use the
sp_syscollector_upload_collection_set procedure:
USE msdb;
GO
EXEC sp_syscollector_upload_collection_set @name = ‘Server Activity’
go
To stop or start a specific collector set, you can use the
sp_syscollector_start_collection_set and sp_syscollector_stop_collection set
stored procedures:
USE msdb;
GO
EXEC dbo.sp_syscollector_stop_collection_set @name = ‘Disk Usage’
GO
EXEC dbo.sp_syscollector_start_collection_set @name = ‘Disk Usage’
GO
To modify a collection set, you can use the sp_syscollector_update_collection_set
procedure. The syntax is as follows:
sp_syscollector_update_collection_set
[ [ @collection_set_id = ] collection_set_id ]
, [ [ @name = ] ‘name’ ]
, [ [ @new_name = ] ‘new_name’ ]
ptg
1445
Performance Monitoring Tools
39
, [ [ @target = ] ‘target’ ]
, [ [ @collection_mode = ] collection_mode ]
, [ [ @days_until_expiration = ] days_until_expiration ]
, [ [ @proxy_id = ] proxy_id ]
, [ [ @proxy_name = ] ‘proxy_name’ ]
, [ [ @schedule_uid = ] ‘schedule_uid’ ]
, [ [ @schedule_name = ] ‘schedule_name’ ]
, [ [ @logging_level = ] logging_level ]
, [ [ @description = ] ‘description’ ]
If the collection set is running, the only options you can modify are the schedule_uid and
description. You need to stop the collection set with sp_syscollector_stop_collection_set
first to change other options like the collection-mode or days_until_expiration. For
example, the following code changes the number of days to retain collection set data to
seven days for the Server Activity collection set:
USE msdb;
GO
EXEC dbo.sp_syscollector_stop_collection_set @name = ‘Disk Usage’
GO
EXEC dbo.sp_syscollector_update_collection_set
@name = N’Server Activity’,
@days_until_expiration = 7;
GO
EXEC dbo.sp_syscollector_start_collection_set @name = ‘Disk Usage’
GO
To view information about the configured collection sets, you can run a query on the
syscollector_collection_sets table similar to the following:
select collection_set_id as ID,
cast (scs.name as varchar(20)) as name,
is_running as ‘running’,
case collection_mode when 0 then ‘cached’
else ‘noncached’ end as coll_mode,
days_until_expiration as retntn,
cast (s.name as varchar(30)) as schedule
from syscollector_collection_sets scs
inner join
sysschedules s
on scs.schedule_uid = s.schedule_uid
go
ID name running coll_mode retntn schedule
2 Server Activity 1 cached 7 CollectorSchedule_Every_15min
3 Query Statistics 1 cached 14 CollectorSchedule_Every_15min
ptg
1446
CHAPTER 39 Monitoring SQL Server Performance
4 Utility Information 1 noncached 1 CollectorSchedule_Every_30min
1 Disk Usage 1 noncached 730 CollectorSchedule_Every_6h
There are other informational views you can use to view the data collection configuration:
To display the location of the temporary cache and the MDW
select * From syscollector_config_store
go
parameter_name parameter_value
CacheDirectory D:\SQL2008\DCTemp
CacheWindow 1
CollectorEnabled 1
MDWDatabase UnleashedMDW
MDWInstance LATITUDED830-W7\PERFDW
To display the data collection capture and upload
information from the execution log
select * From syscollector_config_store
go
select csc.name as collection_set, start_time
From syscollector_execution_log sel
inner join
syscollector_collection_sets csc
on sel.collection_set_id = csc.collection_set_id
order by csc.name, start_time
go
You can also use the stored procedures, functions, and views that are provided to create
your own end-to-end data collection scenarios.
Creating a Customized Data Collection Set
Although you cannot change or delete the built-in system Data Collectors, you can define
your own custom data collection sets. However, currently, you can define them only in T-
SQL. There are four different collector types that you can use to build a collector set:
. T-SQL query—Executes a user-provided T-SQL statement as an input parameter,
saves the output from the query, and then uploads the output to the management
data warehouse.
. SQL Trace—Uses SQL Trace to monitor the SQL Server Relational Engine, with trace
data coming from the system default trace or from one or more custom traces.
. Performance counters—Collects specific performance counter information from
Windows Performance Monitor on the computer running SQL Server 2008.
. Query activity—Collects query statistics and query activity information along with
the query plan and query text for queries that meet predefined criteria. Essentially,
this collector type collects the same information as the Query Statistics collection
ptg
1447
Performance Monitoring Tools
39
set, so it is recommended that you simply use the predefined Query Statistics
collection set.
One of the reasons you might create a customized data collection set is that the default
system Data Collector for Query Statistics does not store all the statements. It captures
only the worst-performing queries based on the algorithms specified in the collection set.
You might want to collect more queries than the top three worst performing ones.
However, if you create your own data collection for query statistics, you should probably
disable the default system collector to reduce data collection overhead.
This chapter shows how to create a custom collection set to monitor a few Performance
Monitor counters.
TIP
To see an example of a collection set based on performance counters, DMVs, and T-
SQL queries, you can look at the definition of the default Server Activity collection set.
You can easily see this definition by right-clicking on Server Activity in the System
Data
Collection Sets folder in SSMS and selecting Script Data Collection.
There is also GUI support for creating a collection set based on a SQL Server Profiler
trace. After you define a trace in SQL Server Profiler with the events you want to cap-
ture, select Export from the File menu; then choose Script Trace Definition and select
For SQL Trace Collection Set. Doing so generates a T-SQL script that you can use to
create a custom Data Collector Set based on a SQL Server Profiler Trace definition.
Assuming you’ve already set up your MDW, you can begin by creating the data collection
set and adding the collection items you want it to contain. To create the data collection
set, use the
sp_syscollector_create_collection_set procedure. Next, you need to create
the
collection_items to indicate what information you want the collection set to collect.
If you are creating collection items for Performance Monitor counters, The Performance
Counter collector type takes three input parameters:
. Objects—The SQL Server objects running in an instance of SQL Server
. Counters—The counters associated with a SQL Server object
. Instances—The instances of the specified object
Some input parameters support wildcard characters, which enable you to include multiple
counters in a single statement. However, you can use wild cards only at the Counters and
Instances levels and, even then, only at the beginning of the string (for example,
’*
Processor’) or at the end of the string (for example, ’Memory *’).
An example of the creation of custom collection set for capturing information for the
Logical Disk and Process Performance Monitor counters is shown in Listing 39.1.
ptg
1448
CHAPTER 39 Monitoring SQL Server Performance
LISTING 39.1 Creating a Custom Collection Set
Use msdb
go
Declare @collection_set_id_1 int
Declare @collection_set_uid_2 uniqueidentifier
EXEC [dbo].[sp_syscollector_create_collection_set]
@name=N’Disk I/O Perf and SQL CPU’,
@collection_mode=1, — non-cached
@description=
N’Collects logical disk performance counters and SQL Process CPU’,
@target=N’’,
@logging_level=0,
@days_until_expiration=7,
@proxy_name=N’’,
@schedule_name=N’CollectorSchedule_Every_5min’,
@collection_set_id=@collection_set_id_1 OUTPUT,
@collection_set_uid=@collection_set_uid_2 OUTPUT
Select collection_set_id_1=@collection_set_id_1,
collection_set_uid_2=@collection_set_uid_2
/********************************************
** Now, create the desired collection items
*********************************************/
Declare @collector_type_uid_3 uniqueidentifier
Select @collector_type_uid_3 = collector_type_uid
From [dbo].[syscollector_collector_types]
Where name = N’Performance Counters Collector Type’;
Declare @collection_item_id_4 int
EXEC [dbo].[sp_syscollector_create_collection_item]
@name=N’Logical Disk Collection and SQL Server CPU’,
@parameters=N’<ns:PerformanceCountersCollector xmlns:ns=”DataCollectorType”>
<PerformanceCounters Objects=”LogicalDisk”
Counters=”Avg. Disk Bytes/Read”
Instances=”*” />
<PerformanceCounters Objects=”LogicalDisk”
Counters=”Avg. Disk Bytes/Write”
Instances=”*” />
<PerformanceCounters Objects=”LogicalDisk”
Counters=”Avg. Disk sec/Read”
Instances=”*” />
<PerformanceCounters Objects=”LogicalDisk”
ptg
1449
Performance Monitoring Tools
39
Counters=”Avg. Disk sec/Write”
Instances=”*” />
<PerformanceCounters Objects=”LogicalDisk”
Counters=”Disk Read Bytes/sec”
Instances=”*” />
<PerformanceCounters Objects=”LogicalDisk”
Counters=”Disk Write Bytes/sec”
Instances=”*” />
<PerformanceCounters Objects=”Process”
Counters=”% Privileged Time”
Instances=”sqlservr” />
<PerformanceCounters Objects=”Process”
Counters=”% Processor Time”
Instances=”sqlservr” />
</ns:PerformanceCountersCollector>’,
@collection_item_id=@collection_item_id_4 OUTPUT,
@frequency=5,
@collection_set_id=@collection_set_id_1,
@collector_type_uid=@collector_type_uid_3
Select @collection_item_id_4
Go
After you create the collection set, you can start this data collection, either through SSMS
(your user-defined collection sets will be listed directly within the
Data Collection node)
or with the following stored procedure call:
Declare @collection_set_id int
select @collection_set_id = collection_set_id
from syscollector_collection_sets
where name = ‘Disk I/O Perf and SQL CPU’
EXEC sp_syscollector_start_collection_set
@collection_set_id = @collection_set_id
go
Because there aren’t any custom reports available for displaying the results of the custom
collection set just defined, you need to run a query in the MDW database to view the
collected Performance Monitor counter values. A sample query (which could serve as the
basis for a customer report) is provided in Listing 39.2.
ptg
1450
CHAPTER 39 Monitoring SQL Server Performance
LISTING 39.2 Querying the MDW for Custom Data Collection Values
Use UnleashedMDW
Go
select spci.path as ‘Counter Path’, spci.object_name as ‘Object Name’,
spci.counter_name as ‘counter Name’, spci.instance_name,
spcv.formatted_value as ‘Formatted Value’,
spcv.collection_time as ‘Collection Time’,
sii.instance_name as ‘SQL Server Instance’
from snapshots.performance_counter_values spcv
inner join
snapshots.performance_counter_instances spci
on spcv.performance_counter_instance_id = spci.performance_counter_id
inner join
core.snapshots_internal si
on si.snapshot_id = spcv.snapshot_id
inner join
core.source_info_internal sii
on sii.source_id = si.source_id
where
sii.collection_set_uid = ‘5D9849BE-1526-4159-99EB-6B0E690C31EA’
order by spcv.collection_time desc
It is possible to create your own custom reports using SQL Server Reporting Services that
query the information for your custom collection sets in the MDW database. For more infor-
mation on creating custom reports, see Chapter 53, “SQL Server 2008 Reporting Services.”
Data Collector Limitations and Recommendations
Although the Data Collector is a great start to a built-in performance monitoring tool, it
does have some limitations still, which are not wholly unexpected in a product that’s still
early in its release cycle. One key limitation is the limited number of built-in data
providers and the reports available. It is hoped that future versions will make it easier to
extend the Data Collector to add additional collection sets and reports.
If you are defining your own custom Data Collectors, consider these recommendations:
. Combine multiple performance counter or query collection items into a single
collection item wherever possible.
. Combine collection items into a single collection set whenever possible unless you
need separate data retention periods or different collection schedules for the collec-
tion items.
. If you collect data frequently, it is more efficient to run the collection set in cached
collection mode than starting and stopping a new process every time new data must
be collected. In cached collection mode, the collection process runs continuously. As
a general rule, if you will be capturing data every five minutes or less, consider using
a collection set that runs in cached collection mode.
ptg
1451
Performance Monitoring Tools
39
. If you are collecting data less frequently than every five minutes, using noncached
mode is more efficient than leaving a generally idle process running all the time.
. Although the collection frequency for cached collection sets can be set to run as fre-
quently as every five seconds, be aware that more frequent collection has corre-
spondingly high overhead. Always choose the lowest collection frequency that will
meet your needs.
Currently, removing data collection after it has been configured is not supported. You can
disable data collections but cannot remove them or the SSIS packages and jobs associated
with them after they have been defined. Attempting to manually remove data collection
may lead to errors if you try to re-implement data collection in the future. In addition,
you should not drop or change the name of the MDW database because all the jobs are
based on the original database name.
Another key limitation in the Data Collector is the lack of built-in alerting in the event
that certain performance thresholds are crossed while monitoring the system. In contrast,
the SQL Server Utility, which performs more limited monitoring and data capture than
the Data Collector, does provide a threshold and alerting mechanism.
SQL Server Utility
SQL Server 2008 R2 introduces a new multiserver management tool named the SQL Server
Utility. This new tool takes performance monitoring in SQL Server to the next level by
providing the capability to monitor specific performance metrics for one or more SQL
Server instances in a single view from a single SQL Server instance. The performance infor-
mation is captured in a database, and you can view this information in one convenient
place from within the SSMS environment.
Some basic setup is required to start using the SQL Utility. You accomplish this basic setup
by using the new Utility Explorer available in SSMS. You click View on the SSMS menu bar
and then select Utility Explorer. This Utility Explorer has a tree-like structure similar to the
Object Explorer, and it integrates into the SSMS environment in much the same way.
NOTE
The option to view the Utility Explorer is not available if you are running a version of
SQL Server prior to SQL Server 2008 R2.
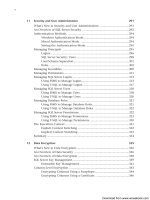
The first page displayed when you launch the Utility Explorer is shown in Figure 39.14.
This screen outlines all the utility configuration steps and is a handy launch point into
wizards that guide you through the setup process. You can also click on the Video link
next to each step to obtain further help on configuring that step.
ptg
1452
CHAPTER 39 Monitoring SQL Server Performance
These steps and the details related to configuring the Utility Explorer are covered in more
depth in Chapter 4. This chapter focuses on the performance monitoring capabilities of the
SQL Server Utility and the specific metrics available for collection. To enable these capabili-
ties, you only need to do the following:
1. Create a utility control point.
2. Connect to an existing UCP.
3. Enroll instances of SQL Server into the UCP.
The UCP is a central repository for storing configuration information and performance
data for all the instances that have been enrolled in the SQL Server Utility. Each SQL
Server Utility has only one UCP that you define by clicking on the first link listed in the
Utility Configurations Steps. A wizard guides you through the creation.
NOTE
The SQL Server Utility collection set can work side by side with non–SQL Server Utility
collection sets, such as those set up for data collection in the MDW. In other words, a
managed instance of SQL Server can be monitored by other collection sets while it is a
member of a SQL Server Utility. However, you must disable data collection while the
instance of SQL Server is being enrolled into the SQL Server Utility.
FIGURE 39.14 Utility Configuration Steps.
ptg
1453
Performance Monitoring Tools
39
In addition, after the instance is enrolled with the UCP, when you restart the non–SQL
Server Utility collection sets, all collection sets on the managed instance upload their
data to the utility management data warehouse (UMDW), sysutility_mdw.
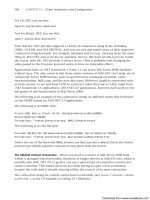
After you create the UCP, a new tab named Utility Explorer Content is displayed within the
Utility Explorer (see Figure 39.15). This Utility Explorer window is also called the SQL
Server Utility dashboard. This dashboard is the main window for viewing performance
metrics captured by the SQL Server Utility. The information displayed on this screen imme-
diately after creating the UCP is the performance information for the UCP itself. Each UCP
is automatically a managed instance and thus has performance data collected for it.
The following four performance utilization metrics are captured by the SQL Server Utility
and displayed on the Utility Explorer Content screen:
. CPU utilized by the SQL Server instance
. Database file utilization
. Storage volume utilization
FIGURE 39.15 SQL Server Utility dashboard.