Lecture Notes in Computer Science- P5 pps
Bạn đang xem bản rút gọn của tài liệu. Xem và tải ngay bản đầy đủ của tài liệu tại đây (228.84 KB, 5 trang )
10 H L. Liao and H P. Lu
research in online learning [21] and online shopping [20] revealed that perceived ease
of use was not a good predictor of intention to use. Further research on the application
of TAM in different environments is necessary.
2.2 The Perceived Characteristics of Innovating (PCI) Constructs
Rogers [27] identified attributes of innovation that are fundamental to acceptance
behavior including relative advantage, complexity, compatibility, trialability and
observability. Based on the work of Rogers and others, Moore and Benbasat [23]
expanded the innovation characteristics into seven constructs, and developed an in-
strument to measure the perceptions. These constructs are relative advantage, ease of
use, compatibility, image, result demonstrability, visibility and trialability.
The first PCI construct, namely relative advantage, presents the degree to which a
potential adopter considers the innovation as providing an advantage over previous
ways of performing the same task. The second construct, ease of use, is similar to
Rogers’ concept of complexity [27], and captures the extent to which a potential
adopter considers the use of the target system to be free of effort [13]. Moore and
Benbasat’s construct of compatibility is consistent with that of Rogers: “the level to
which an innovation is perceived as being consistent with the existing values, needs,
and past experiences of potential adopters.”[23].
Moore and Benbasat [23] indicated that the image construct, which is a part of rela-
tive advantage in Rogers’ framework, can independently predict innovation use. The
image construct denotes the perception when using an innovation in terms of improv-
ing the social status of the potential adopter. Furthermore, Rogers’ attribute of ob-
servability is divided into two constructs of result demonstrability and visibility,
defined respectively as “the tangibility of the results of using an innovation” and “the
extent to which potential adopters see the innovation as being visible in the adoption
context”. Finally, trialability denotes the perception of potential adopters of an oppor-
tunity to try the innovation before committing to its use.
Research in PCI reveals that individuals’ perceptions about the characteristics of an
innovation significantly influence their acceptance behavior. Such discussion on per-
ceptions has been persistent in research literature in system use [13], [23] and use
intentions [3], [16], [33], [34], [37]. Based on the constructs proposed Moore and
Benbasat [23], Slyke et al. [33] studied factors that may influence consumers’ deci-
sion to engage in Web-based shopping, and found that perceived compatibility has the
strongest impact on intention of use, followed by perceived complexity, relative ad-
vantage and image. Ilie et al. [37] added to the understanding of adoption and use of
instant messaging by examining gender differences in perceived innovation character-
istics. Different patterns were discussed in their study. For females, perceived ease of
use and visibility were significant predictors of intention to use, while for males, per-
ceived relative advantage, ease of use and result demonstrability were significant.
These studies confirmed the innovation characteristics identified by Rogers [27] and
by Moore and Benbasat [23]. They explained technology adoption behavior in specific
technology contexts, and produced inconsistent results in terms of salient perception
factors. Tornatzky and Klein [32], in a meta-analysis of research on innovation charac-
teristics, found that only three innovation characteristics ─ perceived relative advantage,
perceived complexity, and perceived compatibility ─ are consistently related to innova-
tion adoption.
Richness Versus Parsimony Antecedents of Technology Adoption Model 11
2.3 TAM Versus PCI
The Technology Acceptance Model (TAM) has received considerable attention in
research into individual-level technology adoption due to its parsimony. Moreover,
the two constructs employed in TAM constitute a subset of PCI antecedents. Relative
advantage is similar to the concept of perceived usefulness of TAM. Ease of use is
also part perception of the TAM [13]. To contrast with TAM, PCI provides more
richness in modeling technology adoption decision. As an innovative learning
method, the adoption of e-learning involves the adoption of information technology
and modification of learning approach. Learners have more control over selection of
learning topics in e-learning than in learning in conventional classrooms. Hence, this
investigation compares the explanatory powers of TAM and PCI in order to under-
stand factors that may affect the intentions to continued use e-learning.
3 Research Methodology
3.1 Characteristics of the Sample and Study Context
To compare the performance between the antecedents of TAM and the PCI set, an e-
learning website was specified as a representative of the innovation of e-learning. A
survey was undertaken on students who were enrolled in a project management (PM)
course at a comprehensive university in Taiwan. Digital materials related to perform-
ing PM on Microsoft Project 2003 were developed, and could be used by students on
the e-learning website.
The system utilized in the experiments was designed explicitly for this investiga-
tion, and ran on a Pentium IV PC with a 17" monitor. Subjects applied Internet Ex-
plorer 6 to browse the teaching materials stored on a university server. Retrieval of
information, including video clips, was almost instantaneous when using this configu-
ration. The e-Learning website was developed using the
Wisdom Master, which was
developed by SUN NET Technology Corporation, and is one of the most popu-
larly adopted Learning Management System (LMS) platforms in Taiwan.
Wisdom Master is also the first software in Taiwan that conforms to the highest
standard (RTE3) of the SCORM 1.2.
The synchronous mode of teaching is not
always better than the asynchronous mode [25]. Most e-learning is conducted asyn-
chronously [11]. Therefore, an asynchronous e-learning system was developed for
this study. The high-resolution monitor enabled subjects to see clearly the facial ex-
pressions of the people in the video clips on the e-learning website.
Subjects received a one-hour, hands-on demonstration on using the e-Learning
website before the course began. Subjects could use the e-learning web system free by
connecting to the Internet from anywhere at any time. The students were asked to
complete a questionnaire survey after finishing the free 4-week course. Completion of
the survey was voluntary, and could be done outside class. A total of 137 surveys
were completed. The age range of the sample was 20–30 years old. Of the 137 re-
spondents, 59 were female (43%) and 78 were male (57%).
12 H L. Liao and H P. Lu
3.2 Instrument Development
Moore and Benbasat’s [23] questionnaire of scales of perceptions of innovation char-
acteristics was employed as the foundation for the development of the PCI instrument.
To fit the e-learning study context, the visibility construct was not considered when
constructing the PCI model. The model was composed of a total of 24 items, with
each scale comprising of a minimum of two items. The original items proposed by
Davis [12] were utilized for the TAM constructs. The “ease of use” construct of PCI
is part of the TAM [3]. Hence, the items of perceived ease of use were not repeatedly
listed in the questionnaire. Additionally, the intention of continued use was assessed
with three items built following the recommendations of Agarwal and Prasad [3] to
assess future usage intentions.
The measures of both models were modified to fit the e-learning websites contexts.
The items were operationalized to evaluate the learners’ perceptions of the e-learning
website and the new learning approach. Respondents scored on a seven-point Likert-
type scale with the end-points as “strongly disagree” and “strongly agree”, except for
items intended to collect demographic data.
4 Analysis and Results
Both research models were measured with the partial least squares (PLS) structural model-
ing analysis approach. PLS is appropriate for predicting highly complex models [7] and
maximizing the variance explained for the constructs in a model [9]. Moreover, the sample
size in the study was smaller than the minimum recommended for structural modeling
approaches [8]. Therefore, the TAM and PCI models were selected and tested with PLS.
4.1 Measurement Model
The TAM and PCI measurement models were tested for estimated construct reliabil-
ities, convergent validities and discriminant validity of instruments [6], [9], [18].
Table 1 presents the numbers of items, means, standard deviations and reliabilities of
the constructs of TAM and PCI. All reliability measures were 0.8 or above. The al-
pha-level of the sample indicates a reasonable level of reliability (〈>0.70) [24], reveal-
ing adequate internal consistency.
Table 1. Construct Means, Standard Deviations, and Reliabilities
Model Construct
Number
of Items
Mean
Standard
Deviation
Cronbach
Alpha
TAM
Perceived Ease-of-Use
Perceived Usefulness
4
6
4.936
4.653
0.792
1.063
0.868
0.946
PCI
Relative Advantage
Ease of Use
Compatibility
Image
Result Demonstrability
Trialability
5
4
3
3
4
2
4.817
4.936
4.609
3.897
4.950
4.549
0.845
0.792
0.942
1.362
0.745
0.992
0.932
0.868
0.917
0.962
0.884
0.844
Intention to Continued use 3 4.792 1.051 0.951
Richness Versus Parsimony Antecedents of Technology Adoption Model 13
Table 2 shows the each variable’ the square root of AVE and intercorrelations,
ranging from 0.159 to 0.650. Convergent validity of the instrument is appropriate
when the constructs have an average variance extracted (AVE) of at least 0.5 [15].
The square root of AVE should exceed the intercorrelations for satisfactory discrimi-
nant validity [6]. The AVE for every construct is larger than the correlation between
the construct and other constructs in the model. Table 3 presents the factor loadings
and cross-loadings of the items measured in this investigation. All items loadings of
each construct are larger than cross-loadings of that construct with all other constructs
in two models. Hence, the convergent validity and discriminant validity in the work
were adequate.
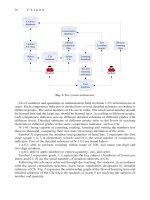
4.2 Structural Model
The result of the structural model testing includes the path coefficients and the R
2
values. The path coefficients denote the relationships between the dependent and
independent constructs. The R
2
values represent the degrees of variance explained by
the independent constructs. Figure 2 illustrates the results of the structural model for
both the TAM and PCI models. The TAM model explained variance in perceived
usefulness (R
2
=31.8%) and intention to continued use (R
2
=53.1%). However, per-
ceived ease-of-use did not significantly influence intention toward continued use. The
result is not consistent with earlier research [22], [29], [35], [38].
The PCI model accounted for 54.0% of the variance in that measure. Relative ad-
vantage (®=0.367), compatibility (®=0.239), and triability (®=0.270) significantly
affected intention to continued use. The R
2
of the PCI model was higher than the
TAM model (
R2=0.9%). Therefore, the PCI model adds a slight significance to the
prediction of intention of continued use in the e-learning context.
Table 2. Correlations and Average Variance Extracted (AVE)
1 2 3 4 5 6 7 8
1. Perceived Ease-
of-Use
0.847
2. Perceived
Usefulness
0.558**
0.889
3. Relative Ad-
vantage
0.567** 0.594**
0.888
4. Compatibility 0.650** 0.474** 0.464**
0.927
5. Image 0.274** 0.264** 0.341** 0.387
0.965
6. Result Demon-
strability
0.463** 0.551** 0.594** 0.332** 0.331**
0.901
7. Trialability 0.437** 0.538** 0.320** 0.521** 0.159 0.389**
0.931
8. Intention to
continued usage
0.484** 0.638** 0.559** 0.576** 0.280** 0.477** 0.454**
0.898
** Correlation is significant at the 0.01 level
Diagonal bolded elements are the square root of AVE.
14 H L. Liao and H P. Lu
Table 3. Factor loadings and cross-loadings
1 2 3 4 5 6 7
1. Relative
Advantage
0.924
0.882
0.891
0.864
0.879
0.488
0.590
0.470
0.455
0.518
0.441
0.451
0.419
0.359
0.396
0.205
0.251
0.353
0.353
0.344
0.613
0.534
0.513
0.458
0.545
0.339
0.362
0.312
0.225
0.182
0.587
0.621
0.548
0.450
0.467
2. Ease-of-Use
0.378
0.570
0.471
0.538
0.766
0.857
0.882
0.891
0.563
0.540
0.592
0.523
0.346
0.444
0.149
0.027
0.285
0.408
0.390
0.493
0.346
0.351
0.338
0.436
0.397
0.357
0.409
0.506
3. Compatibility
0.457
0.429
0.417
0.556
0.605
0.640
0.900
0.941
0.938
0.359
0.341
0.379
0.312
0.316
0.314
0.502
0.509
0.435
0.523
0.495
0.531
4. Image
0.326
0.324
0.312
0.269
0.233
0.259
0.405
0.355
0.369
0.948
0.975
0.973
0.277
0.355
0.335
0.100
0.183
0.170
0.225
0.248
0.248
5. Result
Demonstrability
0.556
0.492
0.571
0.452
0.349
0.461
0.271
0.275
0.358
0.304
0.244
0.344
0.920
0.885
0.899
0.292
0.343
0.425
0.436
0.388
0.516
6. Trialability
0.241
0.367
0.319
0.494
0.481
0.486
0.126
0.168
0.278
0.458
0.927
0.934
0.493
0.518
7. Intention to
Continued Use
0.609
0.524
0.496
0.513
0.440
0.454
0.578
0.563
0.530
0.267
0.254
0.281
0.506
0.451
0.437
0.519
0.416
0.360
0.989
0.866
0.799
Fig. 1. TAM versus PCI model Results