Lecture Notes in Computer Science- P7 pdf
Bạn đang xem bản rút gọn của tài liệu. Xem và tải ngay bản đầy đủ của tài liệu tại đây (954.98 KB, 5 trang )
20 Y S. Lai et al.
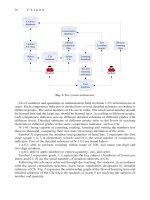
Fig. 1. The system architecture
CIs of numbers and quantities in mathematical field in Grade 1-9 Curriculum are in
order. Each competence indicator is divided into several detailed subitems according to
different grades. The serial numbers of CIs are in order. The small serial number should
be learned first and the large one should be learned later. According to different grades,
each competence indicator sets up different detailed subitems of different grades with
different levels. Detailed subitems of different grades refer to the levels of teaching
materials in different grades in the same competence indicator, such as CIs:
N-1-01: being capable of counting, reading, listening and writing the numbers less
than ten thousand, comparing their size and conversing calculation of the units.
Symbol N represents the numbers and quantities of head line, 1 represents the first
stage (grade 1 to 3 in elementary school) and 01 is the serial number of competence
indicator. Two of the detailed subitems of N-1-01 are found below:
1-n-01: able to perform counting within range of 100, and name one-digit and
two-digit numbers.
1-n-02: able to apply numbers to express quantity, size, and order.
Symbol 1 represents grade 1, n represents the key subject (Numbers) of lowercase
letter, and 01, 02 are the serial numbers of detailed subitems of CIs.
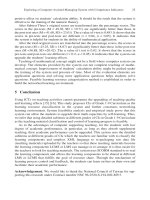
Following the advances achieved through the teaching, the students, in accordance
with the spiral curriculum structure, learn basic capabilities designated by detailed
subitems of CIs. Fig. 2 expresses the relationship graph of the flow of learning time and
detailed subitems of the CIs when the students of grade 3 are studying the subjects of
number and quantity.
Exploring a Computer-Assisted Managing System with Competence Indicators 21
N
umber and
q
uantit
y
of Com
p
etence Indicators for the first sta
g
e a
t
g
rade 3
The flow of learning time
Fig. 2. The relationship graph of the flow of learning time and detailed subitems of the CIs
2.3 System Components
Interface agent. The interface agent supplies teachers and students with a friendly and
succinct screen. The functions include: account management, authorization, and en-
quiries. After teachers register and enter the system, they can upload the teaching
elements, upload evaluation components, inquire or use every component and students’
learning conditions. After students register and enter the system, they can browse the
teaching components, accept evaluation, and check their learning conditions. Because
the contents of the category system are classified based on Competence Identifiers,
teachers and students can find the adaptive current instruction needed, progress in-
strument and evaluation elements, easily. The students can, in accordance with the
current instrumental advancement and contents, learn on the Internet and take tests to
determine their degrees of learning.
Learning component module. Learning component is a kind of outward knowledge.
Detailed subitems at different grades can be treated as knowledge map. IT management
can be applied to management. The teacher users uploads teaching and learning
components through WWW and the system classifies the teaching components up-
loaded by the teachers according to general classification standard of detailed subitems
at different grades which can avoid the complexity generated by programmed teaching
method on detailed item classification of teaching materials. The system treats the
detailed subitems at different grades of CIs in Grade 1-9 Curriculum as the base for
classification and provides unified form for the users. The teachers can surf, check and
cite the teaching components for the use of teaching and the students can check and surf
teaching components according to current teaching progress, which allows them to
acquire the expected capacities [11] [12].
Evaluation component module. Test is the most convenient method for teachers to
collect students’ competences and learning conditions in short time [13], and the
teaching evaluation should be explored from three dimensions: evaluation duration,
22 Y S. Lai et al.
level of educational goal and degree of clearness [14]. Skinner believed that strength-
ening training is the main mechanism of the organism’s learning process. When a
stimulus is presented repetitively and it can cause proper reaction, the reaction is con-
sidered to be controlled by the stimulus. The construction of stimulus control depends
on two conditions: (1) active practices: practicing several times for the right reaction;
(2) following enhancement: after practices, enhancement should be operated. The
answer of the previous question is the base of the next concept.
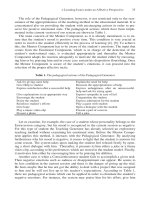
Learning feedback module. The current learning position of the student is in the
ADL. The system records the students’ learning conditions in the database to provide
evaluation items on learning effects. Fig. 3 shows that if the student could complete the
test within the expected time and achieve the skilled level, the student is considered
achieving the level of realistic development. Then, the system provides teaching
components of the Competence Indicator for the next stage, which goes into the ZPD.
The learning components provided by the system are regarded as the new framework.
In a test, if the student gives a wrong answer, the system will display an error message,
or an encouraging message if answered correctly, so that students could have feedback
immediately. It could be used as the reference of correction for continuous learning
activity. When the student fails the test, the system guides the student back to the pre-
vious Competence Indicator item.
Fig. 3. The feedback flow chart of learning and test
3 Method
3.1 Experimental Environment
After teachers sign up for an account and login the system, they can use it. When
teachers upload learning components with various file formats, the system stores them
in the course database according to the selected detailed subitems of the CIs for
teachers’ or students’ usage. Teachers select the uploading files and give detailed
subitems of CIs. Then the system stores learning components in the course database
according to detailed subitems of the CIs. When the teacher clicks the link of a com-
ponent, the system searches for the component in the database, and transmits the
Exploring a Computer-Assisted Managing System with Competence Indicators 23
component to the teacher’s computer screen. After students login the system, it pro-
vides students with a teaching material list based on their learning conditions. Students
select one of the teaching materials and the system will transmit the elements to the
students’ monitors. Fig. 4 expresses an example of students browsing learning com-
ponents. After students login the system, it provides students with an evaluation list
based on their learning conditions. Students click to accept evaluation and the system
provides students with questions in random order, and one by one. Students have to
complete all of the questions in a limited time (ex: fifteen minutes) or they have to start
from the beginning again. The system’s evaluation components adopt the selection
form, and every question can include a help file. If needed, each choice can also be
inserted into the help file.
Score
Time
Ex
p
osition
Materials sel
ection
Fig. 4. Students browse the learning component
3.2 Participants
There are thirty-two third-grade students randomly selected from an elementary school
participate in this experiment. The system provides course units for students’ practice
in number and quantity. These course units are not given yet in official programs in the
school. Students spent one hour on the practice for related courses at noon break or after
school every day. After two months, students take a test for their third-grade mathe-
matical learning effects.
3.3 Equipment
This study is to ascertain students’ learning effects with Mathematical Achievement
Test which is edited referring to Elementary Schools’ Mathematics Curriculum Stan-
dard and the guidelines of grade 3 Mathematics Instruction. The CIs range from 3-n-01
to 3-n-10. The test has two of learning categories of numbers and quantities of
24 Y S. Lai et al.
mathematics. It contains 40 questions including three parts: Subtest One for mathe-
matics concepts (13 questions), Subtest Two for arithmetic operations (14 questions),
and Subtest Three for conceptual application ability (13 questions). The test-retest
reliability of the test is 0.80 and the split reliability is 0.89. The validity of the test
accuracy was analyzed and tested by the mathematical scholars, experienced test de-
signers, and two-way testing table; therefore, it has content validity.
4 Results
This study takes statistical software package to analyze data. Data are analyzed by the
method of descriptive and inferential statistics including mean, standard deviations,
and t test. In order to compare the difference between control and experiment groups
for the system, the independent t-test is applied and the significant level is 0.05. The
mean and standard deviation of scores of the mathematical tests are listed in Table 1.
We conduct a t-test for the pre- and post-test scores in the experimental and control
groups.
Table 1. Mean (M) and standard deviation (SD) of the pre- and post-tests
Pretest Post-test
Students n Test
M SD M SD
t value
Subtest One 37.56 21.56 43.66 23.36 0.08
Grade 3 32 Subtest Two 34.38 21.36 42.34 23.92 0.00*
Subtest Three 41.60 23.01 49.38 19.71 0.04*
Total 36.88 20.42 43.25 18.87 0.02*
*α<0.05
This study adopts t statistical tests of difference of mean from two dependent sam-
ples to test whether the difference of mean between pre-tests and post-tests is equal, or
whether the difference of mean reaches statistical significance. According to the
guidance of Mathematical Achievement Test, the students’ original total test scores and
subtest scores should be transformed into percentage scores referred to normal model
when applying or interpreting the test results. The mean (M) and standard deviations
(SD) of the translated percentage scores are shown in Table 1. After Subtest One’s
original scores are transformed into percentage scores. The scores in the pre-tests (M =
43.66, SD = 23.36) are significantly better than those in the post-test ones (M = 37.56,
SD = 21.56) .The α value of t-test is 0.483. It shows that the scores in pre-tests and
post-tests are not different (t = 0.08, α > 0.05). It indicates that the system is not helpful
for students in the teaching of mathematical concepts.
After Subtest Two’s original scores are transformed into percentage scores. The scores
in the pre-tests (M = 42.34, SD = 23.92) are significantly better than those in the post-test
ones (M = 34.38, SD = 21.36) .The α value of t-test is 0.00. It shows that the scores in
pre-tests and post-tests are different (t = 0.00, α < 0.05). It indicates that the system has a