Lecture Notes in Computer Science- P89 doc
Bạn đang xem bản rút gọn của tài liệu. Xem và tải ngay bản đầy đủ của tài liệu tại đây (153.61 KB, 5 trang )
Design on Collaborative Virtual Learning Community 429
asynchronous communication. Besides, virtual learning community refers to the con-
cept of visual process chart (VPC), so that it can visualize the learning process.
4.3 Visual Process Chart (VPC)
VPC as a chart tool can display the learning process of group member or between the
group members. According to the collaborative learning, factors of affecting learner’s
learning involve group’s division, participation of group members, task distribution
and teachers’ help in time, progress test and so on. The paper illustrates one of the
factors named the participation of group members to design VPC. The measure of
learning participation contains learner’s sending message, replying message, looking
message, neglecting other factors. Each group members contribute to their group’s
online communication in certain message. In VPC, red circle presents group member
while grey circle presents a group [10]. The same group agglomerates together with
dashed Circle. As shows in figure 4, it is assigned into 3 groups in a class.
Fig. 4. Screenshot of the VPC
For example, observing the encircled part we can see there are four red circles
which stand for group members and one grey circle which presents a group. They are
around the group tightly. In VPC, the distance between circle and group circle, named
line segment (LS), points out the length of sending message. We called information
content (IC) for short. If a circle is near the group, then its IC is more, compared to far
away. Circle’s diameter implies the quantity of a learner’s average message, we called
it information degree (ID) for short. If a circle is smaller, it means the message quan-
tity is less, compared to those bigger ones. According to this, we can know the group
circle in the same way. If the grey circle is bigger, in other word, the diameter of
which is longer, the ID is bigger, compared to the smaller one. If LS between group
and class is longer, the information content is less. Therefore, students can recognize
430 W. Tan et al.
themselves clearly through VPC. The total information equals to the sum of IC and
ID. Finally, the class circle could be drawn. Following is the algorithm of VPC.
We use the kind of C pseudo code and Natural Language to describe the algorithm
of VPC chart as follows:
int totalMessage; // total information degree
int totalInformation; // total information content
int group_Count; // the amount of groups
int stu_info; //student information content
int stu_in; // student information in-degree
int stu_out; // student information out-degree
int group_info; // group information content
int group_in; // group information in-degree
Int group_out; // group information out-degree
define p; // parameters
if totalMessge>0
{
if totalInformation>0
Class_R= (totalMessage+totalInformation)*p;
Class_X=0;
Class_Y=0;
Take (Class_x, Class_Y) as circle center, Class R
as radius to draw the class circle;
if group_Count>0// Here starts to process the group
{ i=0;
while i<group_Count {
group_l=(group_info)*p;
Confirm the length of line segment according to
group IC;
group_r=(group_in+group+out)*p;
Comfirm the circle center based on the group ID;
Take group_r as radius to draw circle;
Link the group circle center and class circle cen-
ter;
j=0;
while j<stu_count {
stu_l=(stu_info)*p;
Confirm the length of line segment according to
learner’s IC;
stu_r=(stu_in+stu_out)*p;
Comfirm the circle center based on the learner’s
ID;
Take stu_r as radius to draw circle;
Link the student circle center and group circle
center;
j++;
}
i++;
}
}
Fig. 5. Pseudo code of VPC chart algorithm
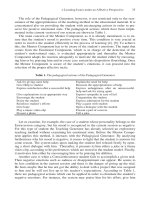
Design on Collaborative Virtual Learning Community 431
As figure 3 shows, there is a coordinate graph in down left position. It demon-
strates the performance of group’s collaborative status when a task is finished, named
collaborative performance. The result of collaborative performance is measured by
some factors of each group member, like the total information quantity, learner’s
online time and progress test. Fuzzy comprehensive evaluation is involved to calcu-
late each group member’s dynamic performance. The brief step is as follows [11]:
evaluation purpose and evaluation index should be determined firstly. Analyzing the
group member real- time learning process, the purpose is to attain feedback in time
and reach better learning way. Total information quantity, learner’s online time and
progress test are chosen as evaluation index. Then, evaluation index weight and
comment rate are confirmed to establish fuzzy relation matrix. After choosing fuzzy
operator, we use mathematical model of fuzzy comprehensive evaluation to gain the
evaluation result. Then, the result is utilized to measure the collaborative perform-
ance, the concrete method refers to the book of “The Theories and Methods of Com-
puter-Supported Cooperative Learning” [6].
(a). Evaluation of concentration magnitude.
Arithmetic average, a method of evaluating concentration magnitude, is involved
in the paper. Suppose the group scale is n, the group member’s score is respectively
x1, x2,…, xn.,
x
is the average score of group members(1).
12
1
()
n
xxx x
n
=+++"
,
1
1
n
i
i
xx
n
=
=
∑
(1)
(b).Evaluation of difference magnitude.
Standard deviation is calculated: (2)
2
1
1
()
n
i
i
sxx
n
=
=−
∑
(2)
(c). Evaluation of the collaborative performance based on the collaborative per-
formance formula (3).
xs
C
xs
−
=
+
(,)Exc=
, C < 1
(3)
Where C presents collaboration degree, as well as E presents collaborative
performance.
The higher the collaboration degree is evaluated, the better the collaborative perform-
ance is proved. Thus it illuminates high cohesion. For example, look at Fig. 6.
2
1
1
( ) 3.6056
n
i
i
sxx
n
=
=−≈
∑
,
81.3944
0.9186
88.6056
xs
C
xs
−
=≈ ≈
+
,
( , ) (85,0.9186)Exc==
(4)
432 W. Tan et al.
Fig. 6. Score of group B
By calculating (4), group B is proved better in collaborative performance. That is
to say, the group members cooperate and communicate with each other well and
achieve the task perfectly.
Following is the algorithm of the histogram in VPC to present the collaborative
performance shown in Fig. 4, using the kind of C pseudo code and Natural Language.
drawing(x,y); // draw the Coordinate Graphs.
Int i=1;
Int S; // Group performance
Int p,q; //parameters
While(i<=group_count)
{
S= (group IC)*P+(group ID)*q;
Draw columnar section in the interval of
(x>5*I, x<5*(i+1), y>0, y<s);
}
Fig. 7. Pseudo code for implementing the collaborative performance histogram in VPC
4.4 Realization of Virtual Learning Community
The development of virtual learning community involves many tools. Firework is
used to design the foreground graphic interface. Dreamweaver and visual studio 2005
is combined to edit webpage and develop programs. C# is a programming language
developing by Microsoft to fit .net. Modules designed with C# may easily transform
to web service, may arbitrary transfer in random language and operating system. So
the system uses C# to instantiate algorithms. Background database uses SQL
server2000, while server adopts the production of IIS 6.0.
5 Conclusions and Perspectives
Collaborative virtual learning community is a tendency of the future development.
Constructing effective and suitable virtual learning community must integrate certain
Design on Collaborative Virtual Learning Community 433
theory. Under the collaborative learning theory of constructivism and the standard
architecture proposed by Chinese E-learning Technology Standardization Committee,
this paper designs a “software engineering” collaborative virtual learning community
to maximize each learner’s learning performance. Moreover, it is feasible to introduce
a concept of learning process visualization in collaborative learning because of
China’s traditional learning pattern. Information content and information degree is
distilled as learner’s characteristics to design the visualization of learning process,
which provides nicer feedback information. Nevertheless, we must emphasize that not
only constructing learning environment is complex and comprehensive, but also visu-
alizing learning process needs to be paid more attention. Some factors can affect the
learning effect, such as learning style, group member’s organization, the quality of
information communication and so on, which is not contained in the paper. This part
needs to be studied farther in the coming future, and collaborative virtual learning
community also will be improved.
Acknowledgment
This paper was supported by the Zhejiang provincial Natural Science Foundation of
China (Grant No. Y106039), the Key Research Foundation of Zhejiang Education
Department of China (Grant No. 20060491), and the Innovation Foundation of Zheji-
ang Normal University Graduate School.
References
1. Gates, B.: Future Tense. Beijing University Press, Beijing (1999)
2. Wang, L.: The Principle and Application of Virtual Learning Community. Higher Educa-
tion Press, Beijing (2004)
3. Yu, S.Q.: A Model for Evaluation of Internet-based Distance Teaching. Open Education
Research, Shanghai
4. Yang, Z.K., Lin, Q.T.: Research and development of web-based virtual online classroom.
Computers & Education 48, 171–184 (2007)
5. Gan, Y.C.: Knowledge Construction and Collective Wisdom Development in Virtual
Learning Community. Education Science Press, Beijing (2005)
6. Huang, R.H.: The Theories and Methods of Computer-Supported Cooperative Learning.
People’s Education Press, Beijing (2003)
7. Santiago, R.G., Juan, Z.R.: A framework for lab work management in mass courses: Ap-
plication to Low Level Input/Output without hardware. Computers & Education 48, 153–
170 (2007)
8. Yang, Z.K., Wu, D., Liu, Q.T.: Network Education Standard and Technology. Tsinghua
University Press, Beijing (2003)
9. Hsu, M.H., Chen, Y.L.: Exploring the antecedents of team performance in collaborative
learning of computer software. Computers & Education 48, 700–718 (2007)
10. Janssen, J., Erkens, G., Kanselaar, G., Jaspers, J.: Visualization of participation: Does it
contribute to successful computer-supported collaborative learning? Computers & Educa-
tion 49, 1037–1065 (2007)
11. Zhang, H.F., Kong, F.S.: Educational Information Evaluation. Publishing House of Elec-
tronics Industry, Beijing