Oxide for valve-regulated lead–acid batteries ppt
Bạn đang xem bản rút gọn của tài liệu. Xem và tải ngay bản đầy đủ của tài liệu tại đây (481.13 KB, 11 trang )
Ž.
Journal of Power Sources 73 1998 36–46
Oxide for valve-regulated lead–acid batteries
L.T. Lam
a,)
, O.V. Lim
a
, N.P. Haigh
a
, D.A.J. Rand
a
, J.E. Manders
b
, D.M. Rice
b
a
CSIRO, DiÕision of Minerals, P.O. Box 312, Clayton South, Victoria 3169, Australia
b
Pasminco Metals, P.O. Box 1291K, Melbourne, Victoria 3001, Australia
Received 18 June 1997; accepted 17 August 1997
Abstract
Ž.
In order to meet the increasing demand for valve-regulated lead–acid VRLA batteries, a new soft lead has been produced by
Pasminco Metals. In this material, bismuth is increased to a level that produces a significant improvement in battery cycle life. By
contrast, other common impurities, such as arsenic, cobalt, chromium, nickel, antimony and tellurium, that are known to be harmful to
Ž. Ž .
VRLA batteries are controlled to very low levels. A bismuth Bi -bearing oxide has been manufactured Barton-pot method from this
soft lead and is characterized in terms of phase composition, particle size distribution, BET surface area, and reactivity. An investigation
is also made of the rates of oxygen and hydrogen evolution on pasted electrodes prepared from the Bi-bearing oxide. For comparison, the
Ž.
characteristics and performance of a Bi-free Barton-pot oxide, which is manufactured in the USA, are also examined. Increasing the
level of bismuth and lowering those of the other impurities in soft lead produces no unusual changes in either the physical or the chemical
properties of the resulting Bi-bearing oxide compared with Bi-free oxide. This is very important because there is no need for battery
manufacturers to change their paste formulae and paste-mixing procedures on switching to the new Bi-bearing oxide. There is little
difference in the rates of oxygen and hydrogen evolution on pasted electrodes prepared from Bi-bearing or Bi-free oxides. On the other
Ž
hand, these rates increase on the former electrodes when the levels of all the other impurities are made to exceed by deliberately adding
.
the impurities as oxide powders the corresponding, specified values for the Bi-bearing oxide. The latter behaviour is particularly
noticeable for hydrogen evolution, which is enhanced even further when a negative electrode prepared from Bi-bearing oxide is
contaminated through the deposition of impurities added to the sulfuric acid solution. The effects of impurities in the positive and
negative plates on the performance of both flooded-electrolyte and VRLA batteries are assessed in terms of water loss, charge efficiency,
grid corrosion, and self-discharge. Finally, the causes of negative-plate discharge in VRLA batteries under float conditions are addressed.
q 1998 Elsevier Science S.A. All rights reserved.
Keywords: Bismuth; Hydrogen evolution; Impurity; Lead–acid battery; Oxygen evolution; Soft lead
1. Background
Ž.
The use of valve-regulated lead–acid VRLA batteries
that require no water maintenance has rapidly become
widespread. For stationary applications, in particular, these
designs are replacing conventional, flooded-electrolyte bat-
wx
teries. There have also been several demonstrations 1–4
of the feasibility of VRLA batteries using absorptive glass-
Ž.
mat AGM separators for automotive service. It has been
claimed that these batteries give competitive, or even
better, results than either flooded, low-maintenance or
wx
flooded, maintenance-free designs 2,3 . For example, the
performance of automotive VRLA batteries is equivalent
to that of flooded-electrolyte designs with low-antimony
Ž.
Pb–Sb positive grids; but when both battery types use
)
Corresponding author.
Ž.
the same lead–calcium–tin Pb–Ca–Sn alloy for the posi-
tive grids, the cold-cranking and cycle-life capabilities of
VRLA batteries are superior. A further market is opening
up for VRLA batteries. In the early 1990s, the US Federal
Government, together with some US State Governments,
provided a new impetus for the development of an electric
Ž.
vehicle EV industry through legislation aimed at decreas-
ing national petroleum dependence and reducing the im-
pact of automotive emissions on the urban environment.
VRLA batteries are considered widely to be the most
practical power source for the near-term EV markets.
Since VRLA batteries with AGM separators employ
lower volumes of sulfuric acid solution than flooded-elec-
trolyte equivalents, the former technology generally oper-
ates under ‘acid-starved’ conditions. Accordingly, water
loss during battery service must be kept to a minimum;
otherwise, the battery will fail through electrolyte dry-out.
0378-7753r98r$19.00 q 1998 Elsevier Science S.A. All rights reserved.
Ž.
PII S0378-7753 98 00020-2
()
L.T. Lam et al.rJournal of Power Sources 73 1998 36–46 37
Oxygen and hydrogen evolution occur as side reactions
during the charging process of lead–acid batteries. In a
VRLA battery, however, the oxygen evolved from the
positive plates diffuses through either the pores of the
separators or the head space of the container to the nega-
tive plates where it is reduced back to water. By contrast,
the hydrogen evolved from the negative plates cannot be
Ž.
oxidized or rather can only be oxidized at a very low rate
back to water at the opposite positive plates. Thus, any
hydrogen emission will translate to a permanent loss of
water from the battery. Accordingly, minimization of the
rates of both hydrogen and oxygen gassing, together with
the promotion of efficient oxygen recombination, are im-
portant objectives in the design of VRLA batteries.
The gassing behaviour of VRLA batteries is influenced
Ž
strongly by the compositionrnature of the grid alloys i.e.,
.Ž
Pb–Sb vs. Pb–Ca–Sn , the levels of impurities i.e., Sb,
.
Ni, Co, Se, etc. in the raw lead materials used to manufac-
ture the positive and negative plates, and the charging
wx
conditions 5–7 . On the other hand, the efficiency of
oxygen recombination depends on the degree of compres-
sion of the plate-group, the extent of electrolyte saturation
of the glass–mat separators, and the action of certain
minor elements in the negative mass, such as bismuth and
wx wx
tin 8,9 . These elements—especially bismuth 9 —have
been found to promote the reduction of oxygen, and can
also exert beneficial effects on the cycle life of both
flooded-electrolyte and VRLA designs of lead–acid bat-
tery.
With respect to acceptable levels of impurities in the
starting lead material, the majority of the present specifica-
tions set for soft lead have focused on battery technologies
which are based on antimonial grid alloys. In these de-
signs, the antimony in the positive and negative grids
dominates the performance of the battery, and the influ-
ence of minor impurities is of little importance. For VRLA
Ž
batteries that employ antimony-free grid alloys i.e., Pb–Sn
.
andror Pb–Ca–Sn there is, however, an urgent need to
develop a more stringent specification for soft lead in
order to exclude, or restrict adequately, those impurities
which exert a deleterious effect on gassing performance.
Based on research conducted both in a joint CSIRO–
wx
Pasminco research programme 9,10 and by other workers
wx wx
8,11,12 , Pasminco 13 has recently proposed a specifica-
tion for soft lead to suit the requirements of VRLA batter-
ies. In this new specification, impurities such as As, Co,
Cr, Ni, Sb, and Te that are known to be harmful to VRLA
batteries are limited to very low levels. By contrast, bis-
muth, which has been demonstrated as being beneficial, is
increased to levels at which significant improvements in
battery performance can be achieved.
Soft lead with the new specification has been produced
by Pasminco and supplied to a domestic lead–acid battery
company for conversion to Barton-pot oxide. CSIRO has
undertaken a study of the physico-chemical characteristics
of this oxide, together with an evaluation of its effects on
Table 1
Ž.
Phase composition wt.% of Barton-pot oxide
Oxide type Pb
a
-PbO
Bi-bearing oxide 21 79
Bi-free oxide 27 73
both oxygen and hydrogen evolution. For the purpose of
comparison, corresponding benchmark tests have also been
conducted on oxide which contains virtually no bismuth
Ž.
i.e., - 0.005 wt.% .
2. Oxide characterization
Two Barton-pot oxides were examined in this study:
one contains ; 0.05 wt.% Bi and was produced from soft
Ž
lead with the specifications proposed by Pasminco termed
.
‘Bi-bearing oxide’ ; the other oxide contains only trace
Ž.
amounts of bismuth termed ‘Bi-free oxide’ and was
supplied by a manufacturer in the USA. Phase-analysis
data for these oxides are given in Table 1. The results
show that both oxides consist of only lead and
a
-PbO. The
Bi-bearing oxide has a slightly lower free-lead content, and
thus a correspondingly higher proportion of
a
-PbO, than
the Bi-free oxide. The absence of
b
-PbO indicates that the
oxides have been prepared at a relatively low temperature.
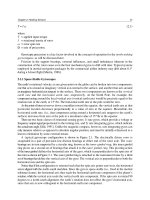
The particle size distribution of the Bi-free and Bi-
bearing oxides was determined with a Malvern Mastersizer
S, Version 2.14, standard particle size analyzer. The results
for the two oxides are very similar. The particle size
distribution of the Bi-bearing oxide is given in Fig. 1. The
oxide is composed of two types of particle: ‘type 1’
particles have sizes - 0.9
m
m and ‘type 2’ particles have
sizes ) 1.1
m
m. The most frequent diameter of the parti-
cles in types 1 and 2 is 0.3–0.4
m
m and 6–8
m
m,
respectively. The distribution curve of type 1 particles is
more symmetrical than that of type 2 particles. At large
particle sizes, it appears that a third distribution overlaps
the curve for type 2 particles. This is due to the presence
of free-lead particles which, in a Barton-pot oxide, usually
Fig. 1. Particle-size distribution of Bi-bearing oxide.
()
L.T. Lam et al.rJournal of Power Sources 73 1998 36–4638
Table 2
Acid absorption value and BET specific surface area of Barton-pot oxides
Oxide type Acid absorption value BET surface area
2 y1
Ž.Ž.
mg H SO per g oxide m g
24
Bi-bearing oxide 146 0.61
Bi-free oxide 140 0.55
have sizes of the order of several to several tens of
wx
microns 14 .
The acid absorption value and BET specific surface
area of the two oxides are given in Table 2. Clearly, the
presence of bismuth produces no major changes in either
parameter. The values are typical of those expected for a
Ž.wx
Barton-pot oxide see Fig. 2 15 .
Examination of the Bi-bearing oxide with an electron
Ž.
probe microanalyzer JEOL, Model 8900 Super Probe
revealed that the bismuth was distributed evenly through-
out the oxide with no segregation.
From the above data, it is concluded that increasing the
level of bismuth and lowering those of the other impurities
in soft lead produces no significant changes in either the
physical or the chemical properties of oxide made from
this material. Since reactivity with acid provides a useful
indicator of the paste-mixing attributes of a given oxide,
the absence of any major differences in acid absorption
between Bi-bearing and Bi-free oxides confirms that man-
ufacturers will experience no difficulties in paste mixing
on adopting this Bi-bearing oxide in their production lines.
3. Gassing behaviour of pasted electrodes
3.1. Preparation of pasted electrodes
A section of a Pb–0.09 wt.% Ca–0.4 wt.% Sn grid was
embedded in epoxy resin to give a cylinder. The unsol-
dered end of the grid was allowed to protrude about 2 mm
Fig. 2. Reactivity of Bi-bearing and Bi-free Barton-pot oxides. Other data
wx
are taken from Ref. 15 .
Fig. 3. Preparation of pasted electrodes for electrochemical studies.
Ž.
above the upper surface of the cylindrical mould Fig. 3a .
Ž.
A polyvinyl chloride PVC rod, with the same diameter as
the mould, was sectioned into a slice of thicknesss3 mm.
Ž.
A hole diameters6 mm was drilled through the centre
of the PVC slice and a cylindrical paper strip was fixed to
the inner wall of the hole. The PVC slice was placed on
the upper surface of the electrode assembly so that the grid
Ž.
was located at the centre of the hole Fig. 3a . The pastes
for positive and negative electrodes were prepared from
Bi-free and Bi-bearing oxides using the formulae given in
Table 3. The hole in the above assembly was filled with
paste and the PVC slice was then removed to give the final
dimensions of the electrode, as shown in Fig. 3b.
The pasted samples were cured under conditions which
Ž
promote the development of tribasic lead sulfate 3PbOP
.
PbSO P HOs3BS . After curing and drying, the samples
42
were placed in a petri dish which contained 1.070 sp. gr.
H SO . Electrode formation was achieved by applying, for
24
20 h, a constant current of 17.7 mA per g of cured
material.
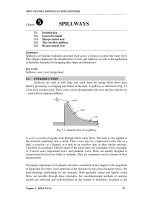
3.2. Gassing measurements
The electrochemical cell used in this study is shown in
Fig. 4. The pyrex cell has an H-shape with two main
compartments. The cell was filled with 1.275 sp. gr.
H SO . A sheet of pure lead served as the counter elec-
24
Ž.
trode. All potentials were measured and are reported with
respect to a 5 M HgrHg SO reference electrode.
24
Table 3
Paste formulae for positive and negative electrodes
Component Positive electrode Negative electrode
Ž.
Leady oxide kg 3 3
Ž.
Fibre g 0.9 1.8
a
Ž.
CMC g 7.5 y
Ž.
Stearic acid g y 1.8
Ž.
BaSO g y 11.1
4
Ž.
Vanisperse g y 11.1
Ž.
Carbon black g y 6.3
3
Ž.
1.400 sp. gr. H SO cm 200 200
24
3
Ž.
Water cm 390 330
y3
Ž.
Paste density g cm 4.5–4.6 4.7–4.8
a
Carboxymethyl cellulose.
()
L.T. Lam et al.rJournal of Power Sources 73 1998 36–46 39
Fig. 4. Electrochemical cell used for gassing measurements.
After formation, each sample was placed in the test cell
and the potential was scanned, either between y1.1 and
y1.7 V or between 1.3 and 1.7 V at 5 mV s
y1
for 20
Ž
cycles with a programmable potentiostatrgalvanostat EG
.
&G PAR 273 , prior to the respective measurement of
hydrogen and oxygen evolution. With this treatment, any
Ž
lead sulfate residues due to incomplete formation andror
.
the chemical development of sulfation layers will be
converted, respectively, to lead or lead dioxide. For studies
of both hydrogen and oxygen evolution, a potential-step
technique was used and the gas produced at each potential
was collected. The current density for oxygen evolution
Ž. Ž .
i and hydrogen evolution i was calculated
oxygen hydrogen
by means of the following expressions:
6
wx
i s 4FV P yP r 10 RTAt 1
Ž. Ž.
oxygen total w
6
wx
i s 2FV P yP r 10 RTAt 2
Ž. Ž.
hydrogen total w
y1
Ž.
where: Fs96,485 C mol ; P stotal pressure kPa
total
in the upper part of the burette; P svapour pressure
w
Ž. Ž.
kPa at temperature T; Vsgas volume ml collected in
Ž
y1 y1
.
the burette; Rsgas constant s8.31 J mol K ;
Ž. Ž
2
.
Tsabsolute temperature K ; Aselectrode area cm ;
Ž.
tselectrolysis period s . Note, two or more separate
determinations of the current were undertaken at each
potential. The average values are reported.
3.3. Oxygen eÕolution on pasted electrodes
Oxygen-evolution data for positive electrodes produced
from Bi-bearing and Bi-free oxides are shown in Fig. 5. As
expected, the oxygen-evolution rate increases with increase
in positive potential from 1.2 to 1.7 V. There are no major
differences in the rate of oxygen evolution for the two
electrodes. Thus, the presence of 0.05 wt.% Bi in the oxide
does not produce any undesirable increase in gassing.
As mentioned above, the Pasminco specification for
soft lead increases the limits for beneficial elements, such
as bismuth, to levels which can cause an improvement in
battery cycle-life. By contrast, impurities such as As, Co,
Cr, Ni, Sb and Te, which are harmful to VRLA batteries,
are restricted to very low levels. The details of the Pas-
minco specification are compared in Table 4 with those of
other Standards. The data demonstrate clearly that there is
a marked difference of opinion world-wide on the purity
required for soft lead. Moreover, many impurities have
hitherto not been specified, even though some of them are
Ž
known to enhance oxygen andror hydrogen gassing e.g.,
wx.Ž.
Co and Te 13 . In order to examine the effect s of these
impurities on the gassing characteristics of lead–acid bat-
teries, pasted electrodes were prepared from Bi-bearing
oxides in which the levels of all the impurity elements
Ž.
except sulfur were increased either to the maximum
Ž.
termed: ‘high-impurity, Bi-bearing oxide’ values speci-
fied in the British Standard 334-1982 or to medium values
Ž
i.e., 50% of each maximum level, termed: ‘medium-im-
.
purity, Bi-bearing oxide’ . This was achieved by blending
the Bi-bearing oxide with each of the elements in pow-
dered oxide form before paste mixing. Note, a maximum
level of 10 ppm was used for any element which is not
specified in the British Standard.
The oxygen-evolution rates of the positive electrodes
prepared from medium- and high-impurity, Bi-bearing ox-
ides are presented in Fig. 5. The data show clearly that
increased levels of impurities in the Bi-bearing oxide
produce a corresponding increase in the oxygen gassing
rate at all potentials between 1.4 and 1.7 V; the increase is
virtually the same for oxide blended with impurities at a
medium or a high level. It is concluded that the common
impurities in soft lead—but not bismuth—dominate the
rate of oxygen evolution.
Fig. 5. Oxygen evolution on pasted electrodes prepared from oxide of
different purity.
()
L.T. Lam et al.rJournal of Power Sources 73 1998 36–4640
Table 4
Ž.
Impurity limits maximum ppm in proposed Pasminco specification and other existing standards for soft lead
Element Pasminco specification Existing standards
Ž.
proposed
AS 1812-1975, Pb 99.99 ASTM B29-92, Refined pure BS 334-1982, Type A DIN 1719-1986, Pb 99.99
Ag 10 10 25 25 10
As 1 10 5 5 10
Ba 10 ns ns ns ns
a
Co 1 ns ns ns
Cr 5 ns ns ns ns
Cu 10 10 10 30 10
Fe 5 10 10 30 10
Mn 3 ns ns ns ns
Mo 3 ns ns ns ns
a
Ni 2 2 10 ns
S10 10 ns 5 ns
Sb 1 10 5 20 10
Se 1 ns ns ns ns
Te 0.3 ns 1 ns ns
V 4 ns ns ns ns
nssNot specified.
a
CoqNi-10 ppm.
3.4. Hydrogen eÕolution on pasted electrodes
The rate of hydrogen evolution on pasted negative
electrodes prepared from different oxides is presented in
Fig. 6. The results show that the hydrogen-evolution rate
increases with increase in the negative-plate potential,
irrespective of the nature of the starting oxide. When the
potential is more positive than y1.5 V, there is little
difference in the hydrogen-gassing rate on pasted elec-
trodes made from Bi-bearing and Bi-free oxides. By con-
trast, at potentials more negative than y1.5 V, the hydro-
gen-evolution rate on pasted electrodes prepared from
Bi-free oxide increases markedly in comparison with that
on the electrode produced from Bi-bearing oxide.
As with the oxygen-gassing studies, the hydrogen-
evolution behaviour has also been examined for pasted
electrodes prepared from medium- or high-impurity, Bi-
Fig. 6. Hydrogen evolution on pasted electrodes prepared from oxide of
different purity.
bearing oxides. The rate of hydrogen evolution increases
when the level of each impurity element is raised above
that specified by Pasminco for Bi-bearing oxide. Unlike
the behaviour observed for oxygen gassing, however, the
rate is greater for high-impurity than for medium-impurity
electrodes. More importantly, appreciable hydrogen evolu-
tion occurs on both electrodes at potentials as high as
y1.1 V.
Ž.
It is well known that gassing i.e., oxygen or hydrogen
occurs predominantly on the surface of the plate material
and from the walls of the pores within the plate material.
Therefore, any contamination of the surface by impurity
elements is likely to affect markedly the hydrogen-gassing
characteristics of the electrode if the impurities have the
ability to sustain a lower hydrogen overpotential than lead.
Accordingly, it is important to examine the hydrogen-gass-
ing rates of electrodes on which various impurity elements
are deposited. This situation simulates the contamination
of negative plates during battery cycling—a common
problem caused by the deposition of impurities that have
Ž
been leached from the positive plates i.e., from the grid
.
alloys andror the plate material .
After formation, negative electrodes were placed in
sulfuric acid solution which contained different impurities
at the maximum levels specified in the British Standard
Ž.
334-1982 see Table 5 . Some elements were excluded
Ž.
because they either do not dissolve Ag or do not deposit
Ž.
As, Ba, Cr on the negative electrode. It should be noted
that while molybdenum, alone, cannot be deposited from
wx
aqueous solution 16,17 , it can be co-deposited in the
presence of Fe, Co, or Ni.
In order to obtain a negative electrode with the same
levels of impurities as that prepared from high-impurity,
Bi-bearing oxide, the charge required to deposit individual
elements was calculated by assuming that the current
()
L.T. Lam et al.rJournal of Power Sources 73 1998 36–46 41
Table 5
Charge required to deposit each impurity element
Element Impurity Impurity Difference Charge required
levels in levels specified for deposition
a
Ž.
Bi-bearing oxide in BS 334-1982 Ah
Co 1 10 9 0.0032
Cu 10 30 20 0.0067
Fe 5 30 25 0.0096
Mn 3 10 7 0.0054
Mo 3 10 7 0.0031
Ni 2 10 8 0.0029
Sb 1 20 19 0.0050
Se 1 10 9 0.0024
Te 0.3 10 9.7 0.0032
V 4 10 6 0.0063
Totals0.0478
a
The values in parenthesis are not specified in BS 334-1982 but were
adopted in the experiments performed here.
The weight of the electrode material is ;0.4 g.
efficiency for the deposition of all elements is similar and
Ž.
equal to 0.1% see Table 5 . The total charge required is
0.0478 Ah. Taking this value, negative electrodes of
medium– and high–impurity can be obtained by applying
a current of 7.5 mA for 3.19 and 6.37 h, respectively.
Note, the current efficiency for deposition is dependent
upon both the inherent characteristics of each element and
the concentration of the element in the plating solution.
Nevertheless, at concentrations of a few ppm, the current
efficiency for each element is very similar and has a very
Ž.
low value i.e., 0.1% .
The negative electrodes on which elements were de-
posited up to the medium– and high–impurity levels are
termed ‘medium-impurity, contaminated electrodes’ and
‘high-impurity, contaminated electrodes’, respectively. The
gassing behaviour of these electrodes is presented in Fig.
6. As expected, the hydrogen-evolution rate increases sig-
nificantly compared with that sustained by electrodes pre-
pared from either medium- or high-impurity, Bi-bearing
oxides. This is because although the total concentration of
each impurity is virtually the same in a given type
Ž.
medium-impurity or high-impurity of blended or contam-
inated electrode, the surface concentration is considerably
higher in the contaminated electrodes. The rate of hydro-
gen evolution is greater on the high-impurity, contami-
nated electrodes than on the medium-impurity, contami-
nated counterparts.
4. Relevance to lead–acid batteries
The above gassing behaviour of individual positive and
negative electrodes prepared under various conditions will
be discussed in terms of the expected combined effects of
oxygen and hydrogen evolution on the performance of
Ž.
low-maintenance i.e., low-antimony grid alloys and
Ž.
maintenance-free i.e., Pb–Ca–Sn grid alloys flooded-
electrolyte batteries, as well as on the performance of
VRLA batteries. Obviously, at this stage, the following
analysis can only serve as a qualitative guide to the
performance of batteries that use the above electrodes.
4.1. Flooded-electrolyte batteries
Ž
The rates of oxygen and hydrogen evolution logarith-
.
mic scale during overcharging of flooded-electrolyte,
lead–acid batteries at a constant voltage of 2.45 V per cell
are shown in Fig. 7. For clarity, it is assumed that oxygen
and hydrogen are the only side reactions which are occur-
Fig. 7. Constant-voltage charging of flooded-electrolyte batteries.
()
L.T. Lam et al.rJournal of Power Sources 73 1998 36–4642
ring. In addition, the batteries are classified into the fol-
lowing three groups:
group I: batteries with positive and negative plates
produced from Bi-bearing or Bi-free oxide;
group II: batteries with positive and negative plates
produced from medium- or high-impurity, Bi-bearing
oxide;
group III: batteries with positive plates prepared from
medium- or high-impurity, Bi-bearing oxide, and with
medium- or high-impurity, contaminated negative plates
also prepared from Bi-bearing oxide.
Note, the levels of impurities in the medium- or high-
impurity, Bi-bearing oxide are within the values specified
in the British Standard 334-1982 or are set at 5 or 10 ppm,
respectively, in those cases where a value is not given.
In each battery group, the potentials of the positive and
negative plates are shifted from their corresponding equi-
Ž
rr
.
librium values E and E to such an
PbO r PbSO Pbr PbSO
24 4
extent that the same current flows through both polarities.
For group I batteries with positive and negative plates
produced from Bi-bearing or Bi-free oxide, there is no
significant difference in the rate of either oxygen or hydro-
Ž
gen evolution over this operational voltage see AB, CD,
.Ž
Fig. 7 . By contrast, both rates particularly that for hydro-
.
gen evolution are increased in group II batteries which are
made from oxide containing higher levels of impurities
Ž.
cf., EF with AB, and GH with CD, Fig. 7 . The
hydrogen-gassing rate is further enhanced in group III
batteries when the negative plate is contaminated via the
deposition of impurity elements which originate either
Ž
from the electrolyte or from the positive plates cf., JK and
.
EF, Fig. 7 .
During charge–discharge cycling, it is clear that less
gassing and, thereby, less water loss will be expected from
group I batteries than from group II and III counterparts.
Moreover, due to lower rates of oxygen and hydrogen
gassing, the group I batteries will have better charging
efficiency. The other important observation is that the
potential of the positive plate shifts to more positive values
when the gassing rate of the battery is increased. It is well
wx
established 18 that the corrosion rates of both low-anti-
mony and Pb–Ca–Sn grids increase with increase in posi-
Ž.
tive-plate potential i.e., ) 1.23 V . This indicates that in
addition to the benefits of less gassing, less water loss and
better charging efficiency, the batteries made from Bi-
Ž.
bearing or Bi-free oxide group I will experience less
positive-grid corrosion than those produced from oxide
Ž.
with high impurity levels group II or with contaminated
Ž.
negative plates group III .
The self-discharge of individual positive and negative
plates in a battery is determined mainly by the amount of
oxygen and hydrogen gassing that takes place under open-
circuit conditions via the following reactions.
At positive plate:
HO™ 1r2O q2H
q
q2e
y
3
Ž.
22
PbO q 2H
q
qHSOq2e
y
™ PbSO q 2H O 4
Ž.
224 42
At negative plate:
2H
q
q2e
y
™ H5
Ž.
2
PbqHSO™ PbSO q2H
q
q2e
y
6
Ž.
24 4
The rate of oxygen or hydrogen evolution caused by
self-discharge can be estimated from the intersection of the
corresponding gas-evolution curve with the equilibrium
Ž.
potential of the positive or negative plate see Fig. 8 .
Clearly, the self-discharge at positive and negative plates
will be lower in group I, than in group II and III batteries.
Fig. 8. Self-discharge of positive and negative plates in flooded-electrolyte battery.
()
L.T. Lam et al.rJournal of Power Sources 73 1998 36–46 43
The above simple relationship between the gassing
current and the potentials of the positive and negative
plates is, however, only an approximation. This is because
Ž
other secondary reactions i.e., grid corrosion and oxygen
.
reduction also occur during overcharge. The current con-
sumed by these reactions is more important in the opera-
tion of VRLA batteries than in flooded-electrolyte counter-
parts.
4.2. VRLA batteries
In VRLA batteries, the situation is quite different. At
the positive plates, the overcharge current is consumed
Ž
mainly by oxygen evolution. Only a minor amount ; 2%
wx.Ž
19 is consumed by grid corrosion note, oxidation of
.
hydrogen is negligible . Nevertheless, the current associ-
Ž.
ated with grid corrosion cannot be neglected see later .
Oxygen evolved from the positive plates will diffuse
through either the pores of the separators or through the
head space of the container to the negative plates, see Fig.
9. The oxygen is then reduced chemically via the forma-
tion of lead sulfate, i.e.,
Pbq1r2O qHSO™ PbSO q HO 7
Ž.
224 42
Since the negative plates are simultaneously on charge,
the lead sulfate is immediately reduced electrochemically
to lead and the chemical balance of the cell is restored, i.e.,
PbSO q 2H
q
q2e
y
™ PbqHSO 8
Ž.
424
The overall ‘oxygen-reduction’ or ‘oxygen-recombina-
tion’ reaction can be expressed by:
1r2O q 2H
q
q2e
y
™ HO 9
Ž.
22
Consequently, the situation at the negative plate of a
VRLA battery is completely different to that experienced
at the negative plate of a flooded-electrolyte battery. Oxy-
gen reduction is now the main reaction.
Given the above considerations, the current distribution
in VRLA batteries prepared from Bi-bearing or Bi-free
oxide has been calculated and the results, together with
Ž.
those for flooded-electrolyte batteries Fig. 7 , are pre-
sented in Fig. 10. The calculations are based upon the
Ž.
following assumptions: i the efficiency of oxygen reduc-
Ž.
tion is 96%; ii the corrosion current is 2% of the overall
Ž.
value; iii the oxidation of hydrogen and battery additives
Ž.
e.g., expanders, pore formers is negligible. As with con-
Ž.
stant-voltage overcharging 2.45 V per cell of flooded-
electrolyte batteries, both the positive- and negative-plate
potentials are shifted so that the same amount of current
flows through both polarities, i.e., the combined current
consumed by oxygen evolution and grid corrosion at the
positive plate is equal to that consumed by oxygen reduc-
tion and hydrogen evolution at the negative plate. The
hydrogen evolution at the negative plate balances the grid
corrosion at the positive plate and any evolved oxygen that
is not subsequently reduced at the negative, i.e., i s
hydrogen
Ž.
i q i yi . Since the current at the
corrosion oxygen oxygen reduction
negative plate is mainly associated with oxygen reduction,
that remaining for hydrogen evolution is decreased. Under
such conditions, the potential of the negative plate shifts
towards a more positive value, i.e., towards the equilib-
Ž
r
.
rium value of the PbrPbSO couple i.e., E .
4Pbr PbSO
4
Correspondingly, the potential of the positive plate will
shift to a more positive value in order to maintain the cell
voltage at 2.45 V. Thus, because there are two possible
reactions at the negative plate, the potentials of the positive
and negative plates in a VRLA battery will differ from
those in flooded-electrolyte battery, i.e., by an amount DV
as shown in Fig. 10.
Fig. 9. Reactions which take place during recharge of a VRLA battery.
()
L.T. Lam et al.rJournal of Power Sources 73 1998 36–4644
Fig. 10. Constant-voltage charging of flooded-electrolyte and VRLA batteries.
The current distribution in VRLA batteries prepared
under different conditions is presented in Fig. 11. As with
flooded-electrolyte designs, the group I batteries, i.e., pre-
pared from Bi-bearing and Bi-free oxides, produce less
hydrogen gassing under constant-voltage charging than
group II and III counterparts and, consequently, will have
less water loss and better charging efficiency. Since the
potential of the positive plate in group I batteries shifts to a
less-positive value than in group II and III counterparts,
the group I batteries would suffer a lower rate of positive-
grid corrosion even though all batteries are made from the
same grid alloy. For similar plate conditions, the positive
grid in a VRLA battery is more prone to corrosive attack
than a grid in a flooded-electrolyte battery because the
shift in positive-plate potential is larger in the former
Ž.
design see Fig. 10 . Such corrosion not only lowers both
Fig. 11. Constant-voltage charging of VRLA batteries.
()
L.T. Lam et al.rJournal of Power Sources 73 1998 36–46 45
Fig. 12. Self-discharge of positive and negative plates in a VRLA battery.
the conductivity and the mechanical strength of the posi-
tive plates but also causes additional water loss via the
process:
Pbq2H O™ PbO q4H
q
q4e
y
10
Ž.
22
This water consumption is detrimental to ‘acid-starved’
VRLA technology because it will cause a significant loss
wx
in capacity. For example, Brecht 20 has calculated that
conversion of 25% of the grid metal into PbO will
2
produce a corresponding 10% reduction in the electrolyte
saturation level. If the latter falls from 95 to 85%, then a
20% or greater loss in usable capacity will occur.
For VRLA and flooded-electrolyte batteries, the self-
discharge of the positive plates is basically similar, but that
Ž.
of the negative plates is quite different see Fig. 12 . At the
negative plates in a VRLA batteries, self-discharge can
Ž
proceed not only by hydrogen evolution reactions 5 and
.Ž.
6 but also by oxygen reduction see reaction 7 . Thus, in a
VRLA battery, the self-discharge of the negative plate
depends upon the rate of self-discharge of the positive
plate and upon the oxygen-recombination efficiency. In
Fig. 13. Operational voltages of VRLA batteries under float conditions.
()
L.T. Lam et al.rJournal of Power Sources 73 1998 36–4646
addition, the ingress of any air through the valve or
container will further discharge the negative plate. As with
flooded-electrolyte designs, group I batteries will undergo
less self-discharge than group II and III counterparts.
As mentioned above, VRLA technology is replacing
conventional, flooded-electrolyte batteries in stationary ap-
plications. Therefore, it is of interest to examine the per-
formance of VRLA batteries prepared from oxide of differ-
ent purity when used in uninterruptible power supply
Ž.
applications UPS . Under such duty, the batteries are
subjected continuously to constant-voltage charging
Ž.
‘float’ at 2.27 V per cell. A comparison of the opera-
tional voltage of group I and group III batteries in UPS
applications is given in Fig. 13. In the initial stages, the
oxygen-reduction efficiency in both groups of batteries is
assumed to be 96%. At this stage, the float current of
Ž
group I batteries i.e., both plate polarities prepared from
.
Bi-bearing or Bi-free oxide is lower than that of group III
Ž
batteries positive plates produced with either medium– or
high–impurity, Bi-bearing oxide and contaminated nega-
tive plates produced from Bi-bearing oxide with medium
.
or high surface contamination , cf., AB, CD in Fig. 13.
Thus, group I batteries will experience less water loss and
a lower rate of grid corrosion. Since group III batteries
suffer more water loss and grid corrosion, the saturation
level of electrolyte in these batteries will be reduced
progressively to an extent that the oxygen reduction be-
Ž.
comes very efficient i.e., 99% . At the same time, the
potential of the negative plate will shift towards more
positive values so that the hydrogen-evolution current bal-
Ž
ances that of grid corrosion at the positive plate because
.
there is now virtually no loss of oxygen . When the
potential of the negative plate moves to a value more
Ž
r
.
positive than the equilibrium potential E , and the
Pb r PbSO
4
current consumed by hydrogen evolution is still higher
than that consumed by grid corrosion, the difference will
Ž
be taken up by self-discharge of the negative plates see
.
EF in Fig. 13 . Thus, group III batteries may suffer
negative-plate discharge during UPS duty. Jones and Feder
wx
21 have observed this problem in some batteries after a
long periods of float service. On extended service, the
oxygen-reduction efficiency of group I batteries will also
approach 99%. Again, the potential of the negative plate
Ž
will shift towards more positive values, i.e., towards the
.
equilibrium value until the current consumed by hydrogen
evolution balances that consumed by grid corrosion at the
counter positive plate. Given the inherent low hydrogen
gassing rate, the latter condition is achieved before the
negative-plate potential reaches the equilibrium value and
Ž
thus self-discharge of the negative plate is prevented cf.,
.
GH, EF in Fig. 13 .
5. Conclusions
This study has highlighted the importance of setting
lower limits for common impurities in the soft lead used to
manufacture VRLA battery oxide. Pasted positive and
negative electrodes using oxide prepared from soft lead
specified by Pasminco have lower rates of oxygen and
hydrogen evolution than those employing oxides in which
the impurities have been raised to the maximum levels
specified in the British Standard 334-1982, or to medium
Ž.
levels i.e., 50% of the maximum levels . Therefore, VRLA
batteries produced using the new Pasminco specification
experience less water loss, better charging efficiency, and
lower rates of grid corrosion and self-discharge. Further-
more, both laboratory and field trials have demonstrated
that no difficulties will be encountered with existing equip-
ment and plate-making procedures when adopting the Pas-
minco soft lead for oxide and battery manufacture.
Acknowledgements
The CSIRO authors are grateful to Pasminco Metals for
supporting this work and for permission to publish the
results.
References
wx Ž.
1 B. Culpin, K. Peters, N.R. Young, in: J. Thompson Ed. , Power
Sources 9, Research and Development in Non-Mechanical Electrical
Power Sources, Academic Press, London, UK, 1983, p. 129.
wx Ž.
2 E. Nann, J. Power Sources 33 1991 93.
wx Ž.
3 M. Tsubota, S. Osumi, M. Kosai, J. Power Sources 33 1991 105.
wx Ž.
4 T. Yamada, Y. Nakazawa, Y. Tsujino, J. Power Sources 38 1992
123.
wx Ž.
5 J. Szymborski, B. Burrows, in: J. Thompson Ed. , Power Sources 9,
Research and Development in Non-Mechanical Electrical Power
Sources, Academic Press, London, UK, 1983, p. 113.
wx Ž.
6 B. Culpin, M.W. Pilling, F.A. Fleming, J. Power Sources 24 1988
127.
wx
7 J. Kwasnik, T. Pukacka, M. Paszkiewicz, B. Szczesniak, J. Power
Ž.
Sources 31 1990 135.
wx Ž.
8 M. Maja, N. Penazzi, J. Power Sources 22 1988 1.
wx
9 L.T. Lam, R. De Marco, J.D. Douglas, R. Pillig, D.A.J. Rand, J.
Ž.
Manders, J. Power Sources 48 1994 113.
wx
10 L.T. Lam, J.D. Douglas, R. Pillig, D.A.J. Rand, J. Power Sources 48
Ž.
1994 219.
wx
11 H. Sanchez, Y. Meas, L. Gonzales, M.S. Quiroz, J. Power Sources
Ž.
32 1993 43.
wx Ž.
12 J.R. Pierson, C.E. Weinlein, C.E. Wright, in: D.H. Collins Ed. ,
Power Sources 5, Research and Development in Non-Mechanical
Electrical Power Sources, Academic Press, New York, 1975, p. 97.
wx Ž.
13 D.M. Rice, J.E. Manders, J. Power Sources 67 1997 251.
wx
14 G.L. Corino, R.J. Hill, A.M. Jessel, D.A.J. Rand, J.A. Wunderlich,
Ž.
J. Power Sources 16 1985 141.
wx Ž.
15 D.A.J Rand, L.T. Lam, The Battery Man, 34 1992 18–22, 24, 27,
28.
wx Ž.
16 D.W. Ernst, M.L. Holt, J. Electrochem. Soc. 105 1958 686.
wx Ž.
17 L.O. Case, A. Krohn, J. Electrochem. Soc. 105 1958 512.
wx
18 Proceedings of The ALABC PCL Study Group’s First Meeting,
Lower Beeding, West Sussex, UK, 23–24, September 1993, p. 58.
wx
19 J. Mrha, K. Micka, J. Jindra, M. Musilova, J. Power Sources 27
Ž.
1989 91.
wx Ž.
20 W.B. Brecht, Batteries Int. 20 1994 40.
wx
21 W.E.M. Jones, D.O. Feder, Proc. TELESCON ’97, Budapest, Hun-
gary, 1997, pp. 295–303.