Marketing Research Chapter 5 pptx
Bạn đang xem bản rút gọn của tài liệu. Xem và tải ngay bản đầy đủ của tài liệu tại đây (1.2 MB, 20 trang )
Marketing Research
66
5. Measurement and scaling
5.1 Chapter summary
This chapter will introduce the concept of measurement and scaling. It will also provide
discussion on the primary scales of measurement and go on to classify and describe both
comparative and noncomparative scaling techniques. It will also discuss how an appropriate
scaling technique be chosen in developing a right question. It will also focus on the concepts
of validity and reliability in details.
5.2 Importance of measurement and scaling in
marketing research
Like sampling we use measurement regularly in our daily lives. For example, if someone asks
you of your favourite newspaper, your mind may create a list and you shall decide your
favourite most newspaper from that. While deciding on that favourite newspaper your mind
would have used several criteria such as your reading pattern, content of the newspaper,
various other features such as writers involved, format, colour and pictures used, and
columnists you prefer. Furthermore, your mind would have also told you the most preferred
the second most preferred and even least preferred newspaper. The criteria your mind is using
in deciding the favourite newspaper is called measurement. In research terms, measurement is
nothing but the assignment of numbers or other symbols to characteristics of objects
according to certain pre-specified rules. One of the important things to note here is that
researchers do not measure objects but some characteristics of it. So in reality, researchers do
not measure consumers but their perceptions, beliefs, attitudes, preferences and so on. The
idea of assigning numbers can be helpful in two ways in accurate understanding of a
phenomenon; (1) it allows statistical testing and (2) it helps facilitate easier communication as
people have a clear idea with regard to what 10% or 20% means worldwide. Furthermore,
numbers also provide objectivity in understanding a phenomenon. This added accuracy due to
numbers is essential to effective decision making.
Scaling can be defined as an extension to the process of measurement. To successfully
measure a phenomenon the researcher must gather appropriate raw data. The appropriateness
of the raw data being collected depends directly on the scaling technique used by the
researcher. Scaling can be defined as the process of assigning a set of descriptors or rules to
represent the range of possible responses to a question about a particular phenomenon.
52
To
illustrate, consider that a retail store manager wishes to know consumers’ preference
regarding the store’s brand image. The researcher develops a scale where in 1 = extremely
favourable and 10 = least favourable. The consumers now can respond using these boundaries.
So scaling in a way is placing respondents n a continuum with respect to their preference of
the store’s brand image. Using the scale researchers can measure consumer responses easily.
Moreover, can carry out some statistical analysis and also provide results which can easily be
Measurement and scaling
Download free books at BookBoon.com
Marketing Research
67
understood and acted upon by the manager. As one can observe, measurement and scaling is
highly important in marketing research due to the overall objectivity they provide.
5.3 Scales of measurement: fundamental properties
There are four primary scales of measurement: nominal, ordinal, interval and ratio. However,
before we get into defining them and understanding their use in marketing research we need
to focus on the basic properties which help us identify the scales. Drawing from mathematical
theory, there are four scaling properties that a researcher can use in developing scales:
assignment, order, distance and origin.
5.3.1 Assignment property
The assignment property is also referred as description or category property. It refers to the
researcher’s employment of unique descriptors, or labels to identify each object within a set.
For example, a researcher asking a question ‘are you going to buy a new music system in the
next six months?’ can assign two descriptors to record the response from consumers; namely
yes or no. Similarly another question relating to more preferred brand by consumers with
regard to music system can have various brand names mentioned as descriptors.
5.3.2 Order property
The second measurement scale property, order property, refers to the relative magnitude
between the descriptors.
53
The relative magnitude refers to three basic properties of any object
mathematically. For example, if they are two objects A and B, there are three basic
mathematical possibilities: (1) A is greater than B; (2) A is lesser than B; and (3) A is equal to
B. Order property helps in identifying these properties.
5.3.3 Distance property
The distance property refers to a measurement scheme where exact difference between each
of the descriptors is expressed in absolute.
54
For example, if you bought 4 cans of a drink and
your friend bought 2 cans of the same drink you bought two more cans than your friend.
Normally, the distance property is restricted to those situations where the raw responses
represent some type of natural numerical answer.
5.3.4 Origin property
The origin property is a measurement scheme wherein exists a unique starting point in a set of
scale points. For the most part, the origin property refers to a numbering system where zero is
the displayed or referenced starting point in the set of possible responses. Other such origin
property responses could be ‘dissatisfied’, ‘neither dissatisfied nor satisfied’, and
‘highly satisfied’.
Measurement and scaling
Download free books at BookBoon.com
Marketing Research
68
When developing scale measurements, it is important to understand and remember that the
more scaling properties that can be simultaneously activated in a scale design, the more
sophisticated raw data. As a scale design includes more scaling properties, it increases the
amount of raw data that can be collected by the researcher. Furthermore, it is interesting to
note here that each scaling property builds on the previous one. For example, a scale which
includes order property will have assignment property built in. Similarly, a scale which
possesses distance property will have assignment and order property both. An origin property
based scale will have all assignment, origin and distance properties included in itself. This
will become further clear as we discuss the basic levels of scale.
5.4 Primary scales of measurement
As stated in the last section there are four primary scales of measurement: nominal, ordinal,
interval and ratio. Each of these scales of measurement provides specific scaling properties
(assignment, order, distance and origin).
Measurement and scaling
+LZPNU `V\Y
V^UM\[\YLH[
4(5+PLZLS
^^^THUKPLZLSJVT
Please click the advert
Download free books at BookBoon.com
Marketing Research
69
5.4.1 Nominal scale
A nominal scale is the most basic of four scales of measurement. It refers to figuratively
labelling scheme in which the numbers serve only as labels or tags for identifying and
classifying objects. In a way, it caters to researcher’s need for assignment property. For
example, identifying each respondent by assigning them a number is nominal scaling.
Nominal scale is also used in most sports with each player assigned a specific unique number.
In marketing research nominal scale is used in identifying respondents, products, attributes
and so on. Nominal scale is also used for classification purposes in marketing research where
scaled numbers serve as labels for classes or categories. For example, nominal scale is used in
gender classification. The numbers in nominal scale do not reflect the amount of the
characteristics possessed by the objects. For example, a marathon runner with a number 4500
does not mean he is superior to another marathon runner with a number 7200. The only
permissible operation on the numbers in a nominal scale is counting. Only a limited number
of statistical processes, such as percentages, mode, chi-square and binominal tests can be
carried out using nominal scale based data.
5.4.2 Ordinal scale
The structure of ordinal scale activates both the assignment and order scaling properties. This
scale allows respondents to express relative magnitude between the answers to a question. In
simple words, the ordinal scale allows respondents to order their response in a hierarchical
fashion. At the start of this chapter we discussed the example of favourite newspaper. That
example is an ordinal scale where a respondent can determine whether an object has more or
less of a characteristic than some other object. Thus, ordinal scale provides relative magnitude
however cannot provide relative distance. Common examples of ordinal scale include ranking
of sportsman, ranking of brands, quality rankings and organization rankings in business
magazines, several socioeconomic characteristics such as occupational status. In marketing
research, ordinal scale is used to create various lists such as fortune 500 list of top global
companies, best 100 companies to work with and so on. Various statistical analysis
techniques can be used to describe and infer information from ordinal scale including
percentile, mean, and rank-order correlation.
5.4.3 Interval scale
An interval scale possesses assignment, order and distance properties. So, an interval scale
provides a researcher all the information of an ordinal scale, and at the same time, allows
comparison between different objects. For example, in ordinal scale when newspapers are
ranked from 1 – 5 it is impossible to define the preference distance between the newspapers.
In simple words, we cannot possibly say that the difference of preference between newspaper
1 and newspaper 2 as well as newspaper 2 and newspaper 3 is the same. However, using
interval scale we can actually provide the preferential difference between the two objects
(newspapers). This kind of scale is most appropriate when the researcher wants to collect
state-of-behaviour, state-of-intention or certain kind of state-of-being data.
55
For example, if
Measurement and scaling
Download free books at BookBoon.com
Marketing Research
70
we ask two respondents about how much time do they spend reading a newspaper everyday,
we can not only identify who spends more or less time in comparison to other but also we can
know the exact difference in minutes (or other time interval) between the two respondents.
Adding to our earlier example of best 100 companies to work with, if the researchers had
asked the respondents to rate the companies on a rating scale it would have provided the
distance between the companies and more meaningful information can be obtained. In an
interval scale zero point (origin) is not fixed. Both origin and the units of measurement in
interval scale are arbitrary. In marketing research, ratio scale is used to measure attitudes,
opinions, index numbers and so on. All technique which can be applied to nominal and
ordinal data can be used in interval scale measurement. Furthermore, many other statistical
techniques, can be employed to analyse interval scale related data including range, mean,
standard deviation, product-moment correlation, t-tests, ANOVA, regression and factor
analysis.
5.4.4 Ratio scale
A ratio scale contains all the four scaling properties (assignment, order, distance and origin)
in one. In other words, it possesses all the properties of nominal, ordinal, and interval scales
and in addition an origin. Thus, in ratio scale, we can identify or classify objects, rank the
objects, and can compare intervals or differences. Ratio scale is the most sophisticated of all
scales and it enables the researcher not only to identify the absolute differences between each
scale point but also to make absolute comparisons between the responses. It is also
meaningful to compute ratios of scale value. For example, the difference between 10 and 15
and is the same as 30 and 35. Furthermore, 30 is 3 times as large as 10 in an absolute sense.
Regular examples concerning ratio scale include weight, height and age. In marketing
research, ratio scale is used when measuring variables such as sales, cost, customer numbers
and so on. All statistical techniques can be applied to ratio scale based data. This includes
specialised statistics such as geometric mean, harmonic mean and coefficient of variation.
5.5 Comparative and non-comparative scaling
Researchers have identified several important characteristics for developing high quality
scales. The high quality scales require (a) understanding the defined problem; (b) establishing
detailed data requirements; (c) identifying and developing the constructs and (d)
understanding the complete measurement scale. The above stated key features can assist
marketing researchers in developing a reliable and valid scale.
As you would have observed from all of the earlier chapters that one of the major aims for
managers in today’s world is to understand their consumers’ and market’s reaction to various
stimuli. This stimuli results in a specific set of reaction and researchers are mostly given task
to measure and interpret the reaction prior to it occurs. Managers are interested in knowing
consumers’ attitudes, beliefs, preferences, as well as competitive reactions among other
important market phenomena. In this section we shall discuss how researchers can take on the
task of measurement using various scaling techniques.
Measurement and scaling
Download free books at BookBoon.com
Marketing Research
71
The scaling techniques regularly employed in marketing research can be classified into two
basic strands: (a) comparative scaling and (b) non-comparative scaling. As the name suggests
comparative scaling involves direct comparison of stimulus objects with one another. For
example, managers are generally interested in knowing consumer preference regarding their
brand in comparison to a competitor’s brand. A researcher can then ask question such as what
of the two brands consumer prefers and this would provide the manager a clear idea of what
consumer preferences are. There are several techniques which are used in building
comparative scale such as paired comparison, rank order, constant sum scale, and q-sort.
Measurement and scaling
Please click the advert
Download free books at BookBoon.com
Marketing Research
72
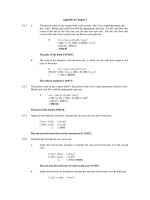
Figure 5.1:
Classification of scaling techniques
While comparative scaling is used for comparison between stimuli, on the other hand, non-
comparative scaling involves each stimulus object being scaled independently of the other
objects in the stimulus set. The resulting data in non-comparative scale are assumed to be
interval or ratio scaled. For example, instead of direct comparison between brands researcher
may ask the respondent to rate each brand separately on a scale of 1 – 10 and can evaluate
each brand as well as compare the brands also. Non-comparative scaling techniques involve
continuous rating scales as well as itemised rating scales. The itemised rating scales are
further sub-divided into likert scale, semantic differential scale and stapel scale. As one can
easily infer, non-comparative scaling is highly used in marketing research. In the following
section we will focus on each of the scaling techniques in details.
5.6 Comparative scaling techniques
As discussed above, comparative scaling techniques provide a direct comparison between
stimulus objects. Because the respondents are forced to choose one out of two (or many)
stimulus objects, researchers can identify small differences between stimulus objects. One of
the other advantages of comparative scaling is the easy application by researcher and easy
understanding by the respondent. Comparative scaling involves fewer theoretical assumptions
however as the data gathered using this technique is mostly ordinal it lacks distance and
origin properties and therefore, does not provide possibility of carrying out various advance
statistical techniques.
Scaling techniques
Comparative scaling Non-comparative scaling
Paired comparison
Rank order
Constant sum scale
Q
-
so
r
t
Continuous rating Itemized rating
Likert
Semantic
differential
Stapel
Measurement and scaling
Download free books at BookBoon.com
Marketing Research
73
5.6.1 Paired comparison scaling
In paired comparison scaling, respondents are asked to choose one among two alternatives on
a selected criterion. For example, a respondent may be asked to choose between two well-
known toothpaste brands on the criterion of quality. The data obtained from paired
comparison scaling is ordinal in nature. When there are more than two stimuli involved paired
comparison scaling can still be useful technique to compare various stimuli. Lets say, a
researcher is interested in knowing consumers preference among three different toothpaste
brands, A, B and C. Using the paired comparison scaling researcher will create three
questions for respondents namely:
1. Preference between toothpaste brand A and brand B
2. Preference between toothpaste brand B and brand C
3. Preference between toothpaste brand A and brand C.
If for the first question respondent choose brand A over brand B and in the second question
chose brand B over brand C, using simple logic researcher can derive that brand A will be
more preferred in comparison to brand C. In simple terms, using paired comparison scaling
researcher can generate a rank order among stimuli. Paired comparison scaling is used in
pricing decisions frequently. It is quite helpful when the number of stimuli is limited. In such
circumstances, paired comparison can reveal direct comparisons and overt choice. However,
when large number of stimuli is involved, paired comparison scaling becomes a tedious
technique. Paired comparison scaling is highly used in product testing. Many food companies
and other Fast Moving Consumer Goods (FMCG) companies use this technique to compare
their existing product with an upcoming variant or with their competitor’s products. Coca-
Cola is reported to have conducted more than 190,000 paired comparisons before introducing
new Coke in 1985.
56
5.6.2 Rank order scaling
Rank order scaling as the name suggests is about ranking a specific set of stimuli on a pre-
defined criterion. It’s also quite popular among researchers when trying to understand a
specific rank order among various stimuli. The respondents are provided with various stimuli
objects and asked to rank the most preferred object, the second most preferred object and so
on. The earlier example of newspaper selection was kind of rank order scaling where
respondents were asked to choose most preferred to least preferred newspapers. This scaling
technique also uses comparison between stimuli objects using a pre-determined criterion (in
the case of newspapers it may be content quality, use of relevant images and so on). In
absence of such criterion this technique may deliver biased results. Furthermore, looking at
the ranking in isolation also can create bias. For example, newspaper X may be the most
preferred in terms of content quality however may be ranked lower in overall readability.
Rank order scaling generates ordinal data and therefore lacks distance and origin properties.
Due to the absence of distance and origin properties rank order scaling cannot provide an
objective difference between various stimuli objects. For example, in the newspaper example,
Measurement and scaling
Download free books at BookBoon.com
Marketing Research
74
the researcher using rank order scaling cannot confidently state that the difference between
preference of newspaper X, Y and Z (ranked as most to least preferred) is constant. In other
way, we cannot determine if the preference difference between newspaper X and newspaper
Y; and newspaper Y and newspaper Z is the same. While there are disadvantages of using
rank order scaling, the ease of understanding is the greatest advantage associated with rank
order scaling. When asked, most respondents can easily understand the instructions for
ranking as the ranking process reflects our real life shopping environment and choice process.
5.6.3 Constant sum scaling
In constant sum scaling, respondents are asked to assign a constant sum of units (could
include points, currency, and so on) to a specific set of stimulus objects with respect to some
pre-defined criterion. For example, researcher may ask the respondents to assign a number
according to their perceptions of a specific stimuli object on the criteria chosen so as the total
becomes 100. The attributes are scaled by counting the points assigned to each criterion by all
the respondents and divided by the number of respondents. Table 5.1 below provides detailed
explanation of how constant sum scaling is used in real life. The table explains respondents’
preferences regarding various pre-defined criteria namely: content quality, supplements,
writers (columnists) involved, images used, breadth of coverage (local, regional, local and
global) and advertisements. Respondents were asked to rate each criteria in such a way that
the total of their responses becomes 100. Two hundred responses were collected. From the
table, it can be observed that respondents put content quality as the most preferred factor and
advertisement in the newspaper to be least preferred factor. Furthermore, it can also be stated
that supplements provided with the newspapers as well as images used within the newspaper are
twice as important in comparison to writers or columnist involved with the newspaper. Using
the numbers assigned researcher can easily convert constant sum scale into rank order scale.
Table 5.1:
Example of constant sum scaling
Criteria
Overall respondent
preference
(200 responses)
Content quality 35
Supplements 20
Writers (Columnists) involved 10
Images used 20
Breadth of coverage (local, regional, national,
global)
15
Advertisements 00
Total 100
Measurement and scaling
Download free books at BookBoon.com
Marketing Research
75
Constant sum scale can also help segment various respondents according to their preferences
and provide groupings. Even if constant sum scale has distance and origin properties the
results lack generalizability and therefore researchers suggest constant sum scale to be treated
as ordinal data measurement technique.
57
One of the major advantages of constant sum scale
is that it provides fine discrimination among stimulus objects without requiring too much time.
The respondent disengagement at times affects the validity of this scale when the larger
number of criteria is present. Furthermore, respondents may make mistakes in bringing the
total 100. However, constant sum scales can be helpful when measuring consumer shopping
basket preferences. Such as, how much would they spend on each specific food items if they
had £100. With the advent of internet based surveys, constant sum scales have become easier
to implement because software used in the background can keep track of the total and inform
the respondent of the changes required.
5.6.4 Q-sort
Q-sort can be called an extension to rank order scaling. It uses a rank order procedure in
which objects are sorted into piles based on similarity with respect to some pre-defined
criteria. It provides grouping according to the respondents’ preferences among a relative
larger number of objects quickly. For example, respondents may be provided with 70
different statements relating to their preference regarding a specific phenomenon on
individual cards. Thereafter, they can be asked to asked to place them into six different
categories ranging from most preferred to least preferred. This kind of sorting provides how
respondents group variables in their mind.
Measurement and scaling
WHAT‘S MISSING IN THIS EQUATION?
MAERSK INTERNATIONAL TECHNOLOGY & SCIENCE PROGRAMME
You could be one of our future talents
Are you about to graduate as an engineer or geoscientist? Or have you already graduated?
If so, there may be an exciting future for you with A.P. Moller - Maersk.
www.maersk.com/mitas
Please click the advert
Download free books at BookBoon.com
Marketing Research
76
5.7 Non-comparative scaling
As the name suggests, in non-comparative scaling, researchers use whatever rating standard
seems appropriate to them. Respondents answering non-comparative scale based questions do
not compare the object being rated either to another object or to some specified standard.
They evaluate only one object at a time. Non-comparative scaling involves two techniques
namely: continuous and itemized rating scales. Itemized scales are further divided in Likert,
semantic differential and stapel scale. Each of these scales will be discussed in details in this
section.
5.7.1 Continuous rating scale
Continuous rating scale is also known as graphic rating scale in which respondents rate the
objects by placing a mark at the appropriate position on a line that runs from one extreme
criterion to the other. The respondent is provided with the freedom here to choose a point
anywhere along the line and is not restricted to ranking only. The figure 5.2 below illustrates
various types of continuous rating scale which can be used in getting responses from the
respondents.
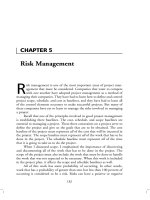
Figure 5.2:
Continuous rating scale
There can be various other types wherein the line can be changed from horizontal to vertical,
the scale points can be changed from positive to negative aspects and so on. Once the
respondent provides the rating on the line, the researcher divides the line into as many
categories as desired and assign scores based on the categories into which the ratings fall. In
the example above, we can observe that the respondent exhibits a very favourable opinion
towards the content quality of newspaper X. While they are easy to construct and understand,
inferences from continuous rating scale is cumbersome and at times unreliable. Furthermore,
Q. How would you rate newspaper X with regard to content quality?
Version 1:
The worst X The best
Version 2:
The worst X The best
0 20 40 60 80 100
Version 3:
The worst X The best
20 40 60 80 100
Very poor Neither poor Very good
Measurement and scaling
Download free books at BookBoon.com
Marketing Research
77
this scale provides little extra information to the researcher and therefore its usage in
marketing research was limited. However, with the advent of internet based surveys this
rating scale is seeing a revival as using computers it is easier to handle such scale.
5.7.2 Itemized rating scale
Itemized rating scales involve selection of a specific category out of various categories pre-
defined by the researcher. A brief description is associated with each category and
respondents are asked to select the best fitting category with the stimuli object. Itemized
scales are widely used in marketing research. Likert, semantic differential and stapel scale are
among the most used itemized rating scale and we shall describe them in details in this
section.
5.7.2.1 Likert scale
Likert scale is one of the highly used scales in marketing research which focuses on degree of
agreement or disagreement. The scale is named after Rensis Likert who developed the scale.
58
The respondent is presented with a series of statements about the stimulus objects and asked
to provide views on agreement or disagreement with each of the statement. A typical Likert
scale constitutes of five items ranging from ‘strongly disagree’ to ‘strongly agree’. For the
ease of statistics, researchers also associated numbers with Likert scale. Figure 5.3 below
provides an example of Likert scale.
Measurement and scaling
www.job.oticon.dk
Download free books at BookBoon.com
Marketing Research
78
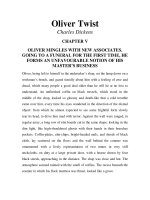
Figure 5.3:
An example of Likert Scale
The representation of Likert scale makes it easier for the respondents to answer the questions.
Researchers also use variety of number systems instead of 1 to 5, such as – 2 to + 2 or
reversing the number order from 5 to 1. The analysis on Likert scale can be conducted on
item basis or on the basis of the total score which can be calculated for each respondent by
summing across items. Likert scale can also help in developing comparison constructs. For
example, the scale can be repeated for Newspaper Y and the results can be compared. The
Likert scale has several advantages including ease of development and understanding. It can
be administer using any survey method. On the other hand, Likert scale can take much time to
complete as respondents have to read each statement and provide a response relating to it.
5.7.2.2 Semantic differential scale
Semantic differential scale includes a seven-point bi-polar scale in comparison to Likert’s
five-point scale. While in Likert each item number of scale is defined in semantic differential
scale the endpoints are clearly defined. For example, ‘satisfaction’ and ‘dissatisfaction’ can be
used as the endpoints. Figure 5.4 provides an example of semantic differential scale for
Newspaper X.
Q. Following are some statement relating too Newspaper X. Please indicate how
strongly you agree or disagree with the statements using the scale provided by
circling one of the numbers:
1 = Strongly disagree; 2 = Disagree; 3 = Neither agree nor disagree; 4 = Agree; 5 =
Strongly agree.
Strongly
Disagree
Disagree Neither
agree
nor
disagree
Agree Strongly
agree
a. Newspaper X has high
quality content
1 2 3 4 5
b. Newspaper X has the best
writers
1 2 3 4 5
c. Newspaper X has a
balance of local and
national coverage
1 2 3 4 5
d. Newspaper X is my
preferred newspaper
1 2 3 4 5
Measurement and scaling
Download free books at BookBoon.com
Marketing Research
79
Figure 5.4:
An example of semantic differential scale
In the above example, one can easily observe the pattern of respondent’s perceptions. The
respondent thinks that Newspaper X is hard to read but reliable and rational in its approach.
One of the advantages of semantic differential scale is the improved design wherein the
negative and positive aspects related to a stimuli object can be interchanged on right and left
side. This controls the tendency of many respondents with very positive or very negative
views, who tend to mark with a bias in their minds. For the ease of statistical analysis,
semantic differential scale can be scored on either -3 to + 3 or 1 to 7. Similar to Likert scale
semantic differential scale can also provide interesting comparison between brands, products,
organizations and so on.
5.7.2.3 Stapel scale
Stapel scale consists of a single criterion in the middle of an even-numbered range of values,
from -5 to +5, without a neutral point. The scale is generally presented vertically. The
respondents are asked to choose a specific number describing the stimuli object of concern on
the pre-defined criterion. Figure 5.5 provides a detailed description of Stapel scale. As it can
be seen from the figure that Stapel scale looks fairly similar to semantic differential scale
however, it’s represented by numbers. The data obtained from Stapel scale can be analysed in
the same way as semantic differential scale. The advantage of Stapel scale is that it does not
require any phrases to achieve bipolarity as required in semantic differential scale. Of all the
itemized rating scales, Stapel scale is least used in the field of marketing research. It is mainly
due to the thinking that respondents will not be able to understand the scale and might provide
a biased response.
Q. In this question we would like to know your perceptions regarding Newspaper
X. Please mark ‘X’ on each line that best indicates your perception. Please make
sure that you have put the mark on every line.
Newspaper X is:
Easy read : : : : :-X : : Hard read
Unreliable : : : : :-X : : Reliable
Modern : : : :-X : : : Old fashioned
Rational :-X : : : : : : Emotional
Measurement and scaling
Download free books at BookBoon.com
Marketing Research
80
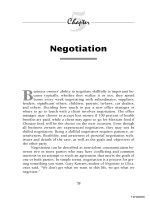
Figure 5.5:
An example of Stapel scale
Q. In this question we would like to know how accurately a keyword describes the
Newspaper X. If you think the keyword describes the Newspaper X very accurately
you should choose a higher positive number. In case you think that keyword does
not describe the Newspaper X very accurately choose a larger negative number.
You can select any number you feel appropriate.
+5 +5 +5
+4 +4 +4
+3 +3 +3
+2 +2 +2
+1 +1 +1
Content quality Price News coverage
-1 -1 -1
-2 -2 -2
-3 -3 -3
-4 -4 -4
-5 -5 -5
Measurement and scaling
By 2020, wind could provide one-tenth of our planet’s
electricity needs. Already today, SKF’s innovative know-
how is crucial to running a large proportion of the
world’s wind turbines.
Up to 25 % of the generating costs relate to mainte-
nance. These can be reduced dramatically thanks to our
systems for on-line condition monitoring and automatic
lubrication. We help make it more economical to create
cleaner, cheaper energy out of thin air.
By sharing our experience, expertise, and creativity,
industries can boost performance beyond expectations.
Therefore we need the best employees who can
meet this challenge!
The Power of Knowledge Engineering
Brain power
Plug into The Power of Knowledge Engineering.
Visit us at www.skf.com/knowledge
Please click the advert
Download free books at BookBoon.com
Marketing Research
81
5.8 Selecting an appropriate scale
Over the years, researchers have developed many scales of measurement and many
modifications have been suggested and used. As stated in the discussion above, the scales can
take many different forms and therefore it becomes utmost important for researchers to take
several important decisions while constructing these scales.
The decisions mostly pertain to (a) length of scale points; (b) balance of the scale; (c) forced
vs. nonforced scales; (d) scale description and presentation. Length of scale points has a direct
impact on respondent engagement. The longer the scale the higher the confusion however the
researcher can get finer details. This paradox between engagement versus detail is always
present within scales. Researchers over the years have suggested appropriate length be
anywhere between five to nine scale points. In most cases, researchers develop balanced scale
wherein favourable and unfavourable categories are equal however, sometimes unbalanced
scales are also used. Researchers must take extra precaution in analysing unbalances scale.
Forced scale choice is important when researchers are asking respondents about sensitive
issues. Many times when it comes to sensitive issues, respondents tend to stay in the neutral
ground and researcher may not be able to capture the real response. In such circumstance
forced scale where the neutral point is removed is quite helpful. The scale description in
words and the presentation may also deter respondents’ engagement and therefore, extra care
must be taken in developing an appropriate scale.
5.9 Scale evaluation
While researchers always attempt to develop a robust and appropriate scale to measure a
specific phenomenon, error in measurement can occur due to very many reasons. Researchers
have identified various sources of error in measurement. These include:
a. Respondent error: respondent characteristics such as intelligence, education can affect
the test score.
b. Short-term personal factors: such as fatigue, stress, anxiety
c. Situational factors: such as noise in the surroundings, presence of other people
d. Clarity errors: such as poor framing of question or scale
e. Mechanical errors: such as poor printing, recording error and poor design
f. Interviewer error: interviewer differences and their bias in interviewing
g. Analysis error: inappropriate methods of analysis used.
The above mentioned errors can affect the real results being reported. Researchers have
defined errors in two broad streams namely, systematic error and random error. Systematic
error affects the measurement constantly while random error, as the name suggests is random
in nature. To avoid such errors and control the research process, after developing an
appropriate scale, researcher must assess the scale on three dynamic constructs: validity,
reliability and generalizability. Validity can be measured by examining content, criterion and
Measurement and scaling
Download free books at BookBoon.com
Marketing Research
82
construct validity. Construct validity is divided into three parts namely, convergent,
discriminant and nomological validity. Reliability can be assessed by examining test/retest
reliability, alternative forms reliability and internal consistency reliability. Figure 5.6
represents the classification graphically.
Figure 5.6:
Scale evaluation classification
5.9.1 Validity
Validity of a scale is defined as the extent to which differences in observed scale scores
reflect the true differences among objects on the characteristics being measured.
59
In simple
words, by testing validity researcher can decide is the scale measuring what it is meant to
measure. A perfectly valid scale will have no measurement errors.
As the name suggests, content validity (or face validity as it is called some other times) refers
to the content of the scale. It involves a subjective but systematic evaluation of how well the
content represents the task at hand. At times, researchers as well as some other experts in the
field are asked to look at the scale and provide their opinion as to weather the scale measures
the phenomenon. Being a subjective evaluation technique it is not considered a sufficient
measure of the validity of a scale. Criterion validity refers to examining whether the
measurement scale performs as expected in relation to other variables selected as meaningful
criteria. Construct validity is the bridge between theory and the scale. It explains the questions
of what construct or characteristic the scale is measuring and what deductions can be made
concerning the theory underlying the scale.
Scale evaluation
Reliability Validity
Test/retest
Alternative forms
Internal consistency
Content
Convergent Discriminant Nomological
Criterion Construct
Generalizability
Measurement and scaling
Download free books at BookBoon.com
Marketing Research
83
Construct validity is classified into three parts namely: convergent, discriminant and
nomological validity. Convergent validity focuses on how well the scale’s measurement
positively correlates with different measurements of the same scale. Discriminant validity
refers to the fact that the scale being investigated does not significantly correlate with other
constructs that are operationalized as being different. Nomological validity allows researchers
to evaluate how well one particular construct theoretically networks with other established
constructs that are related yet different.
5.9.2 Reliability
Reliability in research relates to consistency of results over a period of time. A scale is called
reliable if it produces consistent results when repeated measurements are made.
60
Systematic
errors do not have an effect on reliability however random errors do. There are three ways in
which reliability is measured: test-retest reliability, alternative forms reliability and internal
consistency reliability.
Measurement and scaling
Please click the advert
Download free books at BookBoon.com
Marketing Research
84
As the name suggests, in test-retest reliability measurement, same respondents are
administered identical sets of scale items at two different times (usually 2 – 4 weeks). The
degree of similarity between the measurements (measured through correlation between both
measurements) determines the reliability. The higher the correlation between the two
measurements, the higher the scale reliability. In measuring alternative forms reliability, two
equivalent forms of the scale are constructed and then the same respondents are measured at
two different times.
61
Internal consistency reliability is used to assess the reliability of a
summated scale where several items are summated to form a total score. In simple words,
each item in the scale must measure part of what the scale is developed to measure. Various
techniques such as ‘split-half reliability’ or ‘coefficient alpha’ (also known as Cronbach’s
alpha) are used to measure internal consistency reliability. In split-half reliability the scale is
broken in two halves and the resulting half scores are correlated. High correlation between the
two halves shows higher internal consistency. In case of coefficient alpha the average of all
possible split-half coefficients is calculated. The value beyond 0.7 suggests acceptable
internal reliability.
62
5.9.3 Generalizability
Generalizability refers to the extent to which one can generalize from the observations at hand
to a universe of generalizations.
63
For example, a researcher may wish to generalize a scale
developed for use in personal interviews to other modes of data collection, such as mall-
intercept and telephone interviews. Likewise, one may wish to generalize from a sample of
observers to a universe of observers, from a sample of times of measurement to the universe
of times of measurement, from a sample of items to the universe of items and so on.
64
To
generalize to other universes, generalizability theory procedures must be employed.
5.10 Conclusion
In this chapter we focused on the concepts of measurement and scaling. Both these constructs
are very important in marketing research as they help in developing a better construct
measurement, appropriate analysis and provide ease of interpretation and communication of
the findings. Scales of measurement have four fundamental properties: assignment property,
order property, distance property and origin property. The progression into each property is
such that the later scale possesses the earlier scale’s property. For example, origin property
possesses assignment, order and distance properties.
There are four primary scales of measurement namely: nominal, ordinal, interval and ratio scale.
Nominal scale possesses only assignment property; ordinal scale possesses order property,
interval scale possesses distance property and ratio scale possesses origin property. However,
as stated above it can be understood that ratio scale in a way possesses all the four properties.
Measurement and scaling
Download free books at BookBoon.com
Marketing Research
85
Comparative and non-comparative scaling are the two types of scaling methods used in
marketing research. Comparative scaling includes paired comparison, rank order, constant
sum and q-sort scaling techniques. Non-comparative scaling includes two types: continuous
rating and itemized rating scales. Itemized scaling is further divided into Likert, semantic
differential and Stapel scaling.
Selecting an appropriate scale requires consideration of various factors including (a) length of
scale points; (b) balance of the scale; (c) forced vs. nonforced scales; (d) scale description and
presentation. Scales should also be evaluated on for their validity, reliability and
generalizability. There are three major types of validity measured by researchers: content,
criterion and construct validity. Construct validity is further divided into convergent,
discriminant and nonological validity. There are three types of reliability measures including
test/retest, alternative forms and internal consistency reliability.
Measurement and scaling
2009
Student
Discounts
Student
Events
Money
Saving Advice
Happy
Days!
+
+
=
Please click the advert
Download free books at BookBoon.com