summary of the doctor thesis studying of the phase transition in linear sigma model
Bạn đang xem bản rút gọn của tài liệu. Xem và tải ngay bản đầy đủ của tài liệu tại đây (2.03 MB, 26 trang )
MINISTRY OF EDUCATION AND TRAINING MINISTRY OF SCIENCE AND TECHNOLOGY
VIETNAM ATOMIC ENERGY INSTITUTE
NGUYEN VAN THU
STUDYING OF THE PHASE TRANSITION
IN LINEAR SIGMA MODEL
A SUMMARY OF THE DOCTOR THESIS
Speciality: Theoritical and mathematical physics
Code : 62.44.01.01
Scientific supervisors
PROF. DR. TRAN HUU PHAT
DR. NGUYEN TUAN ANH
HANOI, 2011
THIS THESIS WAS COMPLETED AT INSTITUTE FOR NUCLEAR
SCIENCE AND TECHNIQUE – VIETNAM ATOMIC ENERGY
INSTITUTE
Scientific supervisor: PROF. DR. TRAN HUU PHAT
DR. NGUYEN TUAN ANH
First referee:
Prof. Dr. Nguyen Xuan Han
Second referee:
Prof. Dr. Nguyen Vien Tho
Third referee:
Prof. Dr. Dang Van Soa
This thesis will be defended in the Scientific Counsil of Vietnam Atomic
Energy Institute held on May 28, 2012
THIS THESIS MAY BE FOUND AT THE VIETNAM NATIONAL
LIBRARY AND ATOMIC ENERGY LIBRARY
1
INTRODUCTION
1. The research topic
The phase structure of QCD plays an impotant role in morden physics,
attracting intense experimental and theoretical investigations.
Some theories and models are used in order to study the phase structure
of QCD, for example, chiral pertubative theory, Nambu-Jona-Lasinio (NJL)
model, Poliakov-NJL (PNJL) model, linear sigma model (LSM).
Up to now the study of linear sigma model is still not complete. It is the
reasons why we choose subject “Studying of the phase transition in linear
sigma model”.
2. History of problem
Studying of D. K. Campell, R. F. Dashen, J. T. Manassah is the first
paper, in which they studied LSM with two different forms of the symmetry
breaking term (standard case and non-standard case) but they are restricted only
within tree-level approximation.
In higher order approximation, present papers are researched in Hatree-
Fock (HF) approximation, expanded N – large or isospin chemical potential
(ICP) is neglected. The study of the non-standard case is so far still absent.
When constituent quarks are presented, in the framework of NJL and
PNJL models the researchs are quite complete. Meanwhile the linear sigma
model with constituent quarks (LSMq) the present researchs only consider the
case in which ICP is vanished.
The studies of chiral phase transition in compactified space – time are in
first stage so far.
3. The aims of thesis
- Studying of the phase structure of LSM and LSMq with two different forms of
symmetry breaking term: the standard case and non – standard case.
2
- Studying of the effect from neutrality condition on the phase structure of
LSM and LSMq.
- Studying of the chiral phase transition in compactified space – time.
4. The subject, research problems and scope of thesis
- Studying of the phase structure of LSM at finite value of temperature T and
isospin chemical potential with and without neutrality condition and two
different forms of symmetry breaking term.
- Studying of phase structure of LSMq at finite value of temperature, ICP and
quark chemical potential (QCP) with and without neutrality condition and two
different forms of symmetry breaking term.
- Studying of the chiral phase transition in compactified space – time when ICP is zero.
5. The method
In this thesis we combine the mean – field theory and effective action
Cornwall – Jackiw – Tomboulis (CJT) in order to research the phase structure
of LSM and LSMq.
6. The contribution of thesis
This thesis has many contributions in morden physics.
7. The structure of thesis
The thesis includes 133 pages, 106 figures and 61 references. Besides
introduction, conclusion, appendices and references, this consists of 3 chapters:
Chapter 1. Phase structure of linear sigma model without constituent quarks.
Chương 2. Phase structure of linear sigma model with constituent quarks.
Chapter 3. Chiral phase transition in compactified space – time.
3
CHAPTER 1. PHASE STRUCTURE OF LINEAR SIGMA MODEL
WITHOUT CONSTITUENT QUARKS
1.1. The linear sigma model
- Lagrangian
- The standard form
- The non – standard form
1.2. Phase structure in standard case
1.2.1. Chiral phase transition in case isospin chemical potential is
vanishing
1.2.1.1. Chiral limit
In tree – level approximation pions are Goldstone bosons.
In two – loop expanded and HF approximation, there Goldstone bosons are
not preserved.
In order to preserve Goldstone bosons we introduced improved
Hatree – Fock (IHF) approximation. In this approximation we obtain
- The gap equatiion
- Numerical computation with parameters MeV,
MeV, MeV.
4
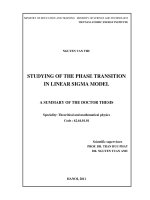
Fig. 1.1. The chiral condansate
as a function of temperature.
Fig. 1.2. The evolution of effective potential
versus u. From the top to bootom the graphs
correspond to T = 200 MeV, T
c
= 136.6 MeV
và T = 100 MeV.
20 40 60 80 100 120 140
0.0
0.2
0.4
0.6
0.8
1.0
T
MeV
u
f
0 20 40 60 80 100
10
5
0
5
10
15
20
u
MeV
V
MeV.fm
3
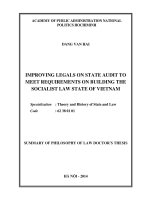
Fig.
1.
3
.
The chiral condensate as a function of
T
in physical world.
100 200 300 400 500
0.0
0.2
0.4
0.6
0.8
1.0
1.2
T
MeV
u
f
1.2.1.2. Physical world
- The gap equation
- Schwinger–Dyson (SD) equations
- Numerical results
5
Fig. 1.4. The evolution of effective masses of pion and sigma versus temperature.
M
M
0 50 100 150 200 250 300
0
200
400
600
800
T
MeV
M
,
MeV
1.2.2. Phase structure at finite T and
1.2.2.1. Chiral limit
In tree – level approximation
is Goldstone boson. In HF and
expanded 2-loop approximation there is no Goldstone boson. Using IHF
approximation becomes Goldstone boson and we get
- The gap equation
.
- SD equations
- The numerical computation
gives the phase diagram The
phase diagram in Fig. 1.8.
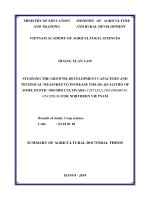
Fig. 1.8. Phase diagram in
-plane compares with those
form HF approximation and
expanded N-large. In IHF
approximation, the solid and
dashed lines correspond to first
and second-order phase transition.
v
0
v
0
IHF
Large N
HF
C
0 50 100 150 200 250 300
0
50
100
150
200
250
300
I
MeV
T
MeV
6
1.2.2.2. Physical world
- The gap equations
- SD equations
- The phase diagram
1.3. Phase structure in non – standard case
Calculations in tree – level approximation give Goldstone boson for
component. However, in HF approximation with 2-loop expanded gives
no Golstone boson. Employing IHF approximation in order to preserve
Goldstone boson we lead
- The gap equations
- SD equations
Fig. 1.13. Phase giagram of pion condensate in physical world. This result is
compared with those in HF and expanded N-large.
v
0
v
0 IHF
Large N
HF
0 100 200 300 400
0
50
100
150
200
250
300
I
MeV
T
MeV
7
m
v
0
v
0
0 100 200 300 400
0
50
100
150
200
250
300
I
MeV
T
MeV
u
0
u
0
0 50 100 150
100
120
140
160
180
200
I
MeV
T
MeV
- In Figs. 1.20 and 1.24 we plot the phase diagrams are obtained from
numerical computation for pion and chiral condensates
1.4. The effect from neutrality condition
- The whole system is neutral in broken phase if it is in equilibrium with the
pion-decay processes
- The neutrality condition
- Basing on above equations, we calculate numerically in order to study
the effect from neutrality condition on the phase structure with two
different forms of symmetry breaking term.
- In these numerical computation we set electron mass to be zero.
Fig. 1.20. The phase diagram of
pion condensate.
Fig. 1.24. The phase diagram of
chiral condensate.
8
1.4.1. The standard case
Fig. 1.25. The pion condensate in
chiral limit within neutrality condition
(solid line) and without neutrality
condition (dashed line) at = 300
MeV.
Fig. 1.26. The pion condensate in
chiral limit with neutrality condition.
Starting from the top the lines
correspond to = 0, 1/4, 1/2.
Fig. 1.27. The pion condensate in
physical world. The solid, dashed and
dotted lines correspond to = 0, 1/4,
1/2.
Fig. 1.28. The chiral condensate in
physical world. The solid and dashed
lines correspond to = 0, 1/4.
0 50 100 150 200 250 300
0.0
0.2
0.4
0.6
0.8
1.0
T
MeV
v
T
v
0
0 50 100 150 200 250 300
0.0
0.2
0.4
0.6
0.8
1.0
1.2
1.4
MeV
v
f
0 100 200 300 400 500
0.0
0.2
0.4
0.6
0.8
1.0
I
MeV
u
f
100 120 140 160 180 200
0.0
0.1
0.2
0.3
0.4
0.5
0.6
I
MeV
v
f
9
0 50 100 150 200
0.0
0.2
0.4
0.6
0.8
1.0
T
MeV
v
T
v
0
0 50 100 150 200
0.0
0.2
0.4
0.6
0.8
1.0
T
MeV
u
T
u
0
1.4.2. The non – standard case
1.5. The comments
1. In the standard case:
- We affirm that in chiral limit the chiral phase transition is second – order.
It is clearly answer about a question which has been disputing for a long
time.
- In physical world, the pion condensate appears at and phase
transition of pion condensate is second – order. The chiral symmetry gets
restored at high values of T for fixed and of for fixed T.
2. In the non – standard case, this is the first time the phase structrure of
LSM has completely considered in high order approximation of effective
potential.
3. The effects from neutrality on phase structure are studied in detial.
Fig. 1.30. The pion condensate versus
T. The solid (dashed) line corresponds
to with (without) neutrality conditiion.
Dashed line is ploted at = 200MeV.
Fig. 1.32. The chiral condensate
versus T. The solid (dashed) line
corresponds to with (without)
neutrality conditiion. Dashed line is
ploted at = 100MeV.
10
CHAPTER 2. PHASE STRUCTURE OF LINEAR SIGMA MODEL
WITH CONSTITUENT QUARKS
2.1. The effective potential in mean – field theory
- Lagrangian
- The effective potential in mean – field theory (MFT)
2.2. The standard case
- The gap equations
- Parameters of model: = 138 MeV, = 500 MeV, = 93 MeV, =
12, = 5.5 MeV, .
2.2.1. Chiral limit
11
2.2.2. Physical world
Fig. 2.5. The evolution of pion
condensate at = 100 MeV.
Fig. 2.5. Phase diagram of pion
condensate. From the bottom to top the
graphs correspond to = 100, 200, 300
MeV
v
0
v
0
0 50 100 150 200 250 300
0
20
40
60
80
100
120
140
MeV
T
MeV
Fig. 2.9. The evolutioin of pion
condensate at = 0, = 192
MeV.
Fig. 2.12. Phase diagram v = 0
at = 50 MeV.
12
2.3. Non – standard case
- The gap equations
- Parameters = 0 và .
Fig. 2.20. Chiral condensate in region
. From the right to left = 0,
100, 200, 220MeV.
Fig. 2.21. Phase diagram of chiral
condensate in region .
Fig. 2.24. Chiral condensate at = 150
MeV. From the right to left T = 0, 50,
100 MeV.
Fig. 2.27. Chiral condensate at = 300
MeV. From the right to left T = 0, 50,
100 MeV.
0 50 100 150 200 250 300 350
0.0
0.2
0.4
0.6
0.8
1.0
T
MeV
u
f
CEP
0 100 200 300 400 500 600
0
50
100
150
200
MeV
T
MeV
0 100 200 300 400 500 600
0.0
0.2
0.4
0.6
0.8
1.0
MeV
u
f
0 100 200 300 400 500 600
0.00
0.05
0.10
0.15
0.20
0.25
MeV
u
f
13
2.3.1. Region
2.3.2. Region
2.4. The effects from neutrality condition
- The matter must be stable under the weak processes like
Fig. 2.36. The pion condensate as a
function of T at = 0 and = 192
MeV.
Fig. 2.34. Phase diagram v = 0. From
the bottom to top = 138, 200, 300
MeV.
Fig. 2.41. The chiral condensate as a
function of T and .
Fig. 2.45. Phase diagram of chiral
condensate in -plane.
LQCD
LSMq
PNJL
0.6 0.7 0.8 0.9 1.0 1.1 1.2
0.0
0.2
0.4
0.6
0.8
1.0
T
T
C
v
T
v
0
v
0
v
0
0 50 100 150 200 250
0
20
40
60
80
100
120
140
MeV
T
MeV
u
0
u
0
0 50 100 150 200
0
20
40
60
80
100
MeV
T
MeV
14
.
- The neutrality condition reads as
- The electron mass is neglected in our numerical computation.
2.4.1. The standard case
2.4.2. The non – standard case
Fig. 2.53. Phase diagram v = 0 with > and neutrality condition (solid
line) and without neutrality condition at = 200 MeV (dashed line).
v
0
v
0
0 50 100 150 200 250 300
0
20
40
60
80
100
120
140
MeV
T
MeV
Fig. 2.47. Phase diagram v = 0 in
chiral limit. The solid and dashed
lines correspond to with and without
neutrality condition and = 232.6
MeV).
Fig. 2.49. Phase diagram u = 0 in
physical world. From the bottom to
top = 0, 0.25, 0.3. The solid
(dashed) line corresponds to first
(second) – order phase transition.
u
0
u
0
M N
0 500 1000 1500 2000
0
500
1000
1500
2000
MeV
T
MeV
v
0
v
0
0 50 100 150 200 250
0
20
40
60
80
100
120
140
MeV
T
MeV
15
Fig. 2.55. Phase diagram u = 0 in region < with neutrality condition.
u
0
u
0
m
0 20 40 60 80 100 120
0
20
40
60
80
100
120
I
MeV
T
MeV
2.5. The comments
1. This is the first time the phase structure of LSMq is considered versus
ICP, QCP and temperature. Meanwhile the current quark mass is included
in our study.
2. One of the important resluts we obtained is phase diagram in -
plane has a CEP, which separates first and second – order of phase
transition. This result is suitable with those prediction of LQCD.
3. The effects form neutrality on phase structure are completely
considered.
16
CHAPTER 3. CHIRAL PHASE TRANSITON IN COMPACTIFIED
SPACE - TIME
3.1. Chiral phase transition without Casimir effect
3.1.1. The effective potential and gap equations
- The potential
- The effective potential in MFT
- Neglecting the Casimir energy
.
- The dispersion relation
in which for untwisted quark (UQ) and for
twisted quark (TQ).
- The gap equation
3.1.2. Numerical computation
3.1.2.1. Chiral limit
- In chiral limit we set
- At = 50 MeV the phase diagram obtained from numerical computation
for UQ and TQ are ploted in Fig. 3.3.
17
- Characteristics of the phase diagram at different value of is the same
as at MeV.
- In chiral limit, chiral phase transition of UQ is always first – order,
meanwhile for TQ chiral phase transition has both the first and second –
order and of course it exists a critical point C.
3.1.2.2. Physical world
Fig. 3.3. Phase diagram of chiral condensate in chiral limit at
= 50 MeV for UQ (left) and TQ (right).
Fig. 3.6b. Phase diagram of
chiral condensate for UQ in
physical world at = 50 MeV.
Fig. 3.9b. Phase diagram of
chiral condensate for TQ in
physical world at = 50 MeV.
18
- The results are similar for different value of .
- In physical world, chiral phase transition for UQ has both first – order
and crossover. Two kinds of phase transition are sapareted by a CEP. For
TQ chiral phase transition is always the crossover.
3.2. Chiral phase transition driven by Casimir effect
3.2.1. Casimir energy
- The Casimir energy
- Using Abel-Plana relation we calculate Casimir energy for UQ
And for TQ
- Taking to account Casimir energy the effective potential has the form
for UQ and
for TQ.
19
Fig. 3.12a. Phase diagram of chiral
condensate for UQ in chiral limit.
From the top to bottom the graphs
correspond to = 0, 100 MeV.
3.2.2. Numerical computation
3.2.2.1. Chiral limit
- In chiral limit, chiral condensate of UQ is first – order everywhere,
meanwhile for TQ it exists both first and second - order.
Fig. 3.11a. Chiral condensate of
UQ in chiral limit at = 100
MeV. The solid, dashed and
dotted lines correspond to a = 0,
0.152, 0.253 fm
-1
.
Fig. 3.11b. Chiral condensate of
TQ in chiral limit at = 100
MeV. The solid, dashed and
dotted lines correspond to a = 0,
0.253, 0.507 fm
-1
.
Fig. 3.12b. Phase diagram of
chiral condensate for TQ in
chiral limit. From the top to
bottom the graphs correspond to
= 0, 100 MeV.
20
3.2.2.2. Physical world
- In physical world chiral phase transition of TQ has only crossover,
meanwhile for UQ it shows both first – order and crossover.
3.3. The comments
After discussing about the results, we find relation between the chiral
phase transition and Hohenberg theorem. For example, we consider in
chiral limit at = 50 MeV.
Fig. 3.14a. Chiral condensate of UQ in
physical world at = 50 MeV. The
solid, dashed, dotted lines correspond
to a = 0, 0.253, 1.014 fm
-1
.
Fig. 3.15a. Phase diagram of chiral
condensate for UQ in physical world.
From the top the lines correspond to
= 0, 50 MeV.
Fig. 3.14b. Chiral condensate of TQ in
physical world at = 50 MeV. The solid,
dashed, dotted lines correspond to a = 0,
0.253, 1.014 fm
-1
.
Fig. 3.15b. Phase diagram of chiral
condensate for TQ in physical
world. From the top the graphs
correspond to = 0, 50 MeV.
21
a) For UQ
- This result shows that u approaches to 0 when a increases, it means that
Hohenberg theorem is satisfied.
b) For TQ
- This result of TQ shows
- In this case the anti-periodic boundary condition is equivalent to the
present of external field and Hohenberg theorem is satisfied, too.
Hình 3.17. The a dependence of chiral condensate in chiral limit for UQ at = 50
MeV and T = 100 MeV (solid line), 150 MeV (dashed line), 200 MeV (dotted line).
Fig. 3.18. The a dependence of chiral condensate in chiral limit for TQ at = 50
MeV. The solid, dashed, dotted lines correspond to T = 50, 80, 100 MeV (left panel)
and T = 150, 200, 250 MeV (right panel).
22
CONCLUSION
In this thesis we have investigated systematically the phase structure
of the linear sigma model by means of the improved Hatree – Fock
approximation, where Goldstone theorem is preserved and self-consistancy
of theory is satisfied. Among many results obtained the most remarkable
results are in order:
1. We found the chiral phase diagram of the linear sigma model in
which the pion condensation was incorporated into consideration.
This is the major success of the thesis. Moreover we proved that the
chhiral phase transition in chiral limit is second – order if the
Goldstone theorem was respected.
2. Taking into account the present of quarks, the phase diagram in
- plane has a CEP, this result coincides with prediction of
LQCD.
3. The critical temperature of chiral phase transition depends on the
length of compactified space – time.
Some outlooks:
1. Study phase structure of QCD in Polyakov – LSM in order to study
phase structure of QCD in high QCP region.
2. Due to the fact that the critical temperature of phase transition
depends on the compactifcation length then the present study might
be helpful to explore many physical properties of high temperature
superconductors, and, moreover, it can be also applied to studying
the Bose - Einstein condensation in (2D + ) - dimensional space.
23
LIST OF PAPERS RELATE TO THIS THESIS
1. Tran Huu Phat and Nguyen Van Thu, Phase structure of the linear
sigma model with the non-standard symmetry breaking term, J.
Phys. G: Nucl. and Part. 38, 045002, 2011.
2. Tran Huu Phat and Nguyen Van Thu, Phase structure of the linear
sigma model with the standard symmetry breaking term, Eur.
Phys. J. C 71, 1810 (2011).
3. Tran Huu Phat, Nguyen Van Thu and Nguyen Van Long, Phase
structure of the linear sigma model with electric neutrality
constraint, Proc. Natl. Conf. Nucl. Scie. and Tech. 9 (2011), pp.
246-256.
4. Tran Huu Phat, Nguyen Van Long and Nguyen Van Thu,
Neutrality effect on the phase structure of the linear sigma model
with the non-standard symmetry breaking term, Proc. Natl. Conf.
Theor. Phys. 36, (2011), pp. 71-79
5. Tran Huu Phat and Nguyen Van Thu, Casimir effect and chiral
phase transition in compactified space-time, submitted to Eur.
Phys. J. C.
6. Tran Huu Phat and Nguyen Van Thu, Phase structure of linear
sigma model without neutrality (I), Comm. Phys. Vol. 22, No. 1
(2012), pp. 15-31.
7. Tran Huu Phat and Nguyen Van Thu, Phase structure of linear
sigma model with neutrality (II), Comm. Phys., to be published.
8. Tran Huu Phat and Nguyen Van Thu, Phase structure of linear
sigma model with constituent quarks: Non-standard case,