Data Mining Tutorial
Bạn đang xem bản rút gọn của tài liệu. Xem và tải ngay bản đầy đủ của tài liệu tại đây (3.18 MB, 102 trang )
Data Mining Tutorial
Data Mining Tutorial
D. A. Dickey
April 2012
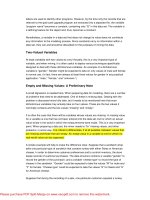
Data Mining - What is it?
•
Large datasets
•
Fast methods
•
Not significance testing
•
Topics
–
Trees (recursive splitting)
–
Logistic Regression
–
Neural Networks
–
Association Analysis
–
Nearest Neighbor
–
Clustering
–
Etc.
Trees
•
A “divisive” method (splits)
•
Start with “root node” – all in one group
•
Get splitting rules
•
Response often binary
•
Result is a “tree”
•
Example: Loan Defaults
•
Example: Framingham Heart Study
•
Example: Automobile fatalities
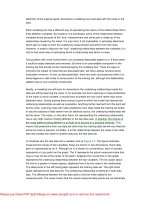
Recursive Splitting
X1=Debt
To
Income
Ratio
X2 = Age
Pr{default} =0.007
Pr{default} =0.012
Pr{default} =0.0001
Pr{default} =0.003
Pr{default} =0.006
No default
Default
Some Actual Data
•
Framingham Heart
Study
•
First Stage Coronary
Heart Disease
–
P{CHD} = Function of:
•
Age - no drug yet!
•
Cholesterol
•
Systolic BP
Import
Example of a “tree”
All 1615 patients
Split # 1: Age
“terminal node”
Systolic BP
How to make splits?
•
Which variable to use?
•
Where to split?
–
Cholesterol > ____
–
Systolic BP > _____
•
Goal: Pure “leaves” or “terminal nodes”
•
Ideal split: Everyone with BP>x has
problems, nobody with BP<x has
problems
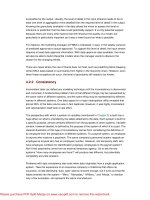
Where to Split?
•
First review Chi-square tests
•
Contingency tables
95 5
55 45
Heart Disease
No Yes
Low
BP
High
BP
100
100
DEPENDENT
75 25
75 25
INDEPENDENT
Heart Disease
No Yes
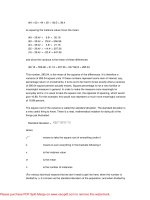
χ
2
Test Statistic
•
Expect 100(150/200)=75 in upper left if
independent (etc. e.g. 100(50/200)=25)
95
(75)
5
(25)
55
(75)
45
(25)
Heart Disease
No Yes
Low
BP
High
BP
100
100
150 50 200
∑
−
=
allcells
ected
ectedobserved
exp
)exp(
2
2
χ
2(400/75)+
2(400/25) =
42.67
Compare to
Tables –
Significant!
WHERE IS HIGH BP CUTOFF???
Measuring “Worth” of a Split
•
P-value is probability of Chi-square as
great as that observed if independence is
true. (Pr {χ
2
>42.67} is 6.4E-11)
•
P-values all too small.
•
Logworth = -log
10
(p-value) = 10.19
•
Best Chi-square max logworth.
Logworth for Age Splits
Age 47 maximizes logworth
?
How to make splits?
•
Which variable to use?
•
Where to split?
–
Cholesterol > ____
–
Systolic BP > _____
•
Idea – Pick BP cutoff to minimize p-value
for χ
2
•
What does “signifiance” mean now?
Multiple testing
•
50 different BPs in data, 49 ways to split
•
Sunday football highlights always look
good!
•
If he shoots enough times, even a 95% free
throw shooter will miss.
•
Tried 49 splits, each has 5% chance of
declaring significance even if there’s no
relationship.
Multiple testing
α =
Pr{ falsely reject hypothesis 1}
α =
Pr{ falsely reject hypothesis 2}
Pr{ falsely reject one or the other} < 2α
Desired: 0.05 probabilty or less
Solution: use α = 0.05/2
Or – compare 2(p-value) to 0.05
Multiple testing
•
50 different BPs in data, m=49 ways to split
•
Multiply p-value by 49
•
Bonferroni – original idea
•
Kass – apply to data mining (trees)
•
Stop splitting if minimum p-value is large.
•
For m splits, logworth becomes
-log
10
(m*p-value)
! ! !
Other Split Evaluations
•
Gini Diversity Index
–
{ A A A A B A B B C B}
–
Pick 2, Pr{different} = 1-Pr{AA}-Pr{BB}-Pr{CC}
•
1-[10+6+0]/45=29/45=0.64 LESS DIVERSE
–
{ A A B C B A A B C C }
•
1-[6+3+3]/45 = 33/45 = 0.73 MORE DIVERSE, LESS
PURE
•
Shannon Entropy
–
Larger more diverse (less pure)
–
-Σ
i
p
i
log
2
(p
i
)
{0.5, 0.4, 0.1} 1.36 (less diverse)
{0.4, 0.3, 0.3} 1.74 (more diverse)
Goals
•
Split if diversity in parent “node” >
summed diversities in child nodes
•
Observations should be
–
Homogeneous (not diverse) within leaves
–
Different between leaves
–
Leaves should be diverse
•
Framingham tree used Gini for splits
Validation
•
Traditional stats – small dataset, need all
observations to estimate parameters of
interest.
•
Data mining – loads of data, can afford
“holdout sample”
•
Variation: n-fold cross validation
–
Randomly divide data into n sets
–
Estimate on n-1, validate on 1
–
Repeat n times, using each set as holdout.
Pruning
•
Grow bushy tree on the “fit data”
•
Classify holdout data
•
Likely farthest out branches do not
improve, possibly hurt fit on holdout data
•
Prune non-helpful branches.
•
What is “helpful”? What is good
discriminator criterion?
Goals
•
Want diversity in parent “node” >
summed diversities in child nodes
•
Goal is to reduce diversity within leaves
•
Goal is to maximize differences between
leaves
•
Use validation average squared error,
proportion correct decisions, etc.
•
Costs (profits) may enter the picture for
splitting or pruning.
Accounting for Costs
•
Pardon me (sir, ma’am) can you spare
some change?
•
Say “sir” to male +$2.00
•
Say “ma’am” to female +$5.00
•
Say “sir” to female -$1.00 (balm for
slapped face)
•
Say “ma’am” to male -$10.00 (nose splint)
Including Probabilities
True
Gender
M
F
Leaf has Pr(M)=.7, Pr(F)=.3. You say:
Sir Ma’am
0.7 (2)
0
.
3
(
-
1
)
0.7 (-10)
0.3 (5)
Expected profit is 2(0.7)-1(0.3) = $1.10 if I say “sir”
Expected profit is -7+1.5 = -$5.50 (a loss) if I say “Ma’am”
Weight leaf profits by leaf size (# obsns.) and sum
Prune (and split) to maximize profits.
+$1.10 -$5.50
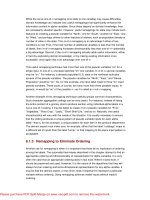
Additional Ideas
•
Forests – Draw samples with replacement
(bootstrap) and grow multiple trees.
•
Random Forests – Randomly sample the
“features” (predictors) and build multiple
trees.
•
Classify new point in each tree then
average the probabilities, or take a
plurality vote from the trees
* Cumulative Lift Chart
- Go from leaf of most
to least predicted
response.
- Lift is
proportion responding in first p%
overall population response rate
Lift
3.3
1