Geography and Oceanography - Chapter 16 ppsx
Bạn đang xem bản rút gọn của tài liệu. Xem và tải ngay bản đầy đủ của tài liệu tại đây (8.84 MB, 52 trang )
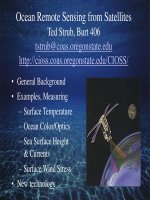
Ocean Remote Sensing from Satellites
Ted Strub, Burt 406
• General Background
• Examples, Measuring
– Surface Temperature
– Ocean Color/Optics
– Sea Surface Height
& Currents
– Surface Wind Stress
• New technology
Gulf Coast oil spill: Satellite “images” may “track” surface features: IR surface
temperatures, visible features, …??? What can we really see?
Early Days 1888
Remote Sensing Pioneers
Why Satellites?
• Oceans are vast, sparsely occupied – satellites provide uniform
sampling, daily-to-monthly fields.
• Ship time is expensive
• Satellites can acquire measurements quickly over large areas
BUT…
• Space: a harsh environment for acquiring measurements
• Cost – Satellites are also expensive, but “global” (international)
• Risk – If satellites fail, service calls are even more expensive
• Must measure through intervening atmosphere
• Can‟t acquire sub-surface measurements
• Can only measure a half-dozen variables, at the “surface” –
• But: We can measure wind forcing and response
The blue ship tracks take ~ 1-2 weeks in the case below. Patterns of cold water
(whiter shades) and currents change in 4 days between images.
The temperature field constructed from ship observations (circles, below
right) over a 1-week period shows some of the features evident in the
instantaneous satellite image (below left), without the detailed filaments and
swirls caused by jets and eddies in the currents, which the satellite field
captures in a “snapshot” (clouds allowing?) (August, 2000).
Using IR or Microwave Wavelengths
signal
raw data
processing /
dissemination
calibration/
validation
sensor
IR or μ-wave
Emission
Two types of
remote sensing:
Passive
Components of an active radar “altimeter” system
For sea level: Transmit at nadir (directly beneath satellite)
source and sensor
signal
raw data
processing /
dissemination
calibration/
validation
Two types of
remote sensing:
Active
μ-wave radar
Reflection
Geostationary Orbit - GEO
36,000km altitude (wide view)
Stays over same location
Can document evolving systems
High temporal resolution
Lower spatial resolution?
Not necessarily – can “stare”
for longer exposures.
No polar coverage
“Polar” Orbit (Low Earth Orbit LEO)
850-1000 km altitude
Travels nearly over poles
Sees almost whole globe
Lower temporal resolution
Higher spatial resolution?
Not necessarily – limited time over
each point.
Orbits Determine Sampling
Examples of several types of orbits.
The Earth’s center of mass must be in the orbital plane – so Geostationary orbits
must be in the Equatorial plane. Low Earth Orbits are inclined from the
equatorial plane. Specialized orbits are used for different purposes.
• Sun-synchronous orbits cross the equator at the same time each solar day.
• Low inclination orbits are used to look more closely at tropical processes.
• Exact-repeat orbits fill in a grid of orbit tracks over X days, then repeat exactly.
A Global System of Geosynchronous Satellites
Geostationary Sampling: Easy to picture – a sequence of
images/fields from a fixed viewing geometry. Five satellites cover
the globe, maintained by nations that need the data. The first
“weather satellites” were essentially TV cameras in space. For the
first time, we could see distant storms developing and
approaching. The very first satellites carried film cameras and
were not looking at weather. How did the film get to earth?
Low Earth Orbits (“Polar Orbiting”): The orbital plane of the
satellite remains fairly constant while the earth rotates toward the east.
Subsurface tracks migrate to the west, ~ 25º longitude (2750 km).
What SeaWiFS (visible) sees in one day:
Swaths leave gaps at low latitudes:
Clouds cover >50% of the ocean and obscure
visible and IR radiation.
“Space Junk”
1958-2008
50 Years of Orbital Trash
“Who you gonna call?”
WALL-E
Space Debris
Space Debris
Space Debris
Space Debris
Space Debris
Space Debris
50
Specific Examples
Sea Surface Temperature (SST)
Perhaps the most „standard‟ measurement from satellites
Passive meaurement. Traditionally used infrared (IR) emission
- strong signal, obscured by clouds
More recently using Microwave
- can see through clouds, but the signal is weak
- microwave also provides other data such as wind speed,
water vapor, rain, ice
Temperature is important because of its relationship to the heat
budget (global warming) and because it‟s diagnostic of
currents, upwelling etc…
Components of a passive “SST” remote sensing system
Using IR or Microwave Wavelengths
IR or μ-wave
Emission
signal
raw data
processing /
dissemination
calibration/
validation
sensor