Báo cáo nghiên cứu khoa học: "REGIONAL-SCALE MODELING OZONE AIR QUALITY OVER THE CONTINENTAL SOUTH EAST ASIA" ppsx
Bạn đang xem bản rút gọn của tài liệu. Xem và tải ngay bản đầy đủ của tài liệu tại đây (881.5 KB, 10 trang )
TẠP CHÍ PHÁT TRIỂN KH&CN, TẬP 12, SỐ 02 - 2009
Bản quyền thuộc ĐHQG-HCM Trang 111
REGIONAL-SCALE MODELING OZONE AIR QUALITY OVER THE
CONTINENTAL SOUTH EAST ASIA
Le Hoang Nghiem
(1)
, Nguyen Thi Kim Oanh
(2)
(1) University of Techonology, VNU-HCM
(2)Asian Institute of Technology, Thailand
(Manuscript Received on November 13
th
, 2008, Manuscript Revised February27
th
, 2009)
ABSTRACT: Long range transport of ozone and its precursors can significantly impact
the air quality in downwind regions. The problem of regional transport of ozone has been
studied for more than three decades in Europe and U.S but not yet in Southeast Asia. This
study investigated the regional scale distribution of tropospheric ozone over the Continental
South East Asia Region (CSEA) of Thailand, Burma, Cambodia, Lao and Vietnam. The
Models-3 Community Multi-scale Air Quality (CMAQ) modeling system, driven by the
NCAR/Penn State Fifth-Generation Mesoscale Model (MM5), is used for the purpose. The
model domain covers the longitude range from 91
o
E to 111
o
E and the latitude range from 5
o
N
to 25
o
N. Two most recent ozone episodes of March 24-26, 2004 and January 2-4, 2005 were
selected which represent the typical meteorological conditions for high ozone concentrations
periods of a year. The episode analysis was made based on available data from 10 and 4
monitoring stations located in Bangkok of Thailand and Ho Chi Minh City (HCMC) of
Vietnam, respectively. The episodes were characterized with hourly ozone levels above the
National Ambient Air Quality Standards of Thailand and Vietnam of 100 ppb at a number of
the monitoring stations. The maximum ground level concentrations of ozone for March 2004
and January 2005 episodes reached 173 ppb and 157 ppb, respectively, in the urban plume of
the Bangkok Metropolitan Region (BMR). The simulations were performed with 0.5
o
× 0.5
o
emission input data which was prepared from the regional anthropogenic emission inventory
used in the Transport and Chemical Evolution over the Pacific (TRACE-P), and the biogenic
emissions obtained from the Global Emissions Inventory Activity (GEIA). The simulated
overall picture of ground level ozone concentrations over CSEA domain shows that the
concentrations were high at the downwind areas at a considerable distance from large urban
areas such as BMR and HCMC. During March 2004 episode the ozone plume moved
northeastward following the Southwesterly monsoon and the maximum width of the modeled
plume with the ozone above 100 ppb was about 70 km from BMR. For HCMC the ozone plume
moved northward and the concentration in the city plume was lower with the width of isopleth
of 50ppb of around 40 km.
During the Jan 2005 episode the ozone plume moved southwestward following the
Northeasterly monsoon and the width of the modeled plume with the ozone concentration
above 100 ppb in BMR was 50 km while for HCMC the width of the 40ppb isopleth was about
30 km. The model performance was evaluated on the available observed hourly ozone
concentrations. The model system was shown to be able to reproduce the peak ozone levels
that occurred during the episodes at these two large urban areas, and capture the day by day
variations during the selected episodes. The performance statistics MNBE, NGE, and UPA for
the simulated ozone concentrations are within U.S. EPA guidance criteria and are comparable
to those reported previous for other regional ozone simulations. It is shown that the
MM5/CMAQ system is the suitable modeling tools for ozone prediction over the CSEA.
Science & Technology Development, Vol 12, No.02 - 2009
Trang 112 Bản quyền thuộc ĐHQG-HCM
1. INTRODUCTION
Tropospheric ozone is a secondary pollutant mainly formed through a complex series of
photochemical reactions of methane (CH
4
), volatile organic compounds (VOC) and carbon
monoxide (CO) with nitrogen oxides (NO
x
) in the presence of sunlight. Ozone (O
3
) has
recently become a serious air pollution problem in many urban areas around the world.
Numerous studies indicate that exposure to an elevated concentration of tropospheric ozone is
a potential human health hazard (Lippmann, 1991; Weisel et al., 1995) and affects vegetation
adversely. Past observations and modeling studies have shown that O
3
produced in the
planetary boundary layer and its precursors are efficiently transported in the regional scale
between countries and from one continent to another continent (Jacob et al, 1999). Modeling
studies also suggest that the impact of long-range transport on local air quality will increase in
the future (Jacob et al, 1999). The problem of regional transport of ozone has been studied for
more than three decades in Europe and U.S but not yet in Southeast Asia.
Today many photochemical models are applied in different parts of the world for study on
urban and regional scale air quality. Sufficient good results have been obtained in the
modeling of tropospheric ozone. However, few models have been used in Southeast Asia. This
paper focuses on the application of a photochemical model system for simulating ozone
concentrations over the Continental South East Asia Region (CSEA) of Thailand, Burma,
Cambodia, Lao and Vietnam in order to understand the current state and the transport of
troposphere ozone in the tropical environment.
The primary objective of this paper is to evaluate performance of the MM5/CMAQ model
system for modeling ozone concentrations on a regional scale and investigate distribution of
tropospheric ozone over the Continental South East Asia Region (CSEA) through two
historical ozone episodes. In this paper the CMAQ modeling results are compared with
measured ozone concentrations from several monitoring stations in the study area CSEA.
Analyses are conducted from the perspectives of overall performance, diurnal patterns and
spatial distribution patterns.
2. DESCRIPTION OF MODEL AND INPUT DATA
2.1. The modeling system
The MM5/CMAQ modeling system was used in this study. The Model-3 Community
Multi-scale Air Quality (CMAQ) version 4.3 was used to simulate the distribution of
tropospheric ozone over the Continental South East Asia (CSEA). CMAQ is a Eulerian-type
model developed in the U.S. Environmental Protection Agency to address tropospheric ozone,
acid deposition, visibility, particulate matter and other pollutants issues in the context of "one
atmosphere" perpective where complex interactions between atmospheric pollutants and
regional and urban scales are confronted. The chemistry is described by the Carbon Bond
Mechanism IV (CBM-IV) which includes 94 chemical reactions (Gery et at., 1989). A general
description of CMAQ and its capabilities are given in Byun and Ching (1999). The Fifth-
Generation Pennsylvania State University/National Center for Atmospheric Research
(PSU/NCAR) Mesoscale Meteorological Model (MM5) version 3.6.2 was used to generate
meteorological fields for CMAQ.
2.2. CMAQ modeling domain
The CMAQ domain is defined by a 56 km (approximate 0.5
o
) resolution grid, based on a
Mercator projection, covers the continental region of South East Asia including Thailand,
TẠP CHÍ PHÁT TRIỂN KH&CN, TẬP 12, SỐ 02 - 2009
Bản quyền thuộc ĐHQG-HCM Trang 113
Laos, Cambodia, Vietnam, and Burma. The domain consists of a 40 × 40 horizontal grid cells
and extends from 91
o
E to 111
o
E and from 5
o
N to 25
o
N. The domain has 15 vertical layers in
the sigma coordinate system. Results from the surface layer (38 m) are used in this study.
Initial and boundary conditions for the Model-3/CMAQ air quality simulation are not
available, therefore, a three day spin-up simulation starting from clean air condition is
performed prior to the episode period over the modeling domain.
2.3. Meteorological input
In this study MM5 was run in four-dimensional data assimilation mode with 30 vertical
layers in the sigma coordinate system and an extended domain 2860 × 2860 km
2
. The height of
the first sigma layer was approximately 38 m above the ground. The meteorological fields for
MM5 were obtained from the Data Support Section at the National Center for Atmospheric
Research in U.S. MM5 model was run with 5 day back each episode period, 20 to 26 March
2004 and 22 to 29 January 2005. In fact, dozens of MM5 simulation were run for the selected
episode periods and complete analyses of each of these MM5 simulation results are not present
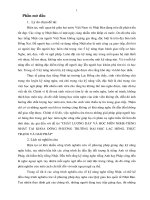
in this paper. The modeled wind field in Figure 2(a) and Figure 2(b) represent a typical wind
patterns of the Southwest monsoon during the 24-26 March 2004 episode and the Northeast
monsoon during the 2-4 January 2005 episode, respectively.
2.4. Emission data
The anthropogenic emissions of nitrogen oxides, carbon monoxide, volatile organic
compounds (VOCs) and SO
2
were obtained from the regional anthropogenic emission
inventory of 0.5
o
× 0.5
o
for Asia prepared by scientists at the Center for Global and Regional
Environmental Research (CGRER) at the University of Iowa used in the Transport and
Chemical Evolution over the Pacific (TRACE-P) (Streets et al., 2003). NO
x
and hydrocarbon
biogenic emissions of 1
o
× 1
o
monthly global inventory were obtained from the Global
Emissions Inventory Activity (GEIA) (www.geiacenter.org) for the month of Jan and March.
The biogenic emissions of 0.5
o
× 0.5
o
for the modeling domain were estimated by interpolation
based on the biogenic emissions of 1
o
× 1
o
.
2.5. Ozone data
In this study, hourly surface ozone data from 10 air quality monitoring stations (Figure 1)
located in BMR and 4 stations located in HCMC were collected from Pollution Control
Department (PCD) in Thailand and from Department of Natural Resources and Environment
(DONRE) of Ho Chi Minh City in Vietnam, respectively. Analyses presented in this paper
focus on the two main urban areas in CSEA domain, Bangkok Metropolitan Region (BMR)
and Ho Chi Minh City (HCMC). The CMAQ performance analyzes reported herein was
limited on three subregions of Western BMR (SBMR1), Eastern BMR (SBMR2), and HCMC.
For these subregions containing more than one monitoring station the maximum values
between 12:00 and 16:00 LST and average concentrations for the remaining hours computed
from all of the stations were used for evaluation of model performance.
Ozone concentrations exceeded the National Ambient Air Quality Standards of Thailand
of 100 ppb within the subregions of SBMR1 and SBMR2 for both the selected episodes and
within HCMC for January 2005 episode. The highest ozone concentration of 173 ppb was
observed at station 10T in SBMR1 on 25 March 2004 and of 156 ppb was observed at station
15T in SBMR2 on 4 January 2005.
Science & Technology Development, Vol 12, No.02 - 2009
Trang 114 Bản quyền thuộc ĐHQG-HCM
3. RESULT AND DISCUSSION
3.1. Model performance statistics
CMAQ Model performance measures for ozone were calculated by hour, and by
subregion, and were reported for subregions SBMR1, SBMR2, and HCMC. The performance
statistics compared modeled and observed ozone concentrations using U.S. Environment
Protection Agency (1991) guidance criteria and included the mean normalized bias error
(MNBE), the normalized gross error (NGE), and unpaired peak prediction accuracy (UPA).
Observation-modeling pairs are excluded from the computing the statistics if the observed
concentration is below a cutoff value of 40 ppb O
3
. Table 2 shows the performance evaluation
results of the present modeling on an hourly basis in terms of the statistical measures.
Performance statistics met those recommended by the USEPA (1991).
Table 1. List of ozone monitoring stations in CSEA domain
Symbol
a
Station Name Source Latitude
(decimal degree)
Longitude
(decimal degree)
10T Nationnal Housing
Authority
PCD
13.778 100.652
11T Huai Khwang PCD
13.759 100.565
12T None-tree Vitaya PCD
13.69 100.553
13T Dept. of Energy Affairs PCD
13.824 100.517
14T Thonburi Highway District PCD
13.598 100.355
15T Singharatpitayakom PCD
13.679 100.455
22T Nonthaburi PCD
13.910 100.500
27T Samutsakhon PCD
13.536 100.28
52T Thonburi
Substation,Intrapitak Road
PCD
13.741 100.482
53T Traffic Police Residence PCD
13.792 100.599
DO DOSTE station HCMC
DONRE
10.7805 106.687
HB Hong Bang Station HCMC
DONRE
10.7557 106.661
QT Quang Trung Station HCMC
DONRE
10.8519 106.628
ZO ZOO station HCMC
DONRE
10.7908 106.705
a
Same as Figure 1.
b
PCD, The Thailand Pollution Department, HCMC DONRE, The Ho Chi Minh City
Department of Natural Resource and Environment.
TẠP CHÍ PHÁT TRIỂN KH&CN, TẬP 12, SỐ 02 - 2009
Bản quyền thuộc ĐHQG-HCM Trang 115
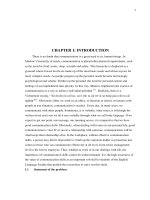
Figure 1. Model domain and location of air quality monitoring stations in CSEA domain (see also Table 1).
Science & Technology Development, Vol 12, No.02 - 2009
Trang 116 Bản quyền thuộc ĐHQG-HCM
(a)
(b)
Figure 2. Modeled surface wind fields at 6:00 UTC on (a) 24 March 2004 and (b) 3 January 2005.
Table 2. Performance statistics for 1hr O
3
concentrations
24-26 March episode 2-4 January episode
Statistics EPA
goal
SBMR1 SBMR2 HCMC SBMR1 SBMR2 HCMC
n (data points) 72 72 72 72 72 72
Measured peak
(ppb)
173 99 61 118 156 116
Modeled peak
(ppb)
165 102 64 117 159 114
MNBE (%) < ± 15 - 8.1 -1.7 - 4.8 - 5.3 - 8.6 - 3.7
NGE (%) < 35 9.7 19.6 13.3 18.9 23.3 25.8
UPA (%) < ± 20 - 11.6 - 13.8
3.2. Time series and scatter plots
Figure 3 shows the time series plots for both the modeled and measured hourly ozone
concentration at three subregions during the episodes. In general, the modeled results exhibited
a reasonable agreement with measurements and reproduce the diurnal ozone concentration
patterns very well at all subregions. The model captures the measured peaks at daytime. The
plots in Figure 3(a), 3(b) show that 12:00 to 16:00 LST is the period during which ozone
concentration usually exceeds 80 ppb in BMR, and peak ozone typically occurs at around
14:00 LST in the afternoon when sunlight and ambient temperature are highest in day. Figure
3(c) shows that 12:00 to 16:00 is the period during which ozone concentration usually exceeds
40 ppb in HCMC. Figure 4 further compares all 3-day hourly data from the three subregions
using scatter plots, in which the diagonal line is the identity line and the other solid line is the
linear regression line. Figure 4(a) and 4(b) indicate that data were clustered near the regression
or identity line with R
2
= 0.87 and R
2
= 0.85 for March 2004 episode and January 2005
episode, respectively.
TẠP CHÍ PHÁT TRIỂN KH&CN, TẬP 12, SỐ 02 - 2009
Bản quyền thuộc ĐHQG-HCM Trang 117
0
20
40
60
80
100
120
140
160
180
200
0 12243648 6072
Time
O
3
(ppbv)
Modeled Measured
(a)
0
20
40
60
80
100
120
140
0 122436486072
Time
O
3
(ppbv)
Modeled Measured
(a)
0
20
40
60
80
100
120
0 122436486072
Time
O
3
(ppbv )
Modeled Measured
(b)
0
20
40
60
80
100
120
140
160
180
0 122436486072
Time
O
3
(ppbv)
Modeled Measured
(b)
0
10
20
30
40
50
60
70
0 122436486072
Time
O
3
(ppbv)
Modeled Measured
(c)
0
20
40
60
80
100
120
140
0 122436486072
Time
O
3
(ppbv)
Modeled Measured
(c)
24 to 26 March 2004 episode 2 to 4 January 2005 episode
F
igure 3. Comparison of hourly variation in surface O
3
modeled concentrations with measurements at
(a) SBMR1, (b) SBMB2 and (c) HCMC
R
2
= 0.87
0
20
40
60
80
100
120
140
160
180
0 20 40 60 80 100 120 140 160 180
Measured (ppbv)
Modeled (ppbv)
(a)
R
2
= 0.85
0
20
40
60
80
100
120
140
160
0 20 40 60 80 100 120 140 160
M easured (ppbv)
Modeled (ppbv)
(b )
Figure 4. Scatter plots of measured ozone concentrations vs. modeled values at all three subregions
SBMR1, SBMR2, and HCMC for (a) 24-26 March 2004 episode and (b) 2-4 January 2005 episode.
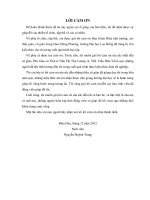
3.3. Spatial distributions of ozone over CSEA
The spatial distributions of O
3
concentrations at surface level (lowest layer) over CSEA
domain at 14:00 LST of episodic days are shown in Figure 5. The main cities of the domain
such as Bangkok Metropolitan region and Ho Chi Minh City, generally show high O
3
concentrations mainly due to primary anthropogenic emissions. Highest O
3
concentrations are
centered over Bangkok Metropolitan and its surrounding areas. The concentration patterns
show that there are a potential advection and transport of the ozone and its precursors from the
major urban centres (BMR and HCMC) to some downwind areas. In March 2004 episode
(Figure 5(a)), elevated ozone concentrations are found in the northeastern BMR and the north
of HCMC in association with Southwest monsoon (SW) and Southerly winds. During March
Science & Technology Development, Vol 12, No.02 - 2009
Trang 118 Bản quyền thuộc ĐHQG-HCM
2004 episode the ozone plume moved northeastward following the Southwesterly monsoon
and the maximum width of the modeled plume with the ozone above 100 ppb was about 70 km
from BMR. For HCMC the ozone plume moved northward and the concentration in the city
plume was lower with the width of isopleth of 40ppb of around 40 km. During the Jan 2005
episode the ozone plume moved southwestward following the Northeasterly monsoon (Figure
5(b)), elevated ozone concentrations are found in the southwestern BMR and the southwest of
HCMC. The width of the modeled plume with the ozone concentration above 100 ppb in BMR
was 50 km while for HCMC the width of the 50ppb isopleth was about 30 km. This implies
that long-range transport may cause elevated concentrations in remote area downwind of
polluted regions.
92 94 96 98 100 102 104 106 108 110
6
8
10
12
14
16
18
20
22
24
92 94 96 98 100 102 104 106 108 110
6
8
10
12
14
16
18
20
22
24
(a) 26 March, 2004 (b) 4 January, 2005
Figure 5. Modeled surface ozone distributions over CSEA domain at 7:00 UTC
4. CONCLUSION
The Models-3 CMAQ modeling system with meteorological fields provided by MM5 was
applied to investigate two O
3
episodes over the CSEA. Overall, the model performed
reasonably well in modeling O
3
concentrations over the modeling domain and the episodic
period. The model simulated very well the diurnal variation and daily peak O
3
concentrations.
Spatially, the model provides overall picture of ground level ozone concentrations over CSEA
domain which shows the concentrations were high at the downwind areas at a considerable
distance from large urban areas such as BMR and HCMC.
TẠP CHÍ PHÁT TRIỂN KH&CN, TẬP 12, SỐ 02 - 2009
Bản quyền thuộc ĐHQG-HCM Trang 119
MÔ HÌNH HÓA CHẤT LƯỢNG KHÔNG KHÍ NỒNG ĐỘ ÔZÔN MẶT ĐẤT
CHO KHU VỰC LỤC ĐỊA ĐÔNG NAM Á
Lê Hoàng Nghiêm
(1)
, Nguyễn Thị Kim Oanh
(2)
(1) Trường Đại học Bách khoa, ĐHQG-HCM
(2) Viện công nghệ Châu Á, Thái Lan
TÓM TẮT: Khuếch tán trên phạm vi rộng của ôzôn mặt đất và tiền chất của nó có thể
ảnh hưởng nghiêm trọng đến chất lượng không khí của các khu vực tiếp nhận dưới hướng gió.
Vấn đề vận chuyển chất ô nhiễm ôzôn xuyên vùng đã được nghiên cứu cách đây hơn 3 thập kỷ
ở Châu Âu và Hoa Kỳ nhưng chưa được nghiên cứu ở khu vực Đông Nam Á. Bài báo này trình
bày kết quả nghiên cứu áp dụng công cụ mô hình xác
định sự phân bố ôzôn cho khu vực lục
địa Đông Nam Á (CSEA) bao gồm Thái Lan, Miến Điện, Campuchia, Lào và Việt Nam. Hệ
thống mô hình chất lượng không khí CMAQ – MM5 được sử dụng trong nghiên cứu này. Khu
vực mô hình hóatrải dài từ kinh độ 91
o
Đông đến 111
o
Đông và từ vĩ độ 5
o
Bắc đến 25
o
Bắc.
Hai kịch bản ô nhiễm ô zôn nồng độ cao từ 24 đến 26 tháng 3 năm 2004 và từ 2 đến 5 tháng 1
năm 2005 xảy ra trong điều kiện khí tượng điển hình của khu vực Đông Nam Á được lựa chọn
để mô hình hóa. Các kịch bản này được phân tích và lựa chọn trên cơ sở số liệu quan trắc
chất lượng không khí từ 10 trạm ở Băng Cốc, Thái Lan và 4 trạm ở thành phố Hồ Chí Minh,
Việt Nam. Các k
ịch bản lựa chọn trong nghiên cứu nghiên cứu này có nồng độ ô zôn trung
bình giờ ở các trạm quan trắc vượt quá giá trị cho phép 100 ppb của tiêu chuẩn chất lượng
không khí xung quanh của Thái Lan và Việt Nam. Nồng độ ôzôn mặt đất lớn nhất cho kịch bản
tháng 3 năm 2004 là 173 ppb và cho kịch bản tháng 1 năm 2005 là 157 ppb. Hệ thống mô hình
được thực hiện với dữ liệu phát thải 0.5
o
× 0.5
o
thu thập từTrung Tâm Nghiên Cứu Môi
Trường Vùng và Toàn Cầu (CGRER) của Đại Học Iowa. Kết quả mô hình minh họa trong bản
đồ ô nhiễm ôzôn mặt đất cho thấy nồng độ ôzôn cao tại các khu vực dưới hướng gió của các
thành phố lớn như Băng Cốc và thành phố Hồ Chí Minh. Trong kịch bản tháng 3 năm 2004
vệt khói khuếch tán ôzôn di chuyển theo hướng Đông Bắc do ảnh hưởng của gió mùa Tây Nam
và chiều rộng của vệt khói với n
ồng độ ôzôn lớn hơn 100 ppb là 70 km cho khu vực Băng Cốc.
Đối với thành phố Hồ Chí Minh vệt khói khuếch tán ôzôn di chuyển theo hướng Bắc và chiều
rộng của vệt khói với nồng độ ôzôn lớn hơn 50 ppb là 40 km.
Trong kịch bản tháng 1 năm 2005 vệt khói khuếch tán ôzôn di chuyển theo hướng Tây
Nam do ảnh hưởng của gió mùa Đông Bắc và chiều rộng của vệt khói với nồng độ ôzôn lớn
hơn 100 ppb là 50 km cho khu vực Băng Cốc, trong khi đó đối với thành phố Hồ Chí Minh vệt
khói khuếch tán với nồng độ ôzôn lớn hơn 50 ppb có chiều rộng là 30 km.
Kết quả mô phỏng của mô hình được so sánh, đánh giá với các số liệu ôzôn đo
đạc được
tại các trạm quan trắc. đánh giá này cho thấy hệ thống mô hình có thể mô phỏng các nồng độ
ô zôn cực đại xảy ra trong các kịch bản trên cũng như mô phỏng được tiến trình dao động
nồng độ ôzôn trong những ngày của kịch bản lựa chọn. Các chỉ số thống kê đánh giá kết quả
mô hình như MNBE, NGE, và UPA nằm trong giới hạn cho phép theo hướng dẫn của USEPA
và phù hợp với các nghiên cứu khác cho các khu v
ực khác nhau trên thế giới. Điều này chứng
tỏ rằng hệ thống mô hình MM5-CMAQ là công cụ thích hợp cho việc mô hình hóa ôzôn mặt
đất cho khu vực Đông Nam Á.
Key words: ozone, CMAQ – MM5, Bangkok, HCMC,
SOUTH EAST ASIA
Science & Technology Development, Vol 12, No.02 - 2009
Trang 120 Bản quyền thuộc ĐHQG-HCM
REFERENCES
[1]. Byun, D.W., Ching, J.K.S. (Eds.), Science algorithms of the EPA models-3
community multi-scale air quality (CMAQ) modeling system. NERL, Research
Triangle Park, NC. (1999).
[2]. Gery, M.W., Whitten, G.Z., Killus, J.P., Dodge, M.C. A photochemical kinetics
mechanism for urban and regional scale computer modeling. Journal of Geophysical
Research Atmospheres 94: 12925–12956. (1989).
[3]. Jacob, D.J., Logan, J.A., and Murti, P.P.Effect of rising Asian emission on surface
ozone in the United States. Geophysical Research Letters 26, 2175–2178. (1999).
[4]. Lippmann, M. Health effects of tropospheric ozone. Environmental Science and
Technology 25 (12), 1954-1966. (1991).
[5]. Streets, D.G., Bond, T.C., Carmichael, G.R., Fermandes, S., Fu, Q., He, D., Klimont,
Z., Nelson, S.M., Tsai, N.Y., Wang, M.Q., Woo, J.H. and Yarber, K.F., 2003. A
inventory of gaseous and primary aerosol emissions in Asia in the year 2000, Journal
of Geophysical Research 108 (D21), p. 8809 doi:10.1029/2002JD003093.
[6]. USEPA. Guideline for the regulatory application of The Urban Airshed Model.
USEPA EPA-450/4-19-013, Ofiice of Air Quality Planning and Standards, Research
Triangle Park, NC 2771, (1991).
[7]. Weisel, C. P., Cody, R. P., and Lioy, P. J.Relationship between summertime ambient
ozone levels and emergency department visits for asthma in central New Jersey.
Environmental Health Perspectives, 103(2), 97-102 (1995).