SUSE Linux 10 for dummies phần 8 pot
Bạn đang xem bản rút gọn của tài liệu. Xem và tải ngay bản đầy đủ của tài liệu tại đây (2.36 MB, 48 trang )
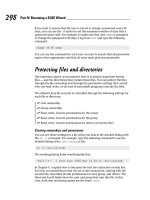
3. Navigate to the directory where you saved the template file, select the
template file, and click Open.
The Open dialog box closes; the template now appears in the My
Templates folder in the Template Management dialog box.
4. Click Close to close the Template Management dialog box.
To create a new document from a template you’ve installed, follow these steps:
1. Choose File➪New➪Templates and Documents.
A dialog box appears.
2. Click Templates on the left pane and then double-click the Default
folder on the right pane.
You should see the templates that you have installed.
3. Select the template you want to use and click Open.
A new document appears, typically with some text illustrating the
selected template’s styles.
4. Erase the text in the new document and start typing what you want.
To view the styles in that template, open the Stylist window by pressing
F11 and apply styles by double-clicking them in the Stylist.
Writer also enables you to perform many other tasks related to styles and
templates. For example, you can create a style, apply a style to text, copy
styles from one template to another, and so on.
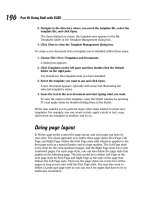
Doing page layout
In Writer, page styles control the page layout, and each page can have its
own style. The usual approach is to define three page styles: First Page, Left
Page, and Right Page. Define the First Page style with whatever applies to the
first page such as a special header and no page number. The Left Page style
is the style for the even-numbered pages, and the Right Page style is for odd-
numbered pages. For each page style, you can also define the page style that
applies to the following page. The idea would be to define Left Page as the
next page style for First Page and Right Page as the style of the page that
follows the Left Page style. That way, the page styles are correct for all the
pages as long as you start with the First Page style. You may also want to
define a Landscape page style so you can use it for pages that have to be in
landscape orientation.
196
Part III: Doing Stuff with SUSE
18_754935 ch12.qxp 11/7/05 9:58 PM Page 196
If you are familiar with Microsoft Word, you know that the page setup —
paper size, orientation, margins, and so on — applies to all pages in the docu-
ment. In Writer, a page style does not automatically apply to the entire docu-
ment. Instead, each page has its own page style. Of course, you can choose to
apply the same page style to all the pages. Essentially, you have more fine-
grained control over page layouts in Writer.
A typical page layout task is to insert objects created in other OpenOffice.org
applications, such as a Calc spreadsheet, an Impress slide, or a Draw draw-
ing. You can insert such objects by choosing Insert➪Object➪OLE Object.
Incidentally, OLE stands for Object Linking and Embedding, which is just a
fancy term for the ability to create a document by adding objects like charts
and drawings that are created in different applications.
When you add objects to a document, keep this caveat in mind: You can edit
an object directly in the document only by using the application that origi-
nally created the object.
One object that you can insert into a Writer document is a mathematical for-
mula, and I mean serious formulas with integral signs and Greek letters like
alpha and sigma. If you’re writing a scientific paper with complex equations,
you’ll really appreciate this feature of OpenOffice.org. Here’s a typical
sequence of steps to insert a formula into a Writer document (this process is
similar for inserting other objects):
1. Position the cursor and choose Insert➪Object➪Formula.
The user interface changes to that of OpenOffice.org Math — an applica-
tion for writing mathematical formulas — and a small frame for the for-
mula appears in the document. The formula is typeset in that frame.
2. Select a formula type from the top two rows of the Selection window.
The lower rows in the Selection window show available formulas of that
type. For example, the summation category (denoted by an uppercase
Greek letter sigma) includes integral signs.
3. Click a specific formula, such as an integral.
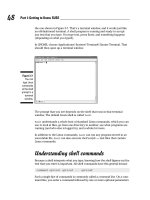
The Math command for this formula appears in the Commands window,
and parts of the formula appear in the document.
4. Fill in the arguments for the formula.
As you construct the formula with commands in the Commands window,
the formatted formula appears in the document (Figure 12-6).
197
Chapter 12: Preparing Documents and Spreadsheets in SUSE Linux
18_754935 ch12.qxp 11/7/05 9:58 PM Page 197
5. To change the font size of the formula, choose Format➪Font Size and
specify the font size.
6. Click anywhere else in the Writer document to return to the Writer
user interface.
7. Double-click the formula to edit it again.
Of course, Writer has many page layout features. You can use tables, num-
bered and bulleted lists, and columns. Writer also supports frames — rectan-
gular boxes in which you can place text, graphics, and even other frames.
Using frames, you can place just about anything anywhere on the document.
Creating and inserting graphics
Writer includes a drawing toolbar with tools that you can use to draw in the
document. You can also insert into your document both line drawings and
images from files in many different formats.
To create simple diagrams in your document, click the Show Draw Functions
icon (on the function bar along the top edge of the Writer window) and hold
down the mouse button for a moment. The Drawing toolbar appears along
the bottom of the window, as shown in Figure 12-7. You can toggle this
Drawing toolbar on or off by choosing View➪Toolbars➪Drawing.
Figure 12-6:
Insert a
math
formula into
a Writer
document
by using
the Math
application.
198
Part III: Doing Stuff with SUSE
18_754935 ch12.qxp 11/7/05 9:58 PM Page 198
Click in the document where you want to add a diagram. Select a tool from
the Drawing toolbar (Figure 12-7) and start drawing. To change the drawing
tool, select another tool.
To keep the Drawing toolbar visible while you create a diagram, open the
toolbar as usual, drag the toolbar’s left part, and tear it away. The toolbar
then turns into a tearoff menu (a small window that floats in the document
window) from which you can easily select and use different drawing tools.
Writer also comes with a gallery of predefined graphics. To view the Gallery
(shown in Figure 12-8), choose Tools➪Gallery or click the Gallery icon (the
rightmost icon on the Function bar). Select from the themes along the left
side of the gallery. If you see a graphic you’d like to use, drag and drop it from
the gallery to the location on the document where you want to insert it. Click
the Gallery icon again to hide the graphics gallery.
Figure 12-8:
Drag and
drop
graphics
from the
gallery
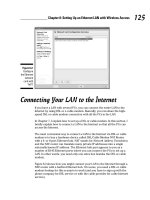
onto your
document.
Figure 12-7:
The Draw
Functions
toolbar.
199
Chapter 12: Preparing Documents and Spreadsheets in SUSE Linux
18_754935 ch12.qxp 11/7/05 9:58 PM Page 199
Using fields
Think of fields as bits of information that might change, but you want to call
them by a name and use them in your document. For example, you might want
to insert the current date and the page numbers into the header of a document.
You can do so by inserting fields that refer to the date and page numbers. Some
of the predefined fields (such as date and page numbers) are easy to use. Simply
choose Insert➪Fields and then select the field you want to insert.
In addition to the fields you see in the Insert menu, you can pick from many
more fields. Choose Insert➪Fields➪Other to open the Fields dialog box
(Figure 12-9) where you can browse and pick other fields to use in your docu-
ment. From the Fields dialog box, you can also change the format for a field.
For example, you can select how the date field is shown in the document.
Another type of useful field is a reference or a bookmark. The idea is to mark a
location in the document by a name and then refer to that location elsewhere
by that assigned name. For example, you can insert a cross-reference to the
page where that location occurs.
Working with large documents
What’s a large document? Well, I consider a large document any document over
a hundred pages or so. Anything that might have a couple of chapters and need
a table of contents and an index definitely qualifies as a large document — for
example, a book. Writer includes features to do the “usual things” you’d want to
do when working with these larger, more cumbersome documents, such as cre-
ating tables of content, inserting indexes, and adding entries to indexes.
Figure 12-9:
Use the
Fields dialog
box to pick
other fields
or select
formats.
200
Part III: Doing Stuff with SUSE
18_754935 ch12.qxp 11/7/05 9:58 PM Page 200
Writer also enables you to tie together several Writer files into a single large
document — what Writer refers to as a master document. Master documents
are ideal for books, for example. You can keep the chapters in separate files
and then organize these files into a book by using the master document fea-
ture. For a large project involving a master document, you have to plan a
little and take care of the following key steps:
1. Create a template with the styles you need as well as any fields you
plan to use.
For more about styles and templates, see the appropriately named sec-
tion “Using styles and templates,” earlier in this chapter.
2. Create the individual files and the master document by using the
same template.
3. Insert the files into the master document — that’s how you combine
all the individual parts into the final product.
4. Add a table of contents and index and a bibliography, if needed.
5. Work on the component files.
6. Update the table of contents and index.
Preparing Spreadsheets with
OpenOffice.org Calc
Does the name VisiCalc mean anything to you? What about Lotus 1-2-3? I’m
sure you have heard of Lotus 1-2-3, but maybe not VisiCalc — the first spread-
sheet program that turned the IBM PC into a business tool. (Believe it or not,
you can download and run VisiCalc even on today’s PCs. Curious? For more
information, visit Dan Bricklin’s Web site at www.bricklin.com/history/
vcexecutable.htm.)
Spreadsheet programs continue to be a staple of the office suite, and the
OpenOffice.org suite is no exception. OpenOffice.org Calc, or just Calc for
short, is the spreadsheet program in the OpenOffice.org suite.
All the spreadsheet programs that came after VisiCalc — from Lotus 1-2-3 to
Microsoft Excel and Calc — still follow that visual model of a spreadsheet laid
out in rows and columns. Of course, the newer spreadsheets (such as Excel
and Calc) have many more bells and whistles, including fancy GUIs.
If you have used any other spreadsheet program, such as Microsoft Excel,
you’ll be right at home when you start using Calc. Therefore, I don’t try to
give you detailed instructions on how to use Calc; instead, I provide a quick
overview and some tips on how to perform some common tasks in Calc.
201
Chapter 12: Preparing Documents and Spreadsheets in SUSE Linux
18_754935 ch12.qxp 11/7/05 9:58 PM Page 201
Taking stock of OpenOffice.org Calc
Before describing the types of tasks you can perform in Calc, I want to highlight
the key features of Calc. Calc can do all the basic spreadsheet functions you
expect in a spreadsheet program. Here are some things you can do with Calc:
ߜ Open and edit Microsoft Excel files or convert Microsoft Excel files into Calc
format. Calc uses an XML format and saves files with the .SXC extension.
ߜ Save documents in many different formats including Microsoft Excel
97/2000/XP, Excel 95, Excel 5.0, dBASE, StarCalc 5.0 (as well as 4.0 and
3.0), SYLK (an old Microsoft format), comma-separated values (CSV),
and Web page (HTML).
ߜ Use charting tools to visualize data in 2D or 3D plots.
ߜ Insert graphics files of many different formats, including JPEG, GIF, ZSoft
Paintbrush (PCX), TIFF, Windows BMP, Macintosh PICT, Encapsulated
PostScript (EPS), Adobe Photoshop (PSD), AutoCAD DXF, and many more.
ߜ Save versions of a spreadsheet as you continue to change it, allowing
you to revert to an older version if necessary.
ߜ Use styles and templates to format your spreadsheet.
ߜ Define cells to dynamically change format depending on the value in
the cell.
ߜ Easily exchange — import and export — data with existing databases by
using the DataPilot.
ߜ Set up cells to accept values from a set of specific values or ranges of
valid values.
ߜ Lock cells so data cannot be changed inadvertently.
ߜ Perform scenario analysis by storing multiple values in the same block
of cells — and define scenarios so you can select a set of values for a
specific scenario.
ߜ Use the Goal Seek feature to determine the value of a cell that would give
you a result you want from a formula.
Getting started with Calc
The best way to learn to use Calc is to simply start using it. To start Calc,
choose Main Menu➪Office➪Spreadsheet in KDE (in GNOME, choose Main
Menu➪Office➪Spreadsheet➪OpenOffice.org Calc). The Calc window opens
with a blank spreadsheet. You can then begin typing text and numbers into
the cells and use formulas to calculate whatever you want.
To familiarize yourself with Calc, take a moment to examine the tools and
icons packed into Calc’s main window (shown in Figure 12-10).
202
Part III: Doing Stuff with SUSE
18_754935 ch12.qxp 11/7/05 9:58 PM Page 202
Notice the following major parts in the main Calc window (refer to Figure 12-10):
ߜ Menu bar: Provides the standard pull-down menus: File, Edit, Help, and
so forth. Use these menus to perform all the tasks that Calc can do.
ߜ Function bar: Shows the full pathname or the URL of the currently open
file and also provides buttons for performing routine tasks: opening,
saving, and printing a document. You can also click icons on the func-
tion bar to open the Stylist (a list of cell and page styles), the Navigator
(a list of spreadsheet items such as sheets and graphics), and the
Gallery (a collection of predefined graphic objects such as 3D shapes,
backgrounds, and bullets).
ߜ Object bar: Enables you to format the document by applying styles,
selecting fonts, or changing text attributes (such as boldface, italics, and
underlining). This bar changes depending on the type of object (such as
plain text or graphics) you’ve clicked.
Status
bar
Tabs Function
Wizard
Object bar
Formula bar
Function bar
Menu bar
Figure 12-10:
You can
control Calc
through its
tool and
icon bars.
203
Chapter 12: Preparing Documents and Spreadsheets in SUSE Linux
18_754935 ch12.qxp 11/7/05 9:58 PM Page 203
ߜ Formula bar: Provides a field where you can enter formulas, create
sums, and launch the Function Wizard.
ߜ Toolbar: Located along the left side of the window, it provides buttons
that you can use to perform common tasks, such as inserting graphics,
sorting cells, checking spelling, and grouping cells.
ߜ Tabs: Located along the bottom of the spreadsheet, they enable you to
work with different sheets in the same file.
ߜ Status bar: Displays information about the current sheet (the current
sheet number, the page style, and so on). You can also click various ele-
ments in the status bar to change settings, such as the text selection
mode and the zoom factor for viewing the spreadsheet.
In addition to these tool and icon bars, the largest part of the Calc window is
the work area where your spreadsheet appears and where you focus most of
your attention.
Use the tooltips to find out what an icon or menu option does. Mouse over a
toolbar icon or a menu item, and Calc displays a small tooltip window with a
brief help message.
Note: Curious about that Function Wizard icon that’s pointed out in Figure
12-10? Check out the section “Calculating and charting data,” later in this
chapter, where I show you how to use that handy little feature.
You can configure Calc through the Tools➪Options dialog box. On the left
side of the dialog box, click the plus sign (+) next to Spreadsheet. The plus
sign turns to a minus sign (-), and a number of different categories of options
appear (as shown in Figure 12-11). You can then click each category to config-
ure various aspects of Calc.
Figure 12-11:
Set up Calc
from the
Spread-
sheet
category
in the
Tools
➪
Options
dialog box.
204
Part III: Doing Stuff with SUSE
18_754935 ch12.qxp 11/7/05 9:58 PM Page 204
Preparing spreadsheets with Calc is a straightforward affair. Typically, you
can enter text and numbers into the cells, resize the columns by dragging the
vertical lines, and enter formulas to calculate the answers you need. To help
you perform some common tasks in Calc, I provide some quick tips for two
broad categories of tasks:
ߜ Entering and formatting data
ߜ Calculating and charting data
Entering and formatting data
When entering and formatting data, use Calc in the same way you use Microsoft
Excel. You can type entries in cells, use formulas, and format the cells (such as
specifying the type of value and the number of digits after the decimal point).
The Format menu contains many of the options for formatting the spreadsheet.
After you’re done entering data into a spreadsheet, save it by choosing File➪
Save As. A dialog box appears, from which you can specify the file format, the
directory location, and the name of the file. You’ve seen similar Save As dialog
boxes a thousand times before. OpenOffice.org Calc can save the file in a
number of formats, including Microsoft Excel 97/2000/XP, Microsoft Excel 95,
Microsoft Excel 5.0, and text file with comma-separated values (CSV).
If you want to exchange files with Microsoft Excel, save the spreadsheet in
Microsoft Excel format (choose an appropriate version of Excel). Then you
can transfer that file to a Windows system and open it in Microsoft Excel.
After you’ve saved the spreadsheet once, you can also save intermediate ver-
sions of a spreadsheet. To save a new version, choose File➪Versions and
then click Save New Version in the next dialog box.
To share a spreadsheet with people who don’t use Calc or Excel, you can
print the spreadsheet to a PDF file and then send that to others because
anyone can easily view and print PDF files by using the free Adobe Reader
(see www.adobe.com/products/acrobat/readstep2.html).
Calculating and charting data
To perform calculations, use formulas you normally use in Microsoft Excel.
For example, use the formula SUM(D2:D6) to add up the entries from cell D2
to D6. To set cell D2 as the product of the entries A2 and C2, type =A2*C2 in
cell D2.
205
Chapter 12: Preparing Documents and Spreadsheets in SUSE Linux
18_754935 ch12.qxp 11/7/05 9:58 PM Page 205
To learn more about the functions available in OpenOffice.org Calc, choose
Help➪OpenOffice.org Help. This opens the OpenOffice.org Help window, from
which you can browse the functions by category and click a function to read
more about it.
One interesting feature of Calc is the support for scenarios. A scenario is
simply a collection of values for one or more cells. Scenarios are useful when
you compare the effect of some cells on other calculations in the spreadsheet.
For example, the monthly payment on a loan would depend on the principal,
the interest rate, and the duration of the loan. You can use Calc’s scenario fea-
ture to compare the monthly payments for a number of different scenarios
where each scenario has a certain combination of interest rate and loan dura-
tion in months. To use scenario for this comparison, follow these steps:
1. Set up the spreadsheet cells with labels and values for the principal,
annual interest rate in percentage, and loan duration in months (refer
to Figure 12-12). Calculate the monthly payment using this formula:
-PMT(MONTHLY_RATE;MONTHS;PRINCIPAL)
Figure 12-12 illustrates this example. The cells in the range B5:C7 specify
the principal, annual rate, and the number of months. Cell C6, with the
annual interest rate, is formatted to show a percentage. Cell C11 com-
putes the payment using the formula that you see in the formula bar.
Notice that the annual rate in cell C6 has to be divided by 12 to get the
monthly rate.
2. Select the cells that you want to include in the scenario and choose
Tools➪Scenarios. For example, in Figure 12-12, select the cells in the
range B5:C7.
The Create Scenario dialog box appears.
3. Fill in the scenario name, and then click OK.
For example, the scenario shown in Figure 12-12 is named
Rate_6_5_PCT (that’s my name for the 6.5% rate scenario).
4. Enter values into the cells — principal, interest rate, and months to
repay loan.
The scenario name appears in a drop-down list above the cells that con-
stitute the scenario (as shown in Figure 12-12). The cell values define
what that scenario means.
206
Part III: Doing Stuff with SUSE
18_754935 ch12.qxp 11/7/05 9:58 PM Page 206
5. Repeat Steps 2, 3, and 4 for other scenarios where each scenario has a
combination of principal amount, rate, and loan duration in months.
6. Select a scenario from the drop-down list (refer to Figure 12-12) to see
the monthly payment for that scenario.
To figure out where a particular cell is being used in some calculation, click
the cell and then choose Tools➪Detective➪Trace Dependents. Calc draws
arrows to show where that cell is being used.
If you cannot remember a function, use the Function Wizard to build the for-
mula in a cell. To use the Function Wizard, follow these steps:
1. Click the Function Wizard icon (refer to Figure 12-10) on the
Formula bar.
The Function Wizard dialog box appears.
2. Scroll down the list of functions and double-click the function you want.
Doing so causes the formula and its arguments to appear (see Figure
12-13), waiting for you to specify the values to be used as arguments.
Figure 12-12:
Use
scenarios
to compare
the effect
of different
sets of
values on a
calculation.
207
Chapter 12: Preparing Documents and Spreadsheets in SUSE Linux
18_754935 ch12.qxp 11/7/05 9:58 PM Page 207
3. Click each argument and identify the cell that should be used as that
argument.
When you specify all the arguments, the Result field (shown in Figure
12-13) shows the result of that formula.
4. Click OK.
The formula appears in the spreadsheet cell.
Figure 12-13:
Build
formulas
interactively
by using the
Function
Wizard.
208
Part III: Doing Stuff with SUSE
18_754935 ch12.qxp 11/7/05 9:58 PM Page 208
Chapter 13
Doing Even More Office Stuff
in SUSE Linux
In This Chapter
ᮣ Keeping track of appointments and tasks
ᮣ Making calculations
ᮣ Preparing presentations in OpenOffice.org Impress
B
esides word processing and spreadsheets that I cover in Chapter 12,
what else do you do in an office? Hmmm . . . let me see. How about keep-
ing track of appointments and tasks? Calculating how much profit you made?
And making sales pitches or some sort of presentation? In this chapter, I cover
SUSE Linux applications for some of these other office tasks. The chapter
begins with a quick summary of the calendar applications in KDE and GNOME.
Then I describe OpenOffice.org Impress — a Microsoft PowerPoint–like pre-
sentation software package.
Keeping Track of Appointments
and Tasks
If you installed KDE as your desktop, you can use Kontact — a new KDE appli-
cation that integrates existing KDE applications such as the KMail mail reader
and the KOrganizer calendar program into a single graphical personal infor-
mation manager. To start Kontact, click the Personal Information Manager
icon on the KDE panel (see Figure 13-1) or choose Main Menu➪Office➪
Personal Information Manager (Kontact).
19_754935 ch13.qxp 11/7/05 9:56 PM Page 209
When Kontact starts, it usually displays the Summary view. You can, how-
ever, switch to other views by clicking the icons on the left pane of the
Kontact window (refer to Figure 13-2). For example, Figure 13-2 shows
Kontact after you click the Calendar icon. In this case, Kontact displays the
output of KOrganizer — the KDE calendar program. The KOrganizer program
displays a calendar view where you can click a date to set or view that day’s
schedule. Figure 13-2 shows a typical calendar.
You can go to a different month or year by clicking the arrows next to the
month and the year. To add a to-do item for a specific date, select the date
from the calendar, click the To-do Items text box, and type the description of
the task.
To add appointments for a specific time, double-click the time and type a
brief description of the appointment in the dialog box that appears. Click OK
when you’re done. After you finish adding events and appointments, choose
File➪Save to save the calendar.
If you installed the GNOME desktop, you can use Evolution to keep track of
your calendar and tasks. Start Evolution by clicking its icon on the GNOME
Figure 13-2:
On the KDE
desktop, use
Kontact
to store your
appoint-
ments and
view your
calendar.
Click this icon to start KDE Kontact
Figure 13-1:
Start KDE
Kontact by
clicking the
icon on the
KDE panel.
210
Part III: Doing Stuff with SUSE
19_754935 ch13.qxp 11/7/05 9:56 PM Page 210
desktop’s top panel (or choose Main Menu➪Office➪Evolution). After the
Evolution window appears, click Calendars on the left pane to use the calen-
dar. Evolution’s calendar is intuitive to use. Simply select a date and double-
click a time to open the Appointment dialog box where you can type in the
details of the appointment.
Making Calculations
You have a choice of the KDE calculator or the GNOME calculator, depending
on which desktop you installed. Both are scientific calculators, and you can
do the typical scientific calculations, such as square root and inverse, as well
as trigonometric functions, such as sine, cosine, and tangent.
To use the calculator on a KDE desktop, choose Main Menu➪Utilities➪
Calculator➪KCalc. Figure 13-3 shows the KDE calculator in SUSE Linux.
You can display additional buttons by selecting options from the Settings
menu. For example, choose Settings➪Trigonometric Buttons to show buttons
that enable you to perform trigonometric calculations with the calculator.
If you installed the GNOME desktop, choose Main Menu➪Utilities➪
Calculator➪Calculator to get a calculator.
Making Presentations with
OpenOffice.org Impress
It seems the business world, or should I say the whole world, is full of
PowerPoint rangers — those dedicated souls who live by their PowerPoint
briefing packages (slide presentations). It’s hard to imagine a meeting or a
Figure 13-3:
Do your
calculations
in the KDE
calculator.
211
Chapter 13: Doing Even More Office Stuff in SUSE Linux
19_754935 ch13.qxp 11/7/05 9:56 PM Page 211
conference where someone isn’t vigorously making points on-screen with
PowerPoint. Face it: Slide presentations are here to stay. Making presenta-
tions is a fact of life; businesspeople have come to expect office-application
suites to include some sort of presentation software.
Like Microsoft Office, the OpenOffice.org office application suite comes with
its own PowerPoint-like presentation software — OpenOffice.org Impress (or
Impress for short). If you have used Microsoft PowerPoint and you’re already
familiar with its nuts and bolts — the concept of a slide, how to add text and
graphics to a slide, how to organize the slides, and how to run a slide show —
then you’ll find it easy to get started with Impress. Because some details of
how you perform basic Impress tasks may differ from the way they’re done in
PowerPoint, I provide some quick tips to point you in the right direction. I
start with an overview of Impress and then cover some categories of
common tasks that you’ll likely perform in Impress.
Taking stock of OpenOffice.org Impress
You’ll find that Impress can do all the usual things that presentation soft-
ware such as Microsoft PowerPoint can do. For example, you can create
professional-looking slide shows in Impress, using capabilities like these:
ߜ Open and edit Microsoft PowerPoint files or convert Microsoft PowerPoint
files to Impress format. One advantage of converting to Impress format
is that Impress files are smaller in size than corresponding Microsoft
PowerPoint files. Presentation files stored in Impress format are assigned
filenames with the .sxi extension.
ߜ Save documents in many different formats, including Microsoft PowerPoint
97/2000/XP, StarDraw 5.0 and 3.0, and StarImpress 5.0 and 4.0.
ߜ Insert graphics and clip art from files of many different formats, includ-
ing JPEG, GIF, ZSoft Paintbrush (PCX), TIFF, Windows BMP, Macintosh
PICT, Encapsulated PostScript (EPS), Adobe Photoshop (PSD), AutoCAD
DXF, and many more.
ߜ Insert other OpenOffice.org documents (from programs such as Writer,
Calc, and Draw) into a presentation.
ߜ Use Presentation Wizard to quickly create a presentation.
212
Part III: Doing Stuff with SUSE
19_754935 ch13.qxp 11/7/05 9:56 PM Page 212
ߜ Use all the drawing tools from OpenOffice.org Draw to add drawings to
the slides.
ߜ Export a presentation to a Web Page (HTML) with or without frames. You
can also export the slides in any of the supported graphics file formats.
ߜ Use layers to separate parts of the slide so that each part can be edited
or viewed separately.
ߜ Use special effects such as animated text and graphics, sound, and slide
transition effects.
ߜ Use FontWork (Format➪FontWork) to create various text effects such as
aligning text along a curve.
ߜ Render text in 3D.
ߜ Save versions of a presentation as you continue to change it and revert
back to an older version, if necessary.
ߜ Add speaker’s notes to each slide and create handouts.
Getting started with Impress
The best way to get comfortable using Impress is simply to start using it. To
start Impress, choose Main Menu➪Office➪Presentation➪OpenOffice.org
Impress in KDE or GNOME.
The Presentation Wizard dialog box appears and guides you through the
steps of starting a new presentation. From the Presentation Wizard dialog
box, you can create an empty presentation, create a presentation from a tem-
plate, or open an existing presentation. If you select an empty presentation
and click Next, the Presentation Wizard asks you to select the slide design.
Then you can click Create to open the Impress window, where you can select
the layout of your first slide. After you finish laying out a slide, you can pro-
ceed to insert new slides. For each slide, you can select the layout you want.
You can open and edit Microsoft PowerPoint files in Impress. To open an
existing file, choose File➪Open and then select the file to open.
Before you start creating slides with Impress, take a moment to examine the
Impress window (shown in Figure 13-4).
213
Chapter 13: Doing Even More Office Stuff in SUSE Linux
19_754935 ch13.qxp 11/7/05 9:56 PM Page 213
In Figure 13-4, note the major parts of the Impress window:
ߜ Menu bar: Provides the standard pull-down menus such as File, Edit,
and Help for performing all the tasks that Impress can do.
ߜ Function bar: Shows the full pathname or the URL of the currently open
file and also provides buttons for performing tasks such as opening,
saving, and printing a document. You can also click icons on the func-
tion bar to open the Stylist, the Navigator, and the Gallery.
ߜ Object bar: Enables you to format the document by applying styles,
selecting fonts, or changing text attributes such as bold, italic, and
underline. This bar changes according to the type of object you’ve
clicked (for example, plain text or graphic image).
ߜ Drawing toolbar: Located along the bottom of the window, it provides
buttons that you can use to perform drawing tasks, such as inserting
graphics, drawing lines and curves, and inserting text.
Current slide
Drawing toolbar
Status bar
Object bar
Function bar
Menu bar
Figure 13-4:
Create slide
presenta-
tions by
using the
menus and
toolbars in
Impress.
214
Part III: Doing Stuff with SUSE
19_754935 ch13.qxp 11/7/05 9:56 PM Page 214
ߜ Status bar: Displays information about the current slide such as the cur-
rent slide number and the total count of slides. You can also click ele-
ments in the status bar and change settings such as the zoom factor for
viewing the slide.
In addition to these tool and icon bars, you can turn on many more toolbars
from the View➪Toolbars menu.
The largest part of the Impress window is the work area where you work on
the current slide and where you focus most of your attention.
Use the tooltips to find out what an icon or menu option does. Hover the
mouse cursor over a toolbar icon or a menu item, and Impress displays a
small tooltip window with a brief help message.
You don’t have to set up anything to start using Impress. However, if you ever
need to configure some aspects of Impress, you can do so through the Tools➪
Options and Tools➪Configure menus. In particular, the Presentation category
of the Tools➪Options window contains the options for Impress (Figure 13-5).
You should go through each of the Presentation options to see what you can
configure from this window.
Using Impress
When you start Impress, the Presentation Wizard prompts you for the type of
presentation you want. If Impress is already running, you get the Presentation
Wizard when you choose File➪New➪Presentation. If you want a blank presen-
tation, simply click Create in the first step of the Presentation Wizard (as in
Figure 13-6). Impress then displays an empty slide along with a gallery of
slide layouts from which you can change the slide’s layout.
Figure 13-5:
Set up
Impress
through the
options in
the
Presentation
category.
215
Chapter 13: Doing Even More Office Stuff in SUSE Linux
19_754935 ch13.qxp 11/7/05 9:56 PM Page 215
Typically, a slide layout might have a title area and some text bullets. You can
click and add the text to each of these areas. To insert any graphic image,
choose Insert➪Graphics and pick the graphics file you want to insert. You
can draw directly on the slide by using the drawing tools from the vertical
toolbar along the left side of the Impress window. To see which tool does
what, move the mouse over any icon, and a tooltip gives you a hint.
After you finish working on a slide, you can insert another slide by choosing
Insert➪Slide. Impress displays an Insert Slide dialog box (similar to the
Modify Slide dialog box shown in Figure 13-6), and you can select the layout
for the next slide.
To save a presentation, choose File➪Save from the menu. For new documents,
you have to provide a filename and select the directory to save the file.
That, in a nutshell, is how you create presentations in PowerPoint. In the fol-
lowing sections, I provide some quick tips for performing the following tasks
with Impress:
ߜ Preparing presentations
ߜ Adding graphics and special effects
ߜ Delivering presentations
Preparing presentations
Typically, you start with a blank slide with a specific layout. For example, the
slide has a title area and a bulleted list for the points you want to make with
Figure 13-6:
Click Create
in the
Presen-
tation
Wizard.
216
Part III: Doing Stuff with SUSE
19_754935 ch13.qxp 11/7/05 9:56 PM Page 216
the slide. You can click the title area, type the title, and then click the bul-
leted text area to start entering text. Then you add another slide and con-
tinue with the process until you finish the presentation.
If you’re going to present information that’s already in a Writer document,
you can use the outline of that Writer document to start a presentation. The
Writer document does have to follow one rule — it must use the heading styles
Heading 1, Heading 2, and so on for the major sections in the document.
To create a presentation from the outline of a Writer document that uses the
heading styles, open the document in Writer and choose Send➪Outline to
Presentation from the Writer menu. You should see an Impress window open
up with a new presentation that has slides based on the headings in the Writer
document. Each Heading 1 style becomes a new slide, and the Heading 2 and
Heading 3 styles appear as bulleted text in the slides.
After working on the set of slides, you may want to rearrange the slides. To
rearrange slides in a different order, choose View➪Slide Sorter. Impress dis-
plays an array of miniature-sized slides, arranged in a rectangular grid in the
work area (as in Figure 13-7). Think of this as the slide sorter view because
you can move the slides around and sort them in this view.
Figure 13-7:
Arrange
slides in this
slide sorter
view in
Impress.
217
Chapter 13: Doing Even More Office Stuff in SUSE Linux
19_754935 ch13.qxp 11/7/05 9:56 PM Page 217
In the slide sorter view shown in Figure 13-7, you can drag and drop slides
into different positions and rearrange them in the order you want. To delete a
slide in this view, click the slide to select it and press Delete (or choose
Edit➪Delete). When prompted to confirm the deletion, you can click Yes if
you really want to delete the slide. Double-click a slide to return to the usual
single-slide view.
As you work on the presentation, keep in mind these concepts:
ߜ Master slide: You can think of the master slide as the background of
every slide. If you put text or other fields (such as date and page
number) on the master slide, those elements appear on every slide in
the presentation.
ߜ Master notes: The idea is the same as that for the master slide. You can
define some fields and text on the master notes; these become part of
the background for your notes. The notes refer to the explanatory text
you add to the bottom of each slide.
Well, I could go on and on, but you can discover its capabilities best by
simply starting to use Impress.
Adding graphics and special effects
To jazz up your presentation, you might want to add graphics, charts, and
other special effects to the slides. With Impress, you can do nearly every-
thing you can think of — all you have to decide is how many bells and whis-
tles your presentation needs. It’s your call, but I recommend using these
features judiciously lest they detract from your presentation’s main message.
If you want to add some simple drawings to the slide, you can pick from the
drawing tools on the drawing toolbar on the bottom of the Impress window
(refer to Figure 13-4) and start drawing on the slide. To insert an image into
the slide, choose Insert➪Graphics and then select the image file you want to
insert.
You can also insert charts to graphically depict data. You start by inserting a
chart with dummy data, and then you edit the data as well as other features
of the chart. To add a chart and edit the data, follow these steps:
1. Choose Insert➪Chart.
A chart with the default chart type and dummy data appears.
218
Part III: Doing Stuff with SUSE
19_754935 ch13.qxp 11/7/05 9:56 PM Page 218
2. Resize the chart by dragging the handles around the border of the
chart; then right-click the chart and select Chart Data from the pop-up
menu that appears (see Figure 13-8).
A mini-spreadsheet appears with the dummy chart data.
3. Edit the row and column labels and enter the data you want the chart
to display.
4. When you’re done editing the chart, click the green checkmark over a
small chart icon, located to the right of the toolbar, to apply the
changes. Then click the check box in the upper-right corner to close
the Chart Data window.
5. To change the chart type, right-click the chart and select Chart Type
from the pop-up menu that appears; choose a new type and click OK.
You can do a lot more than just add graphics and charts to your slide presenta-
tions. You can insert spreadsheets and Writer documents into a slide, add text
that runs along a curve, and add special effects to various elements in a slide.
Figure 13-8:
Right-click
the chart to
modify the
data and
chart type.
219
Chapter 13: Doing Even More Office Stuff in SUSE Linux
19_754935 ch13.qxp 11/7/05 9:56 PM Page 219
Delivering presentations
After you prepare a spectacular set of slides, you have to deliver it to your
audience. This typically involves tasks such as preparing speaker’s notes,
running a slide show, converting the presentation into HTML for delivery via
the Web, and printing handouts.
You can also print an Impress presentation directly to an Adobe Portable
Document Format (.pdf) file. This feature makes it easy to electronically
share a presentation with everyone because anyone can easily view and print
.pdf files by using the free Adobe Reader.
220
Part III: Doing Stuff with SUSE
19_754935 ch13.qxp 11/7/05 9:56 PM Page 220