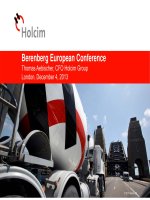
bellevue meets management seminar thomas aebischer cfo flims january 10 2014 holcim strength performance passion
Bạn đang xem bản rút gọn của tài liệu. Xem và tải ngay bản đầy đủ của tài liệu tại đây (1.8 MB, 29 trang )
Strength. Performance. Passion.
Bellevue Meets Management Seminar
Thomas Aebischer, CFO
Flims, January 10, 2014
© 2014 Holcim Ltd
© 2014 Holcim Ltd
Agenda
Holcim at a Glance
Holcim strategy and positioning based on long term growth
Holcim Leadership Journey
Society's future: Sustainable development and innovation
Holcim sustainability: Safety and development of leaders
Conclusions
Bellevue meets Management Seminar 2014
© 2014 Holcim Ltd
Holcim at a glance
130 cement plants
around 200 limestone quarries /
450 aggregates operations
1’150 RMX plants in the world
74’000 employees
over 5’000 own RMX trucks / more
than 3’000 subcontracted
over 1’600’000’000 cement bags sold
Presence on all five continents and in around 70 countries
2012 Net sales of CHF 21.5 bn and operating EBITDA of CHF 4.0 bn
3
Bellevue meets Management Seminar 2014
© 2014 Holcim Ltd
Cement the biggest earnings contributor in a well balanced
global portfolio
Net sales per region
15%
26.1%
36%
4.3%
17%
Op. EBITDA per region
12%
22%
36%
7%
23%
Africa Middle East
Europe
Asia Pacific
North America
Latin America
Other Construction
Materials and Services
Cement
Aggregates
Net sales per segment
11%
59%
30%
Op. EBITDA per segment
5%
84%
28%
Nine months figures as of September 30, 2013
11%
4%
4
Bellevue meets Management Seminar 2014
© 2014 Holcim Ltd
Agenda
Holcim at a Glance
Holcim strategy and positioning based on long term growth
Holcim Leadership Journey
Society's future: Sustainable development and innovation
Holcim sustainability: Safety, compliance, development of leaders
Conclusions
Bellevue meets Management Seminar 2014
© 2014 Holcim Ltd
Rapid urbanization: In 2010, for the first time in history
urban population exceeded rural population
São Paulo
6
Bellevue meets Management Seminar 2014
© 2014 Holcim Ltd
Growing demand for housing and infrastructure
Shanghai
7
Bellevue meets Management Seminar 2014
© 2014 Holcim Ltd
8
Europe
37%
45%
55%
22%
78%
16%
84%
North
America 10%
Asia
Pacific 30%
Latin
America 8%
Africa Middle
East 14%
Europe
18%
North
America 6%
Latin
America 11%
Asia
Pacific 38%
Africa Middle
East 27%
Europe
13%
North
America 5%
Latin
America 10%
Asia
Pacific 42%
Africa Middle
East 29%
1990 2012 2030
1990: ~0.8 Bn t 2012: ~1.6 Bn t 2030*: ~2.7 Bn t
Cement demand Split Mature vs. Emerging markets
Cement demand evolution by region, excl. China
Mature Emerging
*Source: BMI, Holcim estimates
Long-term cement consumption growth is driven by
emerging markets and recovery in Europe and US
Bellevue meets Management Seminar 2014
© 2014 Holcim Ltd
9
5
60
18
26
26
11
19
3
5
65*
4
12
7
11
Holcim cement capacity as of September 30, 2013: 207 Mt
Holcim is well positioned to address growth in cement
demand
* China not consolidated
Bellevue meets Management Seminar 2014
© 2014 Holcim Ltd
Agenda
Holcim at a Glance
Holcim strategy and positioning based on long term growth
Holcim Leadership Journey
Society's future: Sustainable development and innovation
Holcim sustainability: Safety and development of leaders
Conclusions
Bellevue meets Management Seminar 2014
© 2014 Holcim Ltd
The Holcim Leadership Journey and a focused capital
allocation to increase short and long term returns
Holcim Leadership Journey
Operating profit increase of at least CHF 1.5 bn and ROIC
AT
> 8%* by 2014
Customer Excellence Cost Leadership
CHF 500 m
> CHF 1 bn
Capture demand through advice & service Optimization of cost base
Customer focus
Value management
Pricing policies
Marketing and sales
Energy and AFR
Logistics
Procurement
Fixed cost
*Under similar markets conditions. Corresponds to a ROIC
BT
of > 11.8%
11
Bellevue meets Management Seminar 2014
© 2014 Holcim Ltd
Holcim Leadership Journey is on track
All figures in million CHF
2012 2013 2014
Target
achieved
Cumulative
Target
9M
Cumulative
Target
Customer Excellence (operating profit impact)
50-100
31
150-200
95
500
-
Customer focus
-
Value management
-
Pricing policies
-
Marketing and sales forces skills and motivation
Cost Leadership (operating profit impact)
100-200
127
400-500
531
> 1,000
-
Energy and AFR
40
146
> 300
-
Logistics
0
104
> 250
-
Procurement
48
131
> 250
-
Fixed cost
39
151
> 200
Total increase in operating
profit
1)
150-300
158
550-700
626
> 1,500
Cash cost to achieve the savings (one
-off) < 80
239
3)
0
3)
0
Additional CAPEX
net
2)
0-40
48
100-180
105
100-180
1) The base line is the financial year 2011 amounting to CHF 2,308 million (excluding one-off charges 2011 of CHF 375 m and without fluctuations in currency, changes in scope of
consolidation and similar market conditions)
2) Additional CAPEX net will come from prioritization of CAPEX based on the speed of the returns (ROIC).
Current energy fund of CHF 100 million will be maintained through the period 2012 – 2014
3) Original
amount was projected < CHF 120 million for 2013; having spent already CHF 239 million, no additional restructuring cash costs are foreseen at this stage
12
Bellevue meets Management Seminar 2014
© 2014 Holcim Ltd
Agenda
Holcim at a Glance
Holcim strategy and positioning based on long term growth
Holcim Leadership Journey
Society's future: Sustainable development and innovation
Holcim sustainability: Safety and development of leaders
Conclusions
Bellevue meets Management Seminar 2014
© 2014 Holcim Ltd
By 2020 ~60% of Holcim sales should be in markets with CO
2
regulations
14
Existing regulations Regulations under development On-going discussion No change
New Zealand: Intensity
based ETS
Australia: ETS in launched
China: Pilot ETS in Hubei,
national ETS as of 2015
EU-EFTA: Cap
and Trade ETS
Canada: regulations in
Quebec, Ontario, British
Columbia, Alberta
US: Cap and Trade
ETS in California
South Korea: intensity
based ETS
Mexico: ETS being
discussed
Switzerland: Cap and
Trade ETS (linked to EU)
Russia: Cap and Trade
ETS under development
Kazakhstan: Cap and
Trade ETS per 2014
India: Energy Efficiency
Trading system
South Africa: CO2 tax
from 2015
Source: Holcim
Bellevue meets Management Seminar 2014
© 2014 Holcim Ltd
Substantial change in energy mix (in TJ equivalents)
Holcim has taken substantial measures to improve energy
efficiency and to reduce CO
2
emissions…
% improvement
2015 2012 2011 2010 2005 2000 1990
kgCO
2
/t cem
Sector average emissions (WBCSD-GNR database)
% improvement
Specific net CO
2
emissions
Holcim specific CO
2
emissions
Source: Holcim
Total energy consumption per Mt of cement
produced down by 34% since 1990
Traditional (coal, petcoke etc.)
Energy from waste
Biomass
Power (electricity)
1990 2012
-30
-25
-20
-15
-10
-5
0
500
550
600
650
700
750
800
15
Bellevue meets Management Seminar 2014
© 2014 Holcim Ltd
16
… and today is leading the industry in terms of carbon
efficiency
550
570
590
610
630
650
670
690
710
730
750
2008 2009 2010 2011 2012
KgCO
2
/ton
Specific net CO
2
emissions
Holcim
Average
Source: Annual sustainability reports, average industry assumed from PwC-GNR report
• CO
2
emissions are reduced by:
Replacing clinker with
mineral components
Replacing traditional fuels
with alternative fuels
Reducing thermal
consumption in clinker
production
• Net CO
2
emissions per ton of
cement are a key indicator for
process and resource
efficiency
Holcim has lowest CO
2
emissions per ton of cement in the industry
Bellevue meets Management Seminar 2014
© 2014 Holcim Ltd
Holcim successfully develops new products that can be
manufactured more efficiently…
Actions on energy and climate change go beyond efficiency in operations
4% 31%
Transportation
12%
Other Waste
30% 5%
Cement industry Buildings Industry
18%
Direct and indirect sources; excluding emissions from forestry and agriculture
Source: IPCC
Sources of Green House Gas emissions
17
Bellevue meets Management Seminar 2014
© 2014 Holcim Ltd
…and valorizes waste as alternative fuel and material
Efficient for economic, social and environmental reasons
Waste
30% 31% 18% 4% 12%
Cement industry
5%
Transportation Buildings Other Industry
Direct and indirect sources; excluding emissions from forestry and agriculture
Source: IPCC
Sources of Green House Gas emissions
18
Bellevue meets Management Seminar 2014
© 2014 Holcim Ltd
Holcim brings solutions to reduce emissions on the
infrastructure
Buildings Industry Transportation Waste Other
30% 18% 31% 4% 12%
Cement industry
5%
Direct and indirect sources; excluding emissions from forestry and agriculture
Source: IPCC
Sources of Green House Gas emissions
Partnerships and innovation along the value chain are fundamental
19
Bellevue meets Management Seminar 2014
© 2014 Holcim Ltd
The next step change is bringing solutions to reduce energy
and emissions during the life of a building
Ecoterm® Ready-mix
0
100
200
300
400
kWh/ym2
-25%
Ecoterm Concrete
Blocks
Regular
concrete
Energy needs
31% 18% 4% 12%
Industry Cement industry
5% 30%
Waste Transportation Buildings Other
Direct and indirect sources; excluding emissions from forestry and agriculture
Source: IPCC
Sources of Green House Gas emissions
Concrete is one of the most eco-friendly building material over the life cycle
of the product
20
Bellevue meets Management Seminar 2014
© 2014 Holcim Ltd
The business case for sustainable development
• Sustainable development is our license to operate
• Sustainability is not philanthropy but a sound business case
• Holcim’s sustainability initiatives lead to a reduction in the use or emission
of energy, resource, capital and CO
2
emissions
• Beyond the environmental and business positives, being a sustainable
company
Attracts and retains talent
Stimulates innovation and cost effectiveness
Inspires people to reduce energy, resources, capital and CO
2
intensity
CO
2
is the an efficiency KPI for cement; achieved by low clinker factor,
kWh/t, MJ/t and high Thermal Substitution Rate (TSR)
21
Bellevue meets Management Seminar 2014
© 2014 Holcim Ltd
Agenda
Holcim at a Glance
Holcim strategy and positioning based on long term growth
Holcim Leadership Journey
Society's future: Sustainable development and innovation
Holcim sustainability: Safety and development of leaders
Conclusions
Bellevue meets Management Seminar 2014
© 2014 Holcim Ltd
OH&S reflects our values of caring for people and society and is a key feature of a
performing business and at the heart of any leading organization
The OH&S key attributes of being a leader in Holcim
Safe work environment as the foundation (“A safe work place”)
Safe work environment seen as the foundation for strong OH&S culture
Different characteristics of design and process safety to occupational safety well
understood and addressed respectively
Strong OH&S Culture (“Passion for Safety”)
Everybody knows the risks of the workplace environment
OH&S mindset is license to lead
OH&S competences are part of the individual development plans.
Strategy of “Zero Harm to People”
Implement well-defined strategy and respective improvement plans
OH&S considerations at the heart of decision making
No compromise on safety policy
Organization
Culture
Equipment
Facilities
Strategy
Performance
Proven safety improvement processes (“Value adding processes”)
Solid management systems for continuous improvement.
Strong capabilities to identify and address deficiencies
Systems
Processes
23
Bellevue meets Management Seminar 2014
© 2014 Holcim Ltd
Rewarding Excellence
9
5
1
Entries Shortlist Winners
North America & UK
12
6
1
Entries Shortlist Winners
Africa Middle East
31
5
2
Entries Shortlist Winners
SESA
3 3
1
Entries Shortlist Winners
East Asia Oceania
24
22
7
2
Entries Shortlist Winners
Latin America
21
5
1
Entries Shortlist Winners
Europe
Bellevue meets Management Seminar 2014
© 2014 Holcim Ltd
Winners of the 2012 OH&S excellent awards
Holcim Canada
Safety Culture Program
Holcim Apasco
Health Tour
Holcim Lanka
Journey to Zero Road Fatalities
Cement
Australia
Employee Health
• Functional job profiles to
determine employee fitness
for job
• Address legacy of non work
related health issues
• Empower employees to
improve own health
• Results over 12 months
• 60% Reduction in duration
rate of injuries
• 60% Reduction in claims
costs
• 50% Reduction in
absenteeism
• 97% of employees have
undergone a physical examination
and standardized lab tests
• Clear understanding of major
health issues
• Specific measures implemented to
reduce risks
• Encouragement of individual
stretching exercise
• Prevents 90% of muscle-
skeletal lesions
• Driver audits with random
roadside inspections
• Defensive driving training
• 80% of drivers recognized as
Class one at Defensive Driving
• Fatalities caused by Holcim
logistics down to ZERO
• Dedicated warning signs on
high traffic routes
• Dedicated hotline in case of
complaints
• Initiated safety culture program with
leading external experts
• Interactive perception survey provided
immediate results
• Dedicated local workgroups at major
jobsites and projects
25
Bellevue meets Management Seminar 2014