adaptive basis function construction an approach for adaptive building of sparse polynomial regression models
Bạn đang xem bản rút gọn của tài liệu. Xem và tải ngay bản đầy đủ của tài liệu tại đây (764.37 KB, 31 trang )
Adaptive Basis Function Construction: An Approach
for Adaptive Building of Sparse Polynomial Regression Models 127
Adaptive Basis Function Construction: An Approach for Adaptive Building
of Sparse Polynomial Regression Models
Gints Jekabsons
x
Adaptive Basis Function Construction:
An Approach for Adaptive Building of Sparse
Polynomial Regression Models
Gints Jekabsons
Riga Technical University
Latvia
1. Introduction
The task of learning useful models from available data is common in virtually all fields of
science, engineering, and finance. The goal of the learning task is to estimate unknown
(input, output) dependency (or model) from training data (consisting of a finite number of
samples) with good prediction (generalization) capabilities for future (test) data
(Cherkassky & Mulier, 2007; Hastie et al., 2003). One of the specific learning tasks is
regression – estimating an unknown real-valued function. The process of regression model
learning is also called regression modelling or regression model building.
Many practical regression modelling methods use basis function representation – these are
also called dictionary methods (Friedman, 1994; Cherkassky & Mulier, 2007; Hastie et al.,
2003), where a particular type of chosen basis functions constitutes a “dictionary”. Further
distinction is then made between non-adaptive methods and adaptive (also called flexible)
methods.
The most widely used form of basis function expansions is polynomial of a fixed degree. If a
model always includes a fixed (predetermined) set of basis functions (i.e. they are not
adapted to training data), the modelling method is considered non-adaptive (Cherkassky &
Mulier, 2007; Hastie et al., 2003). Using adaptive modelling methods however the basis
functions themselves are adapted to data (by employing some kind of search mechanism).
This includes methods where the restriction of fixed polynomial degree is removed and the
model’s degree now becomes another parameter to fit. Adaptive methods use a very wide
dictionary of candidate basis functions and can, in principle, approximate any continuous
function with a pre-specified accuracy. This is also known as the universal approximation
property (Kolmogorov & Fomin, 1975, Cherkassky & Mulier, 2007).
However, in polynomial regression the increase in the model’s degree leads to exponential
growth of the number of basis functions in the model (Cherkassky & Mulier, 2007; Hastie et
al., 2003). With finite training data, the number of basis functions along with the number of
model’s parameters (coefficients) quickly exceeds the number of data samples, making
model’s parameter estimation impossible. Additionally the model should not be overly
8
www.intechopen.com
Machine Learning128
complex even if the number of its basis functions is lower than the number of data samples,
as too complex models will overfit the data and produce large prediction errors.
To obtain a polynomial regression model that does not overfit (nor underfit) and describes
the relations in data sufficiently well, typically the subset selection approach (Hastie et al.,
2003; Reunanen, 2006) is used where the goal is from a fixed full predetermined dictionary
of basis functions to find a subset which corresponds to a model (a sparse polynomial) with
the best predictive performance. This is done via combinatorial optimization. However, for
the subset selection approach still the two issues remain – deficiency of adaptation as well as
computational inefficiency.
Searching through all the possible combinations of basis functions takes double-exponential
runtime as the number of combinations grows exponentially in the number of basis
functions of the predetermined dictionary while the number of the basis functions in the
dictionary grows exponentially in the number of input variables and “full” model’s degree
(Hastie et al., 2003). This makes the exhaustive search through all the combinations
impractical. The heuristic greedy search algorithms, such as forward selection (Hastie et al.,
2003; Reunanen, 2006), substantially reduce the time and make it practical for not too large
number of input variables and not too high degree. Nevertheless, the search time actually is
still exponential, hindering their use in problems of larger dimensionality and hindering the
removal of the restriction of a fixed degree.
The approach of subset selection assumes that the chosen fixed finite dictionary of the
predefined basis functions contains a subset that is sufficient to describe the target relation
sufficiently well. However, in most practical situations the required dictionary (and “full”
model’s degree) is not known beforehand and needs to be either guessed or found by an
additional search loop over the whole model building process, since it will differ from one
regression task to another. In many cases, especially when the studied data dependencies
are complex and not well studied, this means either a non-trivial and long trial-and-error
process or acceptance of a possibly inadequate model.
This chapter presents a sparse polynomial regression model building approach which
enables adaptive model building without restrictions on model’s degree and does it in
polynomial time instead of exponential time (in the number of input variables, required
degree, and target model’s complexity) as well as without the requirement to repeat the
model building process. The required basis functions are automatically iteratively
constructed using heuristic search specifically for the particular data at hand instead of
choosing a subset from a very restricted finite user-defined dictionary (hence the approach
is called Adaptive Basis Function Construction, ABFC). The basis function dictionary now
becomes infinite and polynomials of arbitrary complexity can be generated bringing the
desired flexibility to the model building process.
The remainder of this chapter is organized as follows. The next two sections give brief
overview of polynomial regression and the subset selection approach. In Section 4 the ABFC
approach is described. Section 5 outlines the related work. The results of the empirical
evaluations of the proposed methods and their comparison to other well-known regression
modelling methods are presented in Section 6. Section 7 concludes this chapter.
2. Polynomial regression
In standard regression formulation (Vapnik, 1995; Cherkassky & Mulier, 2007; Hastie et al.,
2003) the goal is to estimate unknown real-valued function in the relationship
)(xGy , (1)
where
is independent and identically distributed random noise with zero mean,
), ,,(
21 d
xxxx is d-dimensional input, and y is scalar output. The estimation is made based
on a finite number of samples (training data) provided in form of matrix x of input values
for each sample and vector y of output values for each corresponding sample. Using the
finite number n of training samples ),(
jj
yx ,
nj , ,2,1
one wants to build a model F that
allows predicting the output values for yet unseen input values as closely as possible.
Generally, a linear regression model may be defined as a linear expansion of basis functions:
k
i
ii
xfaxF
1
)()( , (2)
where
T
k
aaa ), ,,(
21
a are model’s parameters, k is the number of basis functions included
in the model (equal to the number of model’s parameters), and
)(xf
i
, ki , ,2,1
are the
included basis functions of the input x. As the model is linear in the parameters, the
estimation of its parameters is typically done using the Ordinary Least-Squares (OLS)
method (Hastie et al., 2003) minimizing the squared-error:
n
j
jj
Fy
1
2
)(minarg xa
a
. (3)
The basis function representation enables moving beyond pure linearity, by defining
nonlinear transformations of x while still working with linear models (and employing OLS).
For example, for d = 1 a polynomial model of fixed degree p can be defined as follows:
p
i
i
i
xaxF
0
)( . (4)
Generally for a given
d and p the total number of basis functions in a “full” polynomial, i.e.
the total number of basis functions in the dictionary, is
p
i
idm
1
/1 . (5)
www.intechopen.com
Adaptive Basis Function Construction: An Approach
for Adaptive Building of Sparse Polynomial Regression Models 129
complex even if the number of its basis functions is lower than the number of data samples,
as too complex models will overfit the data and produce large prediction errors.
To obtain a polynomial regression model that does not overfit (nor underfit) and describes
the relations in data sufficiently well, typically the subset selection approach (Hastie et al.,
2003; Reunanen, 2006) is used where the goal is from a fixed full predetermined dictionary
of basis functions to find a subset which corresponds to a model (a sparse polynomial) with
the best predictive performance. This is done via combinatorial optimization. However, for
the subset selection approach still the two issues remain – deficiency of adaptation as well as
computational inefficiency.
Searching through all the possible combinations of basis functions takes double-exponential
runtime as the number of combinations grows exponentially in the number of basis
functions of the predetermined dictionary while the number of the basis functions in the
dictionary grows exponentially in the number of input variables and “full” model’s degree
(Hastie et al., 2003). This makes the exhaustive search through all the combinations
impractical. The heuristic greedy search algorithms, such as forward selection (Hastie et al.,
2003; Reunanen, 2006), substantially reduce the time and make it practical for not too large
number of input variables and not too high degree. Nevertheless, the search time actually is
still exponential, hindering their use in problems of larger dimensionality and hindering the
removal of the restriction of a fixed degree.
The approach of subset selection assumes that the chosen fixed finite dictionary of the
predefined basis functions contains a subset that is sufficient to describe the target relation
sufficiently well. However, in most practical situations the required dictionary (and “full”
model’s degree) is not known beforehand and needs to be either guessed or found by an
additional search loop over the whole model building process, since it will differ from one
regression task to another. In many cases, especially when the studied data dependencies
are complex and not well studied, this means either a non-trivial and long trial-and-error
process or acceptance of a possibly inadequate model.
This chapter presents a sparse polynomial regression model building approach which
enables adaptive model building without restrictions on model’s degree and does it in
polynomial time instead of exponential time (in the number of input variables, required
degree, and target model’s complexity) as well as without the requirement to repeat the
model building process. The required basis functions are automatically iteratively
constructed using heuristic search specifically for the particular data at hand instead of
choosing a subset from a very restricted finite user-defined dictionary (hence the approach
is called Adaptive Basis Function Construction, ABFC). The basis function dictionary now
becomes infinite and polynomials of arbitrary complexity can be generated bringing the
desired flexibility to the model building process.
The remainder of this chapter is organized as follows. The next two sections give brief
overview of polynomial regression and the subset selection approach. In Section 4 the ABFC
approach is described. Section 5 outlines the related work. The results of the empirical
evaluations of the proposed methods and their comparison to other well-known regression
modelling methods are presented in Section 6. Section 7 concludes this chapter.
2. Polynomial regression
In standard regression formulation (Vapnik, 1995; Cherkassky & Mulier, 2007; Hastie et al.,
2003) the goal is to estimate unknown real-valued function in the relationship
)(xGy , (1)
where
is independent and identically distributed random noise with zero mean,
), ,,(
21 d
xxxx is d-dimensional input, and y is scalar output. The estimation is made based
on a finite number of samples (training data) provided in form of matrix x of input values
for each sample and vector y of output values for each corresponding sample. Using the
finite number n of training samples ),(
jj
yx ,
nj , ,2,1
one wants to build a model F that
allows predicting the output values for yet unseen input values as closely as possible.
Generally, a linear regression model may be defined as a linear expansion of basis functions:
k
i
ii
xfaxF
1
)()( , (2)
where
T
k
aaa ), ,,(
21
a are model’s parameters, k is the number of basis functions included
in the model (equal to the number of model’s parameters), and
)(xf
i
, ki , ,2,1 are the
included basis functions of the input x. As the model is linear in the parameters, the
estimation of its parameters is typically done using the Ordinary Least-Squares (OLS)
method (Hastie et al., 2003) minimizing the squared-error:
n
j
jj
Fy
1
2
)(minarg xa
a
. (3)
The basis function representation enables moving beyond pure linearity, by defining
nonlinear transformations of x while still working with linear models (and employing OLS).
For example, for d = 1 a polynomial model of fixed degree p can be defined as follows:
p
i
i
i
xaxF
0
)( . (4)
Generally for a given
d and p the total number of basis functions in a “full” polynomial, i.e.
the total number of basis functions in the dictionary, is
p
i
idm
1
/1 . (5)
www.intechopen.com
Machine Learning130
3. Subset selection
Models which are too complex (i.e. that fit the training data too well causing overfitting) or
too simple (i.e. that fit the data poorly causing underfitting) provide poor predictive
performance for the future data. The most popular approach of controlling model’s
complexity is subset selection. The goal of subset selection is from a fixed full predetermined
dictionary of basis functions to find a subset that provides the best predictive performance
of the model (Hastie et al., 2003; Reunanen, 2006). Now in addition to the estimation of
model’s parameters, the structure of the model itself needs to be found.
The total number of possible subsets from a dictionary of size
m is
m
2 . This means that
searching through all the possible subsets is in most cases impractical. Hence in subset
selection heuristic search algorithms are used. They efficiently traverse the space of subsets,
by adding and deleting basis functions of the model, and use model evaluation measure to
direct the search into areas of increased performance. The typical examples of heuristic
search algorithms are the greedy hill-climbing algorithms – Forward Selection (also known
as Sequential Forward Selection, SFS) and Backward Elimination (also known as Sequential
Backward Selection, SBS) (Hastie et al., 2003; Reunanen, 2006). However, there exist also
more recently developed search strategies, such as Beam Search, Floating Search, Simulated
Annealing, Genetic Algorithms etc. (Reunanen, 2006; Pudil et al., 1994; Russel & Norvig,
2002).
Summarizing (Russel & Norvig, 2002; Molina et al., 2002; Kohavi & John, 1997), in order to
characterize a heuristic search problem one must define the following: 1) initial state of the
search; 2) available state-transition operators; 3) search strategy; 4) evaluation measure;
5) termination condition. Note that in the context of model building the “initial state” is also
called “initial model” and the “state-transition operators” are also called “model refinement
operators”.
In the subset selection approach for polynomial regression, typically the initial state is the
model that corresponds to the empty subset, the subset with only the intercept term in it,
full set of all the defined basis functions, or a randomly chosen subset. The typical basic
state-transition operators are addition and deletion of a basis function. The typical search
strategy is the hill-climbing (Russel & Norvig, 2002) which, in combination with the empty
(or sufficiently small) subset as initial state and the addition operator, becomes SFS, but, in
combination with the full subset as initial state and the deletion operator, becomes SBS. As
the evaluation measures classically the statistical significance tests are used (Hastie et al., 2003;
Dreyfus & Guyon, 2006). However, in model building currently two other strategies
predominate (Cherkassky & Mulier, 2007; Dreyfus & Guyon, 2006): employment of
complexity penalization criteria (also known as analytical criteria), e.g., the well-known
Akaike’s Information Criterion, AIC (Akaike, 1974; Burnham & Anderson, 2002), and the
resampling techniques, e.g., Hold-Out, Cross-Validation (CV), and Bootstrap (Kohavi, 1995;
Hastie et al., 2003; Dreyfus & Guyon, 2006). The termination condition typically corresponds
to finding of a state in that none of the state-transition operators can lead to a better state
(i.e. a local minimum).
In polynomial regression, increase in the model’s degree leads to exponential growth of the
number of basis functions in the dictionary, i.e.
)()(
p
dOmO (Cherkassky & Mulier, 2007;
Hastie et al., 2003) and to double-exponential growth of the number of all possible subsets
(or the number of states in the state space): )2()2(
p
dm
OO . When using one or both of the
two basic state-transition operators, the order of the branching factor of a state in the state
space in the very first iteration of the search is already equal to the number of basis
functions in the dictionary, i.e. it also increases exponentially.
Assuming that the “best” model found in the search process includes a total of
k basis
functions and that in each iteration the number of basis functions of the current model is
increased by 1, the total number of evaluated models (subsets) is of order
)(
1
kdOdO
p
k
i
p
. (6)
Hence for larger values of
d and p (e.g., when m reaches thousands) subset selection is
rendered impractical. Additionally, because of the branching factor’s direct dependence on
the number of basis functions in the dictionary, the idea of unrestricted degree (i.e.
dictionary of infinite size) is hardly applicable.
The computational problem could be somewhat reduced by choosing a sufficiently small
but useful value of
p before the actual model building is performed. However, generally the
required maximal degree is not known beforehand and needs to be either guessed or found
by additional search loop over the whole model building process, since it will differ from
one regression task to another, which means either a non-trivial and long trial-and-error
process or acceptance of a possibly inadequate model.
4. Adaptive Basis Function Construction
This section introduces Adaptive Basis Function Construction – a possible alternative to the
classical subset selection approach. The goal of the ABFC approach is to overcome some of
the limitations associated with the subset selection, outlined in the previous section. The
ABFC approach is developed for sparse polynomial regression model building without
restrictions on model’s degree, enables model building in polynomial time, and does not
require repetition of the building process (in contrast to the subset selection approach). The
required basis functions are automatically adaptively constructed specifically for data at
hand, without using a restricted fixed finite user-defined dictionary. The dictionary in the
ABFC is infinite and polynomials of arbitrary complexity can be constructed.
4.1 The models and the basis functions
Generally, a basis function in a polynomial regression model can be defined as a product of
original input variables each with an individual exponent:
d
j
r
ji
ij
xxf
1
)( , (7)
where r is a dk matrix of nonnegative integer exponents such that r
ij
is the exponent of
the
jth variable in the ith basis function. Note that, when for a particular ith basis function
r
ij
= 0 for all j, the basis function is the intercept term.
www.intechopen.com
Adaptive Basis Function Construction: An Approach
for Adaptive Building of Sparse Polynomial Regression Models 131
3. Subset selection
Models which are too complex (i.e. that fit the training data too well causing overfitting) or
too simple (i.e. that fit the data poorly causing underfitting) provide poor predictive
performance for the future data. The most popular approach of controlling model’s
complexity is subset selection. The goal of subset selection is from a fixed full predetermined
dictionary of basis functions to find a subset that provides the best predictive performance
of the model (Hastie et al., 2003; Reunanen, 2006). Now in addition to the estimation of
model’s parameters, the structure of the model itself needs to be found.
The total number of possible subsets from a dictionary of size
m is
m
2 . This means that
searching through all the possible subsets is in most cases impractical. Hence in subset
selection heuristic search algorithms are used. They efficiently traverse the space of subsets,
by adding and deleting basis functions of the model, and use model evaluation measure to
direct the search into areas of increased performance. The typical examples of heuristic
search algorithms are the greedy hill-climbing algorithms – Forward Selection (also known
as Sequential Forward Selection, SFS) and Backward Elimination (also known as Sequential
Backward Selection, SBS) (Hastie et al., 2003; Reunanen, 2006). However, there exist also
more recently developed search strategies, such as Beam Search, Floating Search, Simulated
Annealing, Genetic Algorithms etc. (Reunanen, 2006; Pudil et al., 1994; Russel & Norvig,
2002).
Summarizing (Russel & Norvig, 2002; Molina et al., 2002; Kohavi & John, 1997), in order to
characterize a heuristic search problem one must define the following: 1) initial state of the
search; 2) available state-transition operators; 3) search strategy; 4) evaluation measure;
5) termination condition. Note that in the context of model building the “initial state” is also
called “initial model” and the “state-transition operators” are also called “model refinement
operators”.
In the subset selection approach for polynomial regression, typically the initial state is the
model that corresponds to the empty subset, the subset with only the intercept term in it,
full set of all the defined basis functions, or a randomly chosen subset. The typical basic
state-transition operators are addition and deletion of a basis function. The typical search
strategy is the hill-climbing (Russel & Norvig, 2002) which, in combination with the empty
(or sufficiently small) subset as initial state and the addition operator, becomes SFS, but, in
combination with the full subset as initial state and the deletion operator, becomes SBS. As
the evaluation measures classically the statistical significance tests are used (Hastie et al., 2003;
Dreyfus & Guyon, 2006). However, in model building currently two other strategies
predominate (Cherkassky & Mulier, 2007; Dreyfus & Guyon, 2006): employment of
complexity penalization criteria (also known as analytical criteria), e.g., the well-known
Akaike’s Information Criterion, AIC (Akaike, 1974; Burnham & Anderson, 2002), and the
resampling techniques, e.g., Hold-Out, Cross-Validation (CV), and Bootstrap (Kohavi, 1995;
Hastie et al., 2003; Dreyfus & Guyon, 2006). The termination condition typically corresponds
to finding of a state in that none of the state-transition operators can lead to a better state
(i.e. a local minimum).
In polynomial regression, increase in the model’s degree leads to exponential growth of the
number of basis functions in the dictionary, i.e.
)()(
p
dOmO (Cherkassky & Mulier, 2007;
Hastie et al., 2003) and to double-exponential growth of the number of all possible subsets
(or the number of states in the state space): )2()2(
p
dm
OO . When using one or both of the
two basic state-transition operators, the order of the branching factor of a state in the state
space in the very first iteration of the search is already equal to the number of basis
functions in the dictionary, i.e. it also increases exponentially.
Assuming that the “best” model found in the search process includes a total of
k basis
functions and that in each iteration the number of basis functions of the current model is
increased by 1, the total number of evaluated models (subsets) is of order
)(
1
kdOdO
p
k
i
p
. (6)
Hence for larger values of
d and p (e.g., when m reaches thousands) subset selection is
rendered impractical. Additionally, because of the branching factor’s direct dependence on
the number of basis functions in the dictionary, the idea of unrestricted degree (i.e.
dictionary of infinite size) is hardly applicable.
The computational problem could be somewhat reduced by choosing a sufficiently small
but useful value of
p before the actual model building is performed. However, generally the
required maximal degree is not known beforehand and needs to be either guessed or found
by additional search loop over the whole model building process, since it will differ from
one regression task to another, which means either a non-trivial and long trial-and-error
process or acceptance of a possibly inadequate model.
4. Adaptive Basis Function Construction
This section introduces Adaptive Basis Function Construction – a possible alternative to the
classical subset selection approach. The goal of the ABFC approach is to overcome some of
the limitations associated with the subset selection, outlined in the previous section. The
ABFC approach is developed for sparse polynomial regression model building without
restrictions on model’s degree, enables model building in polynomial time, and does not
require repetition of the building process (in contrast to the subset selection approach). The
required basis functions are automatically adaptively constructed specifically for data at
hand, without using a restricted fixed finite user-defined dictionary. The dictionary in the
ABFC is infinite and polynomials of arbitrary complexity can be constructed.
4.1 The models and the basis functions
Generally, a basis function in a polynomial regression model can be defined as a product of
original input variables each with an individual exponent:
d
j
r
ji
ij
xxf
1
)( , (7)
where r is a dk matrix of nonnegative integer exponents such that r
ij
is the exponent of
the
jth variable in the ith basis function. Note that, when for a particular ith basis function
r
ij
= 0 for all j, the basis function is the intercept term.
www.intechopen.com
Machine Learning132
Given a number of input variables d, matrix r, with a specified number of rows k and with
specified values for each of its elements, completely defines the structure of a polynomial
model with all its basis functions. The set of basis functions, included in a model, is then
kixf
d
j
r
j
ij
, ,2,1
1
. (8)
For example, if
d = 3 and k = 4, then the matrix
111
310
001
000
r (9)
corresponds to the set
321
3
321
1
3
1
2
1
1
3
3
1
2
0
1
0
3
0
2
1
1
0
3
0
2
0
1
,,,1,,, xxxxxxxxxxxxxxxxxxf , (10)
which in turn corresponds to the model
3214
3
323121
)( xxxaxxaxaaxF . (11)
Formally, the problem of finding the best set of basis functions can be defined as finding the
best matrix r with the best combination of nonnegative integer values of its elements:
kixJ
d
j
r
j
ij
, ,2,1minarg
1
r
r , (12)
where J(.) is an evaluation criterion that evaluates the predictive performance of the
regression model which corresponds to the set of basis functions.
As neither the upper bounds of
r elements’ values nor the upper bound of k are defined, it is
possible to generate sparse polynomials of arbitrary complexity, i.e. of arbitrary number of
basis functions each with an arbitrary exponent for each input variable. This also means that
the searchable state space is infinite.
4.2 The search process
Finding the “best” structure of matrix
r requires search. In this section the five components
(outlined in Section 3) of a heuristic search problem are analyzed in the context of the ABFC
approach.
Initial state. In ABFC, the state space is infinite therefore a natural initial state of the search is
the state that corresponds to the simplest model located in the space. In the current study it
is assumed that the simplest model is the one with a single basis function corresponding to
the intercept term. However, also other models could be used as initial states, e.g., an empty
model (without any basis functions), a first degree “full” polynomial, or a small randomly
generated model. Note that in the current study the basis function corresponding to the
intercept term stays in the model at all times and is not allowed to be modified or deleted.
State-transition operators. Using efficient state-transition operators is vital for the search
process to be efficient. The employed state-transition operators are the main methodological
difference between the subset selection approach and the ABFC approach. Generally, there
are two different basic types of modifications to an existing polynomial model: complication
and simplification (Jekabsons & Lavendels, 2008a). In the subset selection approach, these
are the addition and deletion operators. The addition operator makes the model more
complex (by adding a new basis function) but the deletion operator makes it simpler (by
deleting an existing basis function).
In the ABFC, the two standard operators from subset selection are replaced with other
operators that not only add or delete basis functions but also work on the level of individual
exponents, modifying the existing basis functions and creating modified copies of them. The
basic idea is to use an operator that adds only the simplest (i.e. linear) basis functions which
serve as a basic material for further construction of more complex functions using other
operators. In this manner there is no need for an operator that explicitly tries to add basis
functions of each possible combination of exponent values (as the addition operator in the
subset selection). Hence the branching factor of the state space stays not only finite but also
relatively small while the state space itself is infinite.
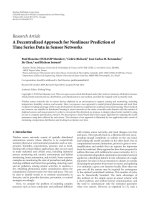
In this study, a set of the following four state-transition operators for the polynomial
regression model building are proposed. Operator1: Addition of a new linear basis function
with one of its exponents set to one and all the others set to zero. Operator2: Addition of an
exact copy of an already existing (in the current model) basis function with one of its
exponents increased by 1. Operator3: Decreasing of one of the exponents in one of the
existing basis functions by 1. Operator4: Deleting of one of the existing basis functions.
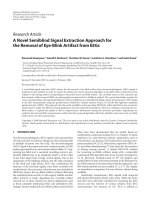
Figure 1 gives examples of the operators operating on a simple matrix.
Fig. 1. Example of the four state-transition operators operating on a simple matrix:
(a) Operator1; (b) Operator2; (c) Operator3; (d) Operator4
The set of the four state-transition operators is sufficient to generate any polynomial model
definable by the matrix
r. Their use can also be viewed as a piece of application-domain
knowledge. While starting the search from the simplest model, the complication operators
(the first two) do the main job – they “grow” the model. The simplification operators (the
last two), on the other hand, work as “purifiers” – they decrease the unnecessarily high
exponents and delete the unnecessary basis functions. Without the use of simplification
operators, a regression model may contain unnecessarily high exponents and include too
www.intechopen.com
Adaptive Basis Function Construction: An Approach
for Adaptive Building of Sparse Polynomial Regression Models 133
Given a number of input variables d, matrix r, with a specified number of rows k and with
specified values for each of its elements, completely defines the structure of a polynomial
model with all its basis functions. The set of basis functions, included in a model, is then
kixf
d
j
r
j
ij
, ,2,1
1
. (8)
For example, if
d = 3 and k = 4, then the matrix
111
310
001
000
r (9)
corresponds to the set
321
3
321
1
3
1
2
1
1
3
3
1
2
0
1
0
3
0
2
1
1
0
3
0
2
0
1
,,,1,,, xxxxxxxxxxxxxxxxxxf , (10)
which in turn corresponds to the model
3214
3
323121
)( xxxaxxaxaaxF . (11)
Formally, the problem of finding the best set of basis functions can be defined as finding the
best matrix r with the best combination of nonnegative integer values of its elements:
kixJ
d
j
r
j
ij
, ,2,1minarg
1
r
r , (12)
where J(.) is an evaluation criterion that evaluates the predictive performance of the
regression model which corresponds to the set of basis functions.
As neither the upper bounds of
r elements’ values nor the upper bound of k are defined, it is
possible to generate sparse polynomials of arbitrary complexity, i.e. of arbitrary number of
basis functions each with an arbitrary exponent for each input variable. This also means that
the searchable state space is infinite.
4.2 The search process
Finding the “best” structure of matrix
r requires search. In this section the five components
(outlined in Section 3) of a heuristic search problem are analyzed in the context of the ABFC
approach.
Initial state. In ABFC, the state space is infinite therefore a natural initial state of the search is
the state that corresponds to the simplest model located in the space. In the current study it
is assumed that the simplest model is the one with a single basis function corresponding to
the intercept term. However, also other models could be used as initial states, e.g., an empty
model (without any basis functions), a first degree “full” polynomial, or a small randomly
generated model. Note that in the current study the basis function corresponding to the
intercept term stays in the model at all times and is not allowed to be modified or deleted.
State-transition operators. Using efficient state-transition operators is vital for the search
process to be efficient. The employed state-transition operators are the main methodological
difference between the subset selection approach and the ABFC approach. Generally, there
are two different basic types of modifications to an existing polynomial model: complication
and simplification (Jekabsons & Lavendels, 2008a). In the subset selection approach, these
are the addition and deletion operators. The addition operator makes the model more
complex (by adding a new basis function) but the deletion operator makes it simpler (by
deleting an existing basis function).
In the ABFC, the two standard operators from subset selection are replaced with other
operators that not only add or delete basis functions but also work on the level of individual
exponents, modifying the existing basis functions and creating modified copies of them. The
basic idea is to use an operator that adds only the simplest (i.e. linear) basis functions which
serve as a basic material for further construction of more complex functions using other
operators. In this manner there is no need for an operator that explicitly tries to add basis
functions of each possible combination of exponent values (as the addition operator in the
subset selection). Hence the branching factor of the state space stays not only finite but also
relatively small while the state space itself is infinite.
In this study, a set of the following four state-transition operators for the polynomial
regression model building are proposed. Operator1: Addition of a new linear basis function
with one of its exponents set to one and all the others set to zero. Operator2: Addition of an
exact copy of an already existing (in the current model) basis function with one of its
exponents increased by 1. Operator3: Decreasing of one of the exponents in one of the
existing basis functions by 1. Operator4: Deleting of one of the existing basis functions.
Figure 1 gives examples of the operators operating on a simple matrix.
Fig. 1. Example of the four state-transition operators operating on a simple matrix:
(a) Operator1; (b) Operator2; (c) Operator3; (d) Operator4
The set of the four state-transition operators is sufficient to generate any polynomial model
definable by the matrix
r. Their use can also be viewed as a piece of application-domain
knowledge. While starting the search from the simplest model, the complication operators
(the first two) do the main job – they “grow” the model. The simplification operators (the
last two), on the other hand, work as “purifiers” – they decrease the unnecessarily high
exponents and delete the unnecessary basis functions. Without the use of simplification
operators, a regression model may contain unnecessarily high exponents and include too
www.intechopen.com
Machine Learning134
many unnecessary basis functions, at the same time preventing truly necessary
modifications (this is also known as the nesting effect (Pudil et al., 1994)) and increasing
overfitting. Additionally, for all the state-transition operators a special care is taken to
prevent basis function duplicates in the resulting model as well as to preserve the intercept
term.
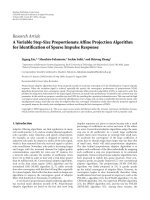
The initial state and the state-transition operators together form a state space. Figure 2
shows a small example of a state space in ABFC when the number of input variables is three
and all the four state-transition operators are used. Each state represents a set of basis
functions included in the regression model. The ordering of the states in the space is such
that the simplest models and the simplest basis functions are reached first and, as the search
goes on, increasingly complex models and basis functions can be reached.
Fig. 2. A small example of the first three layers of a state space in ABFC when d = 3 (the
space is infinite in the direction of more complex models)
In the Section 3, it is stated that in the subset selection approach the branching factor of a
state in the state space increases exponentially with respect to the number of input variables
d and pre-specified maximal degree p. In ABFC, the branching factor of the current state in
the state space depends on
d and on the number of basis functions k, already included in the
current model. The upper bound of the number of possible modifications to a model using
Operator1 is equal to d; using Operator2 and Operator3 it is equal to dk; and using
Operator4 it is equal to
k. So the upper bound of the branching factor is of order
)()2( dkOkdkdO
that is linear in respect to both d and k.
Search strategy. Most of the heuristic search algorithms of the hill-climbing type can be
divided in two categories: those that assume the model state-transition operators to be of
either or both the forward and the backward type (e.g., SFS, SBS, and Floating Search
algorithms) and those that do not distinguish between the two types (e.g., Steepest Descent
Hill-Climbing and Simulated Annealing). The four operators proposed in this study are
naturally divided in forward (complication) and backward (simplification) operators;
therefore in ABFC both categories of the search algorithms can be applied.
On the other hand, non-hill-climbing search algorithms, e.g., Genetic Algorithms and the
like, employ completely different kind of operators (i.e. Crossover and Mutation). While
they could be adapted to work with the infinite dictionary of basis functions, their major
disadvantage is that, in contrast to the simple hill-climbing algorithms, they are not
generally biased towards simpler models. In large state spaces they often spend most of the
time exploring too complex models while the “best” ones are in fact mostly the relatively
simple ones.
Evaluation measure. The proposed state-transition operators allow using the same methods
for model evaluation and comparison as those used in subset selection. However, note that
the model complexity penalization criteria, in contrast to the resampling techniques, usually
require substantially lower computational resources as well as are less noisy creating less
local minima in the state space.
Termination condition. Many different termination conditions can be used to terminate the
search process. Some of most widely used ones are the following: a) a user pre-specified
number of iterations is reached; b) a user pre-specified size of the model is reached; c) using
the available state-transition operators the model could not be improved any further
(evaluated by the chosen evaluation measure). The first two termination conditions require
the user to set a hyperparameter value. This is a non-trivial task as usually the required
information is not available. Adjusting such a hyperparameter may also require too large
amounts of computational resources. In this study, the termination condition listed here as
the last (c) is employed.
4.3 A concrete practical model building method
This section proposes Floating Adaptive Basis Function Construction (F-ABFC) – a concrete
practical polynomial regression model building method, which is a special case of the ABFC
approach.
The search procedure of the F-ABFC starts with the simplest model (with only the intercept
term included) and uses the Floating Search strategy (hence the name of the method), in
particular the Sequential Floating Forward Selection algorithm, SFFS (Pudil et al., 1994),
together with the set of the four state-transition operators proposed in the previous section.
In SFFS, the search process consists of two phases – the forward phase and the backward
phase. In each iteration of the search, the forward phase is done only once but the number of
times the backward phase is performed is determined dynamically. In the forward phase, all
the models, which can be generated using the complication operators on the current best
model, are evaluated and, if there is improvement over the current best model, the best of
the new models is chosen as the new current best model and the search proceeds to the
second phase. If there is no improvement, the whole search procedure is stopped. In the
backward phase, on the other hand, all the models, which can be generated using the
simplification operators on the current best model, are evaluated. In this phase ever simpler
models are repeatedly generated and the phase is ended only when, using the available
simplification operators, it is impossible to generate a model which is better than the current
best one. After the second phase, the search process always proceeds to the next iteration
(starting again with the first phase).
According to the studies of many researchers, the Floating Search algorithms, including
SFFS, are some of the most efficient heuristic search algorithms for deterministic
combinatorial optimization in terms of both required computational resources and quality
of the results (Ferri et al., 1994; Jain & Zongker, 1997; Jain et al., 2000; Zongker & Jain, 1996;
Pudil et al., 1994; Kudo & Sklansky, 2000; Reunanen, 2006). SFFS also does not have any
adjustable hyperparameters, has a tendency to generate simpler models than many other
algorithms, and is very simple to implement.
As in (Jekabsons & Lavendels, 2008a; Jekabsons, 2008), to evaluate the predictive
performance of a newly generated model, to perform model comparisons, and to steer the
www.intechopen.com
Adaptive Basis Function Construction: An Approach
for Adaptive Building of Sparse Polynomial Regression Models 135
many unnecessary basis functions, at the same time preventing truly necessary
modifications (this is also known as the nesting effect (Pudil et al., 1994)) and increasing
overfitting. Additionally, for all the state-transition operators a special care is taken to
prevent basis function duplicates in the resulting model as well as to preserve the intercept
term.
The initial state and the state-transition operators together form a state space. Figure 2
shows a small example of a state space in ABFC when the number of input variables is three
and all the four state-transition operators are used. Each state represents a set of basis
functions included in the regression model. The ordering of the states in the space is such
that the simplest models and the simplest basis functions are reached first and, as the search
goes on, increasingly complex models and basis functions can be reached.
Fig. 2. A small example of the first three layers of a state space in ABFC when d = 3 (the
space is infinite in the direction of more complex models)
In the Section 3, it is stated that in the subset selection approach the branching factor of a
state in the state space increases exponentially with respect to the number of input variables
d and pre-specified maximal degree p. In ABFC, the branching factor of the current state in
the state space depends on
d and on the number of basis functions k, already included in the
current model. The upper bound of the number of possible modifications to a model using
Operator1 is equal to d; using Operator2 and Operator3 it is equal to dk; and using
Operator4 it is equal to
k. So the upper bound of the branching factor is of order
)()2( dkOkdkdO
that is linear in respect to both d and k.
Search strategy. Most of the heuristic search algorithms of the hill-climbing type can be
divided in two categories: those that assume the model state-transition operators to be of
either or both the forward and the backward type (e.g., SFS, SBS, and Floating Search
algorithms) and those that do not distinguish between the two types (e.g., Steepest Descent
Hill-Climbing and Simulated Annealing). The four operators proposed in this study are
naturally divided in forward (complication) and backward (simplification) operators;
therefore in ABFC both categories of the search algorithms can be applied.
On the other hand, non-hill-climbing search algorithms, e.g., Genetic Algorithms and the
like, employ completely different kind of operators (i.e. Crossover and Mutation). While
they could be adapted to work with the infinite dictionary of basis functions, their major
disadvantage is that, in contrast to the simple hill-climbing algorithms, they are not
generally biased towards simpler models. In large state spaces they often spend most of the
time exploring too complex models while the “best” ones are in fact mostly the relatively
simple ones.
Evaluation measure. The proposed state-transition operators allow using the same methods
for model evaluation and comparison as those used in subset selection. However, note that
the model complexity penalization criteria, in contrast to the resampling techniques, usually
require substantially lower computational resources as well as are less noisy creating less
local minima in the state space.
Termination condition. Many different termination conditions can be used to terminate the
search process. Some of most widely used ones are the following: a) a user pre-specified
number of iterations is reached; b) a user pre-specified size of the model is reached; c) using
the available state-transition operators the model could not be improved any further
(evaluated by the chosen evaluation measure). The first two termination conditions require
the user to set a hyperparameter value. This is a non-trivial task as usually the required
information is not available. Adjusting such a hyperparameter may also require too large
amounts of computational resources. In this study, the termination condition listed here as
the last (c) is employed.
4.3 A concrete practical model building method
This section proposes Floating Adaptive Basis Function Construction (F-ABFC) – a concrete
practical polynomial regression model building method, which is a special case of the ABFC
approach.
The search procedure of the F-ABFC starts with the simplest model (with only the intercept
term included) and uses the Floating Search strategy (hence the name of the method), in
particular the Sequential Floating Forward Selection algorithm, SFFS (Pudil et al., 1994),
together with the set of the four state-transition operators proposed in the previous section.
In SFFS, the search process consists of two phases – the forward phase and the backward
phase. In each iteration of the search, the forward phase is done only once but the number of
times the backward phase is performed is determined dynamically. In the forward phase, all
the models, which can be generated using the complication operators on the current best
model, are evaluated and, if there is improvement over the current best model, the best of
the new models is chosen as the new current best model and the search proceeds to the
second phase. If there is no improvement, the whole search procedure is stopped. In the
backward phase, on the other hand, all the models, which can be generated using the
simplification operators on the current best model, are evaluated. In this phase ever simpler
models are repeatedly generated and the phase is ended only when, using the available
simplification operators, it is impossible to generate a model which is better than the current
best one. After the second phase, the search process always proceeds to the next iteration
(starting again with the first phase).
According to the studies of many researchers, the Floating Search algorithms, including
SFFS, are some of the most efficient heuristic search algorithms for deterministic
combinatorial optimization in terms of both required computational resources and quality
of the results (Ferri et al., 1994; Jain & Zongker, 1997; Jain et al., 2000; Zongker & Jain, 1996;
Pudil et al., 1994; Kudo & Sklansky, 2000; Reunanen, 2006). SFFS also does not have any
adjustable hyperparameters, has a tendency to generate simpler models than many other
algorithms, and is very simple to implement.
As in (Jekabsons & Lavendels, 2008a; Jekabsons, 2008), to evaluate the predictive
performance of a newly generated model, to perform model comparisons, and to steer the
www.intechopen.com
Machine Learning136
search in direction of the most promising models, in F-ABFC the Corrected Akaike’s
Information Criterion, AICC (Hurvich & Tsai, 1989) is used. AICC is defined as follows:
1
)1(2
2)ln(
kn
kk
kMSEnAICC
, (13)
where MSE is the Mean Squared Error of the model of interest in the training data. AICC
evaluates model’s predictive performance as a trade-off between its accuracy in the training
data (the first term of (13)) and its complexity (the last two terms of (13)). Calculation of the
AICC for a single model requires a single estimation of model’s parameters using OLS and
calculation of MSE in training data. The “best” model is that whose AICC value is the
lowest.
The AICC is an improvement over the classical AIC (Akaike, 1974) with the third term in
(13) added as a correction term intended for working with small-sized data sets. For
problems with relatively small
n, AICC is suited better than AIC but converges to AIC as n
becomes large (Hurvich & Tsai, 1989). AIC and AICC theoretical justification is based on the
relationship between the Kullback-Leibner information and the maximum likelihood
principle (Burnham & Anderson, 2002). Note that AIC as well as AICC does not assume that
the “true model” (which was presumably used to generate the data) is one of the candidates
(Burnham & Anderson, 2002).
In (Jekabsons & Lavendels, 2008b), an issue of the F-ABFC is stated, that, because the
branching factor of the ABFC’s state space increases very slowly together with
d and k, in
special cases when the data is of low dimensionality (e.g.,
4d ) and/or the existing
structure in the data is very complex (i.e. a very complex model is required) the search
algorithm may get stuck in a local minimum too early in the search returning a too simple
and underfitted model.
As a remedy for this, here an additional recursion of the state-transition operators is
proposed introducing one hyperparameter for the F-ABFC. The idea is to recursively create
additional regression models from models already created from the current best model
using the same state-transition operators with which they were initially created. This
essentially means that if, for example, the recursion depth is set to 2, Operator1 will create
not only linear basis functions but also basis functions of the second degree, Operator2 will
create not only copies of basis functions with degree increased by 1 but also by 2, and
Operator3 will not only try to decrease degrees by 1 but also by 2. However, as still none of
the operators add more than one basis function to the model at a time, for the Operator4 the
recursion is not used.
The recursion of the operators reduces the number of local minima in the state space which
is especially important near the starting-point of the search (the initial model) and enables
the search algorithm to find a much better model.
Presence of such a “recursion depth” hyperparameter is a disadvantage as now a user
intervention might be required. However, for larger dimensionalities of the input space
(when also the increased computational resources are required) it is reasonable to
completely disable the recursion (by setting the hyperparameter equal to 1) as with large
dimensionalities the branching factor increases sufficiently fast and the problem of too early
local minima diminishes.
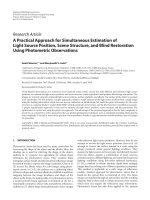
Figure 3 shows pseudo-code of F-ABFC’s search procedure. Note that in practical
implementations of F-ABFC maintaining the set of the newly generated models
(“MODELS”) is not required as a single model can be created, evaluated, and, if it turns out
not to be an improvement, immediately discarded.
BestModel the simplest model
BestModel.PerformOLSandCalculateAICC
loop
//forward phase
MODELS {all models created from BestModel using Operator1 and Operator2,
with no basis function redundancy}
if RecursionDepth > 1 then
for i 2 to RecursionDepth do
MODELS MODELS {all models created from MODELS using the same
operator (with which they were initially created}, with no basis function
redundancy}
foreach Model in MODELS do
Model.PerformOLSandCalculateAICC
TestModel best of MODELS according to AICC
if TestModel.AICC < BestModel.AICC then
BestModel TestModel
else
break //break the main loop (exit the procedure)
//backward phase
loop
MODELS {all models created from BestModel using Operator3 and Operator4,
with no basis function redundancy}
if RecursionDepth > 1 then
for i 2 to RecursionDepth do
MODELS MODELS {all models created from MODELS using Operator3
(with which they were initially created}, with no basis function redundancy}
foreach Model in MODELS do
Model.PerformOLSandCalculateAICC
TestModel best of MODELS according to AICC
if TestModel.AICC < BestModel.AICC then
BestModel TestModel
else
break //break the sub-loop
end loop
end loop
return BestModel
Fig. 3. Pseudo-code of F-ABFC’s search procedure
In (Jekabsons & Lavendels, 2008a), a version of F-ABFC was developed that slightly differs
from the one proposed here in that the method used one additional state-transition operator
and the “recursion depth” hyperparameter was not introduced. The paper (Jekabsons &
Lavendels, 2008a) empirically demonstrated the computational and predictive performance
advantages of F-ABFC comparing to subset selection and a number of other popular
regression modelling methods. F-ABFC advantages in real-world practical applications are
demonstrated in (Kalnins et al., 2008a; Kalnins et al., 2009b) where it is applied for
modelling bending and buckling behaviour of different composite material structures.
www.intechopen.com
Adaptive Basis Function Construction: An Approach
for Adaptive Building of Sparse Polynomial Regression Models 137
search in direction of the most promising models, in F-ABFC the Corrected Akaike’s
Information Criterion, AICC (Hurvich & Tsai, 1989) is used. AICC is defined as follows:
1
)1(2
2)ln(
kn
kk
kMSEnAICC
, (13)
where MSE is the Mean Squared Error of the model of interest in the training data. AICC
evaluates model’s predictive performance as a trade-off between its accuracy in the training
data (the first term of (13)) and its complexity (the last two terms of (13)). Calculation of the
AICC for a single model requires a single estimation of model’s parameters using OLS and
calculation of MSE in training data. The “best” model is that whose AICC value is the
lowest.
The AICC is an improvement over the classical AIC (Akaike, 1974) with the third term in
(13) added as a correction term intended for working with small-sized data sets. For
problems with relatively small
n, AICC is suited better than AIC but converges to AIC as n
becomes large (Hurvich & Tsai, 1989). AIC and AICC theoretical justification is based on the
relationship between the Kullback-Leibner information and the maximum likelihood
principle (Burnham & Anderson, 2002). Note that AIC as well as AICC does not assume that
the “true model” (which was presumably used to generate the data) is one of the candidates
(Burnham & Anderson, 2002).
In (Jekabsons & Lavendels, 2008b), an issue of the F-ABFC is stated, that, because the
branching factor of the ABFC’s state space increases very slowly together with
d and k, in
special cases when the data is of low dimensionality (e.g.,
4
d ) and/or the existing
structure in the data is very complex (i.e. a very complex model is required) the search
algorithm may get stuck in a local minimum too early in the search returning a too simple
and underfitted model.
As a remedy for this, here an additional recursion of the state-transition operators is
proposed introducing one hyperparameter for the F-ABFC. The idea is to recursively create
additional regression models from models already created from the current best model
using the same state-transition operators with which they were initially created. This
essentially means that if, for example, the recursion depth is set to 2, Operator1 will create
not only linear basis functions but also basis functions of the second degree, Operator2 will
create not only copies of basis functions with degree increased by 1 but also by 2, and
Operator3 will not only try to decrease degrees by 1 but also by 2. However, as still none of
the operators add more than one basis function to the model at a time, for the Operator4 the
recursion is not used.
The recursion of the operators reduces the number of local minima in the state space which
is especially important near the starting-point of the search (the initial model) and enables
the search algorithm to find a much better model.
Presence of such a “recursion depth” hyperparameter is a disadvantage as now a user
intervention might be required. However, for larger dimensionalities of the input space
(when also the increased computational resources are required) it is reasonable to
completely disable the recursion (by setting the hyperparameter equal to 1) as with large
dimensionalities the branching factor increases sufficiently fast and the problem of too early
local minima diminishes.
Figure 3 shows pseudo-code of F-ABFC’s search procedure. Note that in practical
implementations of F-ABFC maintaining the set of the newly generated models
(“MODELS”) is not required as a single model can be created, evaluated, and, if it turns out
not to be an improvement, immediately discarded.
BestModel the simplest model
BestModel.PerformOLSandCalculateAICC
loop
//forward phase
MODELS {all models created from BestModel using Operator1 and Operator2,
with no basis function redundancy}
if RecursionDepth > 1 then
for i 2 to RecursionDepth do
MODELS MODELS {all models created from MODELS using the same
operator (with which they were initially created}, with no basis function
redundancy}
foreach Model in MODELS do
Model.PerformOLSandCalculateAICC
TestModel best of MODELS according to AICC
if TestModel.AICC < BestModel.AICC then
BestModel TestModel
else
break //break the main loop (exit the procedure)
//backward phase
loop
MODELS {all models created from BestModel using Operator3 and Operator4,
with no basis function redundancy}
if RecursionDepth > 1 then
for i 2 to RecursionDepth do
MODELS MODELS {all models created from MODELS using Operator3
(with which they were initially created}, with no basis function redundancy}
foreach Model in MODELS do
Model.PerformOLSandCalculateAICC
TestModel best of MODELS according to AICC
if TestModel.AICC < BestModel.AICC then
BestModel TestModel
else
break //break the sub-loop
end loop
end loop
return BestModel
Fig. 3. Pseudo-code of F-ABFC’s search procedure
In (Jekabsons & Lavendels, 2008a), a version of F-ABFC was developed that slightly differs
from the one proposed here in that the method used one additional state-transition operator
and the “recursion depth” hyperparameter was not introduced. The paper (Jekabsons &
Lavendels, 2008a) empirically demonstrated the computational and predictive performance
advantages of F-ABFC comparing to subset selection and a number of other popular
regression modelling methods. F-ABFC advantages in real-world practical applications are
demonstrated in (Kalnins et al., 2008a; Kalnins et al., 2009b) where it is applied for
modelling bending and buckling behaviour of different composite material structures.
www.intechopen.com
Machine Learning138
4.4 Computational considerations
Assuming that the “best” model found by the F-ABFC search procedure includes a total of
k basis functions and in each iteration the number of basis functions in the current model is
increased by 1, the total number of evaluated models is of order
323
11
2
)1(
dkOdkdkO
kk
dkOidkOdiO
k
i
k
i
. (14)
Consequently, relatively to the typical subset selection methods, the efficiency of the
F-ABFC increases together with the increase in the number of input variables and in the
required nonlinearity of the model (the value of p) but decreases together with the increase
in the complexity
k of the “best” found model. Moreover, the relative efficiency of the
subset selection additionally substantially decreases in the common case when the required
value of
p is unknown and needs to be found by trying different values.
Using F-ABFC together with OLS, the associated linear least-squares fitting, required for a
single model to be evaluated, demand computations of order
)(
32
knkO , where
2
nk
operations are required for filling a
kk matrix and
3
k
operations are required for solving
a linear equation system (Hastie et al., 2003). However, none of the proposed state-transition
operators operate on more than one basis function of a model at a time meaning that, each
time the parameters of a newly created model are calculated, only one row and one column
of the kk matrix will change. Recalculating only the elements of the corresponding row
and column, reduces the order of the computations to
)(
3
knkO . Moreover, as the
Operator4 does not modify any basis function (only deletes one), the order of the
computations for this particular operator reduces further to
)(
3
kO .
Yet it must be noted that the F-ABFC can still become computationally rather demanding,
especially when the number of input variables and/or the number of samples in the training
data gets very large. This is the price to pay for the high flexibility of the method.
4.5 Convergence of the search process
The F-ABFC’s search algorithm is cycle-free because a new model is allocated to
“BestModel” (Figure 3) only if it is better than the old one (according to AICC). Moreover, as
the AICC criterion tries to estimate model’s true predictive performance, the algorithm will
seek for the best trade-off between too simple and too complex models and will stop
somewhere in-between them. Additionally there is also a hard bound – the number of basis
functions in a model will never exceed the number of samples in the training data as
otherwise the OLS cannot estimate model’s parameters.
It should also be noted that, although the state space of F-ABFC is infinite, in practice the
models of the best predictive performance are normally located in the part of the space that
is relatively near to the initial state where all the models (and their basis functions) are
relatively simple and do not yet neither overfit the data nor have basis functions more than
samples in the training data. This also means that really only a small finite fraction of the
whole infinite state space must be explored.
4.6 Selection bias, selection instability, and model averaging
There are two issues that to some extent plague all the methods of model building
(including subset selection and ABFC), especially when working with relatively little data –
selection bias and selection instability (also called selection variance). While the issues are
attributable to virtually any model building method, they are commonly ignored frequently
resulting in models of lower predictive performance.
Selection bias occurs when in the search procedure one uses the same data to compute
model’s parameters, to perform model building (i.e. evaluation of candidate models,
selection of the best one, and steering the search in direction of the most promising models),
and to select the final “best” model which will be returned as the result of the model
building process (Reunanen, 2003; Reunanen, 2006, Loughrey & Cunningham, 2004;
Jekabsons, 2008). The problem is that the more candidates are visited during the search, the
greater the likelihood of finding a model that has high accuracy in the training set while
having a very low predictive performance (accuracy in the test set) (Reunanen, 2003;
Reunanen, 2006; Kohavi & John, 1997; Loughrey & Cunningham, 2004). The random
fluctuations in the data will improve the evaluations of some models more than others.
The problem is relevant regardless of the model evaluation measure used – statistical
significance tests, complexity penalization criteria, or resampling techniques. In addition,
the selection bias occurs even when performing model evaluation using completely
independent validation data set (Kohavi & John, 1997; Reunanen, 2006). In any case, the
more intensive (relative to the number of samples) is the search process, the larger is the
selection bias, and, the larger is the noise in the data, the potentially larger is the harm (in
terms of overfitting) done by the selection bias.
While the deterministic search algorithms of the hill-climbing type (including the SFFS
algorithm of the F-ABFC) are usually less intensive and consequently more robust against
overfitting than, for example, Simulated Annealing or Genetic Algorithms (Loughrey &
Cunningham, 2004; Guyon & Elisseeff, 2003), the problem of selection bias remains relevant.
The second issue, selection instability, is related to the fact that small perturbations of the
data (deleting or adding samples, adding noise, rescaling the values) can lead the model
building process to vastly different models. This is because the large variability of estimates
of the evaluation methods can lead to different local minima (Breiman, 1996; Kotsiantis &
Pintelas, 2004; Guyon & Elisseeff, 2003; Cherkassky & Mulier, 2007). This variance is
undesirable because variance is often the symptom of a “bad” model that does not
generalize well and because the model may be failing to capture the “whole picture”
(Guyon & Elisseeff, 2003).
One of the ways to reduce both the selection bias and the selection instability, is to employ
model combining (also called model ensembling or averaging) techniques (Breiman, 1996;
Opitz & Maclin, 1999; Cherkassky & Mulier, 2007; Jekabsons, 2008). While a typical model
building process usually consists in choosing only one best description for the data
discarding the remainder, combining a number of models in some reasonable manner
appears more reliably accurate as this can have the effect of smoothing out erratic models
that overfit the data and gain more stability in the modelling process.
A typical model combination procedure consists of a two-stage process (Cherkassky &
Mulier, 2007). In the first stage, a number of different models are constructed. The
parameters of these models are then held fixed. In the second stage, these individual models
are linearly combined to produce the final model.
www.intechopen.com
Adaptive Basis Function Construction: An Approach
for Adaptive Building of Sparse Polynomial Regression Models 139
4.4 Computational considerations
Assuming that the “best” model found by the F-ABFC search procedure includes a total of
k basis functions and in each iteration the number of basis functions in the current model is
increased by 1, the total number of evaluated models is of order
323
11
2
)1(
dkOdkdkO
kk
dkOidkOdiO
k
i
k
i
. (14)
Consequently, relatively to the typical subset selection methods, the efficiency of the
F-ABFC increases together with the increase in the number of input variables and in the
required nonlinearity of the model (the value of p) but decreases together with the increase
in the complexity
k of the “best” found model. Moreover, the relative efficiency of the
subset selection additionally substantially decreases in the common case when the required
value of
p is unknown and needs to be found by trying different values.
Using F-ABFC together with OLS, the associated linear least-squares fitting, required for a
single model to be evaluated, demand computations of order
)(
32
knkO , where
2
nk
operations are required for filling a
kk
matrix and
3
k
operations are required for solving
a linear equation system (Hastie et al., 2003). However, none of the proposed state-transition
operators operate on more than one basis function of a model at a time meaning that, each
time the parameters of a newly created model are calculated, only one row and one column
of the kk matrix will change. Recalculating only the elements of the corresponding row
and column, reduces the order of the computations to
)(
3
knkO . Moreover, as the
Operator4 does not modify any basis function (only deletes one), the order of the
computations for this particular operator reduces further to
)(
3
kO .
Yet it must be noted that the F-ABFC can still become computationally rather demanding,
especially when the number of input variables and/or the number of samples in the training
data gets very large. This is the price to pay for the high flexibility of the method.
4.5 Convergence of the search process
The F-ABFC’s search algorithm is cycle-free because a new model is allocated to
“BestModel” (Figure 3) only if it is better than the old one (according to AICC). Moreover, as
the AICC criterion tries to estimate model’s true predictive performance, the algorithm will
seek for the best trade-off between too simple and too complex models and will stop
somewhere in-between them. Additionally there is also a hard bound – the number of basis
functions in a model will never exceed the number of samples in the training data as
otherwise the OLS cannot estimate model’s parameters.
It should also be noted that, although the state space of F-ABFC is infinite, in practice the
models of the best predictive performance are normally located in the part of the space that
is relatively near to the initial state where all the models (and their basis functions) are
relatively simple and do not yet neither overfit the data nor have basis functions more than
samples in the training data. This also means that really only a small finite fraction of the
whole infinite state space must be explored.
4.6 Selection bias, selection instability, and model averaging
There are two issues that to some extent plague all the methods of model building
(including subset selection and ABFC), especially when working with relatively little data –
selection bias and selection instability (also called selection variance). While the issues are
attributable to virtually any model building method, they are commonly ignored frequently
resulting in models of lower predictive performance.
Selection bias occurs when in the search procedure one uses the same data to compute
model’s parameters, to perform model building (i.e. evaluation of candidate models,
selection of the best one, and steering the search in direction of the most promising models),
and to select the final “best” model which will be returned as the result of the model
building process (Reunanen, 2003; Reunanen, 2006, Loughrey & Cunningham, 2004;
Jekabsons, 2008). The problem is that the more candidates are visited during the search, the
greater the likelihood of finding a model that has high accuracy in the training set while
having a very low predictive performance (accuracy in the test set) (Reunanen, 2003;
Reunanen, 2006; Kohavi & John, 1997; Loughrey & Cunningham, 2004). The random
fluctuations in the data will improve the evaluations of some models more than others.
The problem is relevant regardless of the model evaluation measure used – statistical
significance tests, complexity penalization criteria, or resampling techniques. In addition,
the selection bias occurs even when performing model evaluation using completely
independent validation data set (Kohavi & John, 1997; Reunanen, 2006). In any case, the
more intensive (relative to the number of samples) is the search process, the larger is the
selection bias, and, the larger is the noise in the data, the potentially larger is the harm (in
terms of overfitting) done by the selection bias.
While the deterministic search algorithms of the hill-climbing type (including the SFFS
algorithm of the F-ABFC) are usually less intensive and consequently more robust against
overfitting than, for example, Simulated Annealing or Genetic Algorithms (Loughrey &
Cunningham, 2004; Guyon & Elisseeff, 2003), the problem of selection bias remains relevant.
The second issue, selection instability, is related to the fact that small perturbations of the
data (deleting or adding samples, adding noise, rescaling the values) can lead the model
building process to vastly different models. This is because the large variability of estimates
of the evaluation methods can lead to different local minima (Breiman, 1996; Kotsiantis &
Pintelas, 2004; Guyon & Elisseeff, 2003; Cherkassky & Mulier, 2007). This variance is
undesirable because variance is often the symptom of a “bad” model that does not
generalize well and because the model may be failing to capture the “whole picture”
(Guyon & Elisseeff, 2003).
One of the ways to reduce both the selection bias and the selection instability, is to employ
model combining (also called model ensembling or averaging) techniques (Breiman, 1996;
Opitz & Maclin, 1999; Cherkassky & Mulier, 2007; Jekabsons, 2008). While a typical model
building process usually consists in choosing only one best description for the data
discarding the remainder, combining a number of models in some reasonable manner
appears more reliably accurate as this can have the effect of smoothing out erratic models
that overfit the data and gain more stability in the modelling process.
A typical model combination procedure consists of a two-stage process (Cherkassky &
Mulier, 2007). In the first stage, a number of different models are constructed. The
parameters of these models are then held fixed. In the second stage, these individual models
are linearly combined to produce the final model.
www.intechopen.com
Machine Learning140
Both stages can be done in different ways. In this study, to increase the predictive
performance of models built by the F-ABFC, a CV-type resampling of the training data
together with unweighted model averaging (Opitz & Maclin, 1999; Duin, 2002) is employed.
As this resampling and model averaging works on top of the F-ABFC, the method is called
Ensemble of Floating Adaptive Basis Function Construction (EF-ABFC). During resampling,
the whole training data is randomly divided into
v disjoint subsets (v typically being equal
to 10). Then v overlapping training data sets are constructed by dropping out a different one
of these v subsets. Such procedure is also employed to construct training sets for v-fold CV,
so model ensembles constructed in this way are also called cross-validated committees
(Parmanto et al., 1996).
Combining models via simple unweighted averaging requires them to be not too
underfitted as well as not too overfitted (Duin, 2002). To lower the overfitting, in each CV
iteration the unused 10th data subset is used as a validation data set for “re-evaluation”
(using MSE) of the best models of each F-ABFC iteration and for selection of the one “final
best” model from any iteration. Note that this validation set is never used for model
evaluation during the search. Instead it is used strictly only for the “re-evaluation” and
“re-selection” after the F-ABFC search process has already ended. Also note that as an
evaluation measure in the search algorithm still the AICC is applied. This “re-evaluation”
using the validation data set can detect whether the search process at some iteration may
have started to generate overfitted models and select a model of some earlier iteration that is
(hopefully) not (or at least less) overfitted (see Figure 4).
Fig. 4. An example of how a less overfitted model is selected using “re-evaluation” in
validation set. Note that here starting from the 35th iteration the AICC values also start to
increase (in contrast to the training error which always decreases) however this might be too
late due to selection bias
The so far described process produces
v models built by v independent F-ABFC runs each
using a different combination of CV-partitioned data subsets. Next, the v models from the v
CV iterations are combined using the unweighted model averaging. Note that prior to
combining, all the models are re-fitted to the whole training data set (without the CV
partitioning). This is done to compensate for the smaller training sets used during the
individual model building.
Model combining by unweighted model averaging consists in taking an unweighted
average of predictions of all the models:
v
i
icomb
F
v
F
1
1
, (15)
where
F
i
is ith individual model fro the ith CV iteration and F
comb
is the combined model. For
polynomial regression this simply means summation of all the polynomials and then a
division of all the parameters of
F
comb
(that is also a polynomial) by v. Note that the
parameter values of F
comb
will not necessarily be optimal in the sense of the least-squares loss
(in fact they will be optimal only in special cases, e.g., when all
F
i
’s are identical).
The employed model combining method is similar to Bagging (bootstrap aggregating
(Breiman, 1996)) where the training set is bootstrapped (usually to build varied decision
trees), and the unweighted average of the resulting models is taken.
Figure 5 gives an outline of the EF-ABFC model building process when the number of CV
folds
v is three. Note however that for all the practical applications of this study v = 10 is
used. This is because too small number of models in ensemble will yield too little diversity
hindering the models to correct each others errors, but, on the other hand, using too many
models will yield no further improvement (Breiman, 1996; Opitz & Maclin, 1999; Kotsiantis
& Pintelas, 2004; Parmanto et al., 1996). Moreover, too large number of CV folds can yield
unreliable validation MSE estimates for the selection of the individual final best models, as
then the individual validation sets may be too small.
Fig. 5. An outline of the EF-ABFC modelling process when
v = 3: (a) search for the best
model according to AICC using F-ABFC; (b) select the one final best model according to
MSE in validation data set; (c) ret-fit the model (recalculate its parameters) using the whole
training data; (d) combine the models
In recent literature, there is ever growing confidence that model ensembles often perform
better than individual models and consistently reduce prediction error (Breiman, 1996;
Opitz & Maclin, 1999; Kotsiantis & Pintelas, 2004; Jekabsons, 2008). However, model
ensembles are not always the best solutions (Kotsiantis & Pintelas, 2004): if there is too little
www.intechopen.com
Adaptive Basis Function Construction: An Approach
for Adaptive Building of Sparse Polynomial Regression Models 141
Both stages can be done in different ways. In this study, to increase the predictive
performance of models built by the F-ABFC, a CV-type resampling of the training data
together with unweighted model averaging (Opitz & Maclin, 1999; Duin, 2002) is employed.
As this resampling and model averaging works on top of the F-ABFC, the method is called
Ensemble of Floating Adaptive Basis Function Construction (EF-ABFC). During resampling,
the whole training data is randomly divided into
v disjoint subsets (v typically being equal
to 10). Then v overlapping training data sets are constructed by dropping out a different one
of these v subsets. Such procedure is also employed to construct training sets for v-fold CV,
so model ensembles constructed in this way are also called cross-validated committees
(Parmanto et al., 1996).
Combining models via simple unweighted averaging requires them to be not too
underfitted as well as not too overfitted (Duin, 2002). To lower the overfitting, in each CV
iteration the unused 10th data subset is used as a validation data set for “re-evaluation”
(using MSE) of the best models of each F-ABFC iteration and for selection of the one “final
best” model from any iteration. Note that this validation set is never used for model
evaluation during the search. Instead it is used strictly only for the “re-evaluation” and
“re-selection” after the F-ABFC search process has already ended. Also note that as an
evaluation measure in the search algorithm still the AICC is applied. This “re-evaluation”
using the validation data set can detect whether the search process at some iteration may
have started to generate overfitted models and select a model of some earlier iteration that is
(hopefully) not (or at least less) overfitted (see Figure 4).
Fig. 4. An example of how a less overfitted model is selected using “re-evaluation” in
validation set. Note that here starting from the 35th iteration the AICC values also start to
increase (in contrast to the training error which always decreases) however this might be too
late due to selection bias
The so far described process produces
v models built by v independent F-ABFC runs each
using a different combination of CV-partitioned data subsets. Next, the v models from the v
CV iterations are combined using the unweighted model averaging. Note that prior to
combining, all the models are re-fitted to the whole training data set (without the CV
partitioning). This is done to compensate for the smaller training sets used during the
individual model building.
Model combining by unweighted model averaging consists in taking an unweighted
average of predictions of all the models:
v
i
icomb
F
v
F
1
1
, (15)
where
F
i
is ith individual model fro the ith CV iteration and F
comb
is the combined model. For
polynomial regression this simply means summation of all the polynomials and then a
division of all the parameters of
F
comb
(that is also a polynomial) by v. Note that the
parameter values of F
comb
will not necessarily be optimal in the sense of the least-squares loss
(in fact they will be optimal only in special cases, e.g., when all
F
i
’s are identical).
The employed model combining method is similar to Bagging (bootstrap aggregating
(Breiman, 1996)) where the training set is bootstrapped (usually to build varied decision
trees), and the unweighted average of the resulting models is taken.
Figure 5 gives an outline of the EF-ABFC model building process when the number of CV
folds
v is three. Note however that for all the practical applications of this study v = 10 is
used. This is because too small number of models in ensemble will yield too little diversity
hindering the models to correct each others errors, but, on the other hand, using too many
models will yield no further improvement (Breiman, 1996; Opitz & Maclin, 1999; Kotsiantis
& Pintelas, 2004; Parmanto et al., 1996). Moreover, too large number of CV folds can yield
unreliable validation MSE estimates for the selection of the individual final best models, as
then the individual validation sets may be too small.
Fig. 5. An outline of the EF-ABFC modelling process when v = 3: (a) search for the best
model according to AICC using F-ABFC; (b) select the one final best model according to
MSE in validation data set; (c) ret-fit the model (recalculate its parameters) using the whole
training data; (d) combine the models
In recent literature, there is ever growing confidence that model ensembles often perform
better than individual models and consistently reduce prediction error (Breiman, 1996;
Opitz & Maclin, 1999; Kotsiantis & Pintelas, 2004; Jekabsons, 2008). However, model
ensembles are not always the best solutions (Kotsiantis & Pintelas, 2004): if there is too little
www.intechopen.com
Machine Learning142
data, the gains achieved via an ensemble may not compensate for the decrease in accuracy
of individual models, each of which now sees an even smaller training set. On the other end,
if the data set is sufficiently large, even a single flexible model can be quite adequate. Using
large data sets also substantially decreases potential selection bias, so superiority of
EF-ABFC over F-ABFC in such situations is expected to diminish.
The most significant disadvantage of the EF-ABFC compared to F-ABFC is that it requires
larger computational resources. However, the fact, that before the model combining the
v
models are built completely separately, allows for an easy parallelization of the process
dividing the execution time by
v. In this study however the parallelization is not done.
The paper (Jekabsons, 2008) empirically demonstrated the computational and predictive
performance advantages of EF-ABFC comparing to subset selection and a number of other
popular regression modelling methods. EF-ABFC advantages in real-world practical
applications are demonstrated in (Kalnins et al., 2008b; Kalnins et al., 2009a) where it is
applied for modelling bending and buckling behaviour of different composite material
structures.
4.7 Remarks
This section covers various aspects (extensions, limitations, etc.) of the ABFC not discussed
in the previous sections.
4.7.1 Incorporating domain knowledge
The ABFC methods attempt to model arbitrary dependencies in data with little or no
knowledge of the system under study. In problems of moderate and large dimensionality
the user usually is not required to tune any hyperparameters. However, if there is sufficient
additional domain knowledge outside the specific data at hand, it may be appropriate to
place some constraints on the final model. If the knowledge is fairly accurate, such
constraints can improve the accuracy while saving computational resources.
For example, the constraints might be one or more of the following: 1) limiting the maximal
degree of all the basis functions (similarly as in the subset selection), i.e.
pr
d
j
ij
1
0 for
all
i; 2) limiting the maximal value of exponents for each particular input variable in all the
basis functions, i.e.
jij
pr 0 for all i, where p
j
is maximal exponent of the jth variable;
3) restricting contributions of specific input variables that are not likely to interact with
others so that those variables can enter the model in basis functions only solely – with
exponents of all other variables fixed to zero. These constraints, as well as far more
sophisticated ones, can be easily incorporated in the ABFC. However, note that in all the
experiments described in this chapter no constraints are used.
4.7.2 Robustness
The ABFC methods described in this study estimate model parameters via minimization of
the squared-error loss, i.e. using OLS. However, while the squared-error loss is the most
commonly used, it is known that it looses its robustness against grossly outlying samples as
well as in very sparse high-dimensional data sets (Cherkassky & Ma, 2002).
One solution of this problem is to use a more robust loss function. The squared-error loss in
ABFC is not fundamental. Any other loss function can be used to estimate the parameters
and to evaluate the models by simply replacing the routine “PerformOLSandCalculate
AICC” of the search procedure (Figure 3) with a more robust one. Note that while this
would make the methods more robust, the computational advantage of OLS would be lost.
In any case, gross outliers (in output variable as well as input variables) that can be detected
through a preliminary data analysis should be considered for removal before applying
ABFC.
4.7.3 Other types of basis functions
The ABFC methods described in this study can generate regression models with basis
functions of only nonnegative integer exponents. However, in principle the exponents can
also be allowed to take negative or even fractional values. Appropriate adaptation of the
state-transition operators can enable generating such models. Keeping the same initial
model as before, the search now could go in direction of both positive and negative
exponents.
4.7.4 Integrating ABFC into other modelling methods
The result of running an ABFC procedure is a simple polynomial regression model. Such
models are also utilized as “sub-models” in a number of other regression modelling
methods. For example, the ABFC methods can be used in Polynomial Neural Networks
(usually induced by Group Method of Data Handling) (Nikolaev & Iba, 2006) for adaptation
of each individual neuron’s functional form and degree. The methods also can serve for
generation of local regression models in Locally-Weighted Regression (also called Moving
Least Squares) (Cleveland & Devlin, 1988; Kalnins et al., 2008b; Kalnins et al., 2005)
adaptively generating a model each time a query is received. ABFC can also induce
piecewise polynomial models for appropriately partitioned data sets.
The polynomial basis functions can also be viewed as nonlinear transformations (or
features) of the original input variables. In this manner the ABFC methods can also be
viewed as methods for automatic adaptive feature construction. For example, the
constructed features can further serve as inputs for Support Vector Machines (Vapnik, 1995;
Smola & Scholkopf, 2004) similarly to the features constructed using genetic algorithm in
(Ritthoff et al., 2002).
All these applications of ABFC can make the original methods more flexible and therefore, if
treated appropriately, produce models of higher predictive performance.
4.7.5 Using ABFC for solving classification problems
The ABFC methods can also be used for solving binary classification problems where the
output variable
y can take value of only either 0 or 1. This can be done, for example, by
constructing basis functions for logistic regression (also called maximum entropy classifier)
models. Logistic regression (Hastie et al., 2003; Witten & Frank, 2005) represents log odds of
y being equal to 1 as a linear model:
k
i
ii
xfaxFPP
1
)()()1(ln , (16)
www.intechopen.com
Adaptive Basis Function Construction: An Approach
for Adaptive Building of Sparse Polynomial Regression Models 143
data, the gains achieved via an ensemble may not compensate for the decrease in accuracy
of individual models, each of which now sees an even smaller training set. On the other end,
if the data set is sufficiently large, even a single flexible model can be quite adequate. Using
large data sets also substantially decreases potential selection bias, so superiority of
EF-ABFC over F-ABFC in such situations is expected to diminish.
The most significant disadvantage of the EF-ABFC compared to F-ABFC is that it requires
larger computational resources. However, the fact, that before the model combining the
v
models are built completely separately, allows for an easy parallelization of the process
dividing the execution time by
v. In this study however the parallelization is not done.
The paper (Jekabsons, 2008) empirically demonstrated the computational and predictive
performance advantages of EF-ABFC comparing to subset selection and a number of other
popular regression modelling methods. EF-ABFC advantages in real-world practical
applications are demonstrated in (Kalnins et al., 2008b; Kalnins et al., 2009a) where it is
applied for modelling bending and buckling behaviour of different composite material
structures.
4.7 Remarks
This section covers various aspects (extensions, limitations, etc.) of the ABFC not discussed
in the previous sections.
4.7.1 Incorporating domain knowledge
The ABFC methods attempt to model arbitrary dependencies in data with little or no
knowledge of the system under study. In problems of moderate and large dimensionality
the user usually is not required to tune any hyperparameters. However, if there is sufficient
additional domain knowledge outside the specific data at hand, it may be appropriate to
place some constraints on the final model. If the knowledge is fairly accurate, such
constraints can improve the accuracy while saving computational resources.
For example, the constraints might be one or more of the following: 1) limiting the maximal
degree of all the basis functions (similarly as in the subset selection), i.e.
pr
d
j
ij
1
0 for
all
i; 2) limiting the maximal value of exponents for each particular input variable in all the
basis functions, i.e.
jij
pr
0 for all i, where p
j
is maximal exponent of the jth variable;
3) restricting contributions of specific input variables that are not likely to interact with
others so that those variables can enter the model in basis functions only solely – with
exponents of all other variables fixed to zero. These constraints, as well as far more
sophisticated ones, can be easily incorporated in the ABFC. However, note that in all the
experiments described in this chapter no constraints are used.
4.7.2 Robustness
The ABFC methods described in this study estimate model parameters via minimization of
the squared-error loss, i.e. using OLS. However, while the squared-error loss is the most
commonly used, it is known that it looses its robustness against grossly outlying samples as
well as in very sparse high-dimensional data sets (Cherkassky & Ma, 2002).
One solution of this problem is to use a more robust loss function. The squared-error loss in
ABFC is not fundamental. Any other loss function can be used to estimate the parameters
and to evaluate the models by simply replacing the routine “PerformOLSandCalculate
AICC” of the search procedure (Figure 3) with a more robust one. Note that while this
would make the methods more robust, the computational advantage of OLS would be lost.
In any case, gross outliers (in output variable as well as input variables) that can be detected
through a preliminary data analysis should be considered for removal before applying
ABFC.
4.7.3 Other types of basis functions
The ABFC methods described in this study can generate regression models with basis
functions of only nonnegative integer exponents. However, in principle the exponents can
also be allowed to take negative or even fractional values. Appropriate adaptation of the
state-transition operators can enable generating such models. Keeping the same initial
model as before, the search now could go in direction of both positive and negative
exponents.
4.7.4 Integrating ABFC into other modelling methods
The result of running an ABFC procedure is a simple polynomial regression model. Such
models are also utilized as “sub-models” in a number of other regression modelling
methods. For example, the ABFC methods can be used in Polynomial Neural Networks
(usually induced by Group Method of Data Handling) (Nikolaev & Iba, 2006) for adaptation
of each individual neuron’s functional form and degree. The methods also can serve for
generation of local regression models in Locally-Weighted Regression (also called Moving
Least Squares) (Cleveland & Devlin, 1988; Kalnins et al., 2008b; Kalnins et al., 2005)
adaptively generating a model each time a query is received. ABFC can also induce
piecewise polynomial models for appropriately partitioned data sets.
The polynomial basis functions can also be viewed as nonlinear transformations (or
features) of the original input variables. In this manner the ABFC methods can also be
viewed as methods for automatic adaptive feature construction. For example, the
constructed features can further serve as inputs for Support Vector Machines (Vapnik, 1995;
Smola & Scholkopf, 2004) similarly to the features constructed using genetic algorithm in
(Ritthoff et al., 2002).
All these applications of ABFC can make the original methods more flexible and therefore, if
treated appropriately, produce models of higher predictive performance.
4.7.5 Using ABFC for solving classification problems
The ABFC methods can also be used for solving binary classification problems where the
output variable
y can take value of only either 0 or 1. This can be done, for example, by
constructing basis functions for logistic regression (also called maximum entropy classifier)
models. Logistic regression (Hastie et al., 2003; Witten & Frank, 2005) represents log odds of
y being equal to 1 as a linear model:
k
i
ii
xfaxFPP
1
)()()1(ln , (16)
www.intechopen.com
Machine Learning144
where P is the predicted probability of y being equal to 1. It is equivalent to the following
representation of P:
))(exp(11 xFP . (17)
The parameters a of the model are usually estimated by minimizing the deviance:
min))(1ln()1()(ln2
1
n
j
jjjj
FyFy xx
. (18)
Since there is no closed form solution to this minimization, the standard approach to solving
it is to use iterative algorithms such as Iteratively Re-weighted Least-Squares (Hastie et al.,
2003; Witten & Frank, 2005). Note that, in order to evaluate a model using AICC, the first
term of (13) is replaced by the deviance.
F-ABFC and EF-ABFC for classification problems are implemented in the VariClass software
tool freely available for non-commercial research and educational purposes at
5. Related work
There exist also other polynomial regression modelling methods which use wide, potentially
infinite, dictionaries of basis functions. In (Sutton & Matheus, 1991) an algorithm is
proposed which starts model building with a first-degree model, with all the input variables
already included in the model, and iteratively creates a user-predefined number of products
of the already included basis functions thereby creating new basis functions. In (Orosz &
Anderson, 1994) a modification of the algorithm is proposed where the initial model has
none of the input variables included, however there was no empirical success and it was
concluded that in practical applications the algorithms have three major disadvantages:
inability to construct all the necessary basis functions, inability to discard unnecessary basis
functions, and high sensitivity to noise and to number of samples in data.
More recently a different method was developed which can be seen also as a special case of
the ABFC approach – Constrained Induction of Polynomial Equations for Regression, CIPER
(Todorovski et al., 2004). CIPER was initially developed in the context of differential
equation discovery, inductive databases, and constraint-based data mining. CIPER uses two
state-transition operators and a Beam Search strategy. The first state-transition operator
adds a new linear basis function while the second increases a single exponent of a single
basis function. In (Jekabsons & Lavendels, 2008a), CIPER was empirically compared to
F-ABFC and it was concluded that CIPER suffers form the nesting effect (Pudil et al., 1994)
and has a tendency of getting stuck in local minima too early in the search. This is because
CIPER is not able to preserve the structure of any of included basis functions (its second
operator increases an exponent in an existing basis function but does not take into
consideration the possibility that both versions of the basis function may be required) as
well as because it is not able to simplify a model – decrease unnecessarily high exponents or
discard unnecessary basis functions. In F-ABFC these issues are solved using Operator2 and
the simplification operators.
Some similar ideas of constructing new features as combinations of original input variables
are applied also in different other approaches. For example, in (Ritthoff et al., 2002) a feature
construction method is proposed in which a genetic algorithm constructs linear and
nonlinear combinations of original input variables further used as inputs for Support Vector
Machines. In (Bloedorn & Michalski, 1998), on the other hand, the feature construction idea
is used for data-driven expansion of the input space for induction of decision rules and
decision trees.
6. Experiments
This section presents the results of comparisons of the proposed ABFC methods to the
methods of subset selection and to a number of other well known state-of-the-art regression
modelling methods using a series of synthetic and real-world regression data sets. The goal
is to gain some understanding of the properties of F-ABFC and EF-ABFC and to evaluate
their performance in both accuracy and speed. All the experiments were performed on a
Pentium IV 2.4GHz machine with 1.5GB RAM.
In all the experiments, predictive performance of a model is measured either using a
completely independent test data set or using Cross-Validation. In any case the performance
of a model is measured in terms of Relative Root Mean Squared Error:
tt
n
j
j
t
n
j
jj
t
yy
n
Fy
n
SDRMSERRMSE
1
2
1
2
1
)(
1
%100/%100 x
, (19)
where n
t
is the number of samples in the test data set, F(x
j
) is the predicted value
corresponding to the value of
y
j
, and
y
is the mean of all the y values in the test set. While
RMSE (Root Mean Square Error) represents model’s deviation from the data, the SD
(Standard Deviation) captures how irregular the problem is. The lower the value of RRMSE,
the more accurate is the model. The final RRMSE values stated are the values averaged over
all evaluations.
All the employed regression modelling methods, except Regression Trees, Model Trees,
Support Vector Machines, and Multi-Layer Perceptrons, are implemented in VariReg
software tool version 0.9.21 freely available for non-commercial research and educational
purposes at
6.1 Synthetic data sets
To compare the performance of the proposed ABFC methods against subset selection (as
well as against “full” polynomials with no subset selection) in different conditions of
signal-to-noise ratio (SNR) and training data size, here two test functions are used – Synth1
(4 input variables) and Synth2 (10 input variables):
)sin())sin(2exp(
32411
xxxxy
Synth
, (20)
1098765432
3
12
0001))(( xxxxxxxxxxy
Synth
. (21)
For Synth1 the values of x are uniformly distributed in the interval [-0.25, 0.25]. For Synth2
they are uniformly distributed in the interval [0, 1]. For each test function three training set
www.intechopen.com
Adaptive Basis Function Construction: An Approach
for Adaptive Building of Sparse Polynomial Regression Models 145
where P is the predicted probability of y being equal to 1. It is equivalent to the following
representation of P:
))(exp(11 xFP
. (17)
The parameters a of the model are usually estimated by minimizing the deviance:
min))(1ln()1()(ln2
1
n
j
jjjj
FyFy xx
. (18)
Since there is no closed form solution to this minimization, the standard approach to solving
it is to use iterative algorithms such as Iteratively Re-weighted Least-Squares (Hastie et al.,
2003; Witten & Frank, 2005). Note that, in order to evaluate a model using AICC, the first
term of (13) is replaced by the deviance.
F-ABFC and EF-ABFC for classification problems are implemented in the VariClass software
tool freely available for non-commercial research and educational purposes at
5. Related work
There exist also other polynomial regression modelling methods which use wide, potentially
infinite, dictionaries of basis functions. In (Sutton & Matheus, 1991) an algorithm is
proposed which starts model building with a first-degree model, with all the input variables
already included in the model, and iteratively creates a user-predefined number of products
of the already included basis functions thereby creating new basis functions. In (Orosz &
Anderson, 1994) a modification of the algorithm is proposed where the initial model has
none of the input variables included, however there was no empirical success and it was
concluded that in practical applications the algorithms have three major disadvantages:
inability to construct all the necessary basis functions, inability to discard unnecessary basis
functions, and high sensitivity to noise and to number of samples in data.
More recently a different method was developed which can be seen also as a special case of
the ABFC approach – Constrained Induction of Polynomial Equations for Regression, CIPER
(Todorovski et al., 2004). CIPER was initially developed in the context of differential
equation discovery, inductive databases, and constraint-based data mining. CIPER uses two
state-transition operators and a Beam Search strategy. The first state-transition operator
adds a new linear basis function while the second increases a single exponent of a single
basis function. In (Jekabsons & Lavendels, 2008a), CIPER was empirically compared to
F-ABFC and it was concluded that CIPER suffers form the nesting effect (Pudil et al., 1994)
and has a tendency of getting stuck in local minima too early in the search. This is because
CIPER is not able to preserve the structure of any of included basis functions (its second
operator increases an exponent in an existing basis function but does not take into
consideration the possibility that both versions of the basis function may be required) as
well as because it is not able to simplify a model – decrease unnecessarily high exponents or
discard unnecessary basis functions. In F-ABFC these issues are solved using Operator2 and
the simplification operators.
Some similar ideas of constructing new features as combinations of original input variables
are applied also in different other approaches. For example, in (Ritthoff et al., 2002) a feature
construction method is proposed in which a genetic algorithm constructs linear and
nonlinear combinations of original input variables further used as inputs for Support Vector
Machines. In (Bloedorn & Michalski, 1998), on the other hand, the feature construction idea
is used for data-driven expansion of the input space for induction of decision rules and
decision trees.
6. Experiments
This section presents the results of comparisons of the proposed ABFC methods to the
methods of subset selection and to a number of other well known state-of-the-art regression
modelling methods using a series of synthetic and real-world regression data sets. The goal
is to gain some understanding of the properties of F-ABFC and EF-ABFC and to evaluate
their performance in both accuracy and speed. All the experiments were performed on a
Pentium IV 2.4GHz machine with 1.5GB RAM.
In all the experiments, predictive performance of a model is measured either using a
completely independent test data set or using Cross-Validation. In any case the performance
of a model is measured in terms of Relative Root Mean Squared Error:
tt
n
j
j
t
n
j
jj
t
yy
n
Fy
n
SDRMSERRMSE
1
2
1
2
1
)(
1
%100/%100 x
, (19)
where n
t
is the number of samples in the test data set, F(x
j
) is the predicted value
corresponding to the value of
y
j
, and
y
is the mean of all the y values in the test set. While
RMSE (Root Mean Square Error) represents model’s deviation from the data, the SD
(Standard Deviation) captures how irregular the problem is. The lower the value of RRMSE,
the more accurate is the model. The final RRMSE values stated are the values averaged over
all evaluations.
All the employed regression modelling methods, except Regression Trees, Model Trees,
Support Vector Machines, and Multi-Layer Perceptrons, are implemented in VariReg
software tool version 0.9.21 freely available for non-commercial research and educational
purposes at
6.1 Synthetic data sets
To compare the performance of the proposed ABFC methods against subset selection (as
well as against “full” polynomials with no subset selection) in different conditions of
signal-to-noise ratio (SNR) and training data size, here two test functions are used – Synth1
(4 input variables) and Synth2 (10 input variables):
)sin())sin(2exp(
32411
xxxxy
Synth
, (20)
1098765432
3
12
0001))(( xxxxxxxxxxy
Synth
. (21)
For Synth1 the values of x are uniformly distributed in the interval [-0.25, 0.25]. For Synth2
they are uniformly distributed in the interval [0, 1]. For each test function three training set
www.intechopen.com
Machine Learning146
sizes (25 samples, 50 samples, and 100 samples) and three signal-to-noise ratios (no noise,
SNR = 4, and SNR = 2) are used – a total of nine cases for each function. For each case a series
of 20 training data sets are generated (randomly sampled in the domain of x) so that in each
case for each regression modelling method the model building task is performed 20 times.
For each test functions a single test data set is generated containing 5000 samples randomly
sampled in the domain of
x. The test data sets do not contain noise.
The heuristic search algorithms used for the subset selection are the SFS and the SFFS (the
same algorithm adaptation of which is used in the ABFC methods). The algorithms are used
together with the AICC criterion (also the same which is used in the ABFC methods). Note
that the “recursion depth” hyperparameter of F-ABFC is set equal to
2 for Synth1 and equal
to
1 (no recursion) for Synth2.
As for the full polynomials (FP) and the subset selection methods the desirable degree p is
not known beforehand, the modelling results of these methods are stated in two forms:
1) average performance of models of a fixed
p; 2) average performance when a range of
values for p are tried and the model of the lowest RRMSE value is picked. However, note
that this second type of procedure for FP/SFS/SFFS is rather optimistic (in the sense of both
predictive performance and speed) as for correct and fair evaluations there would be an
additional validation data set or a Cross-Validation loop required.
No noise
n = 25 n = 50 n = 100
Method RRMSE Time (s) RRMSE Time (s) RRMSE Time (s)
FP, p [1, 4]
9.29 (1.88) - 6.74 (0.55) - 0.78 (0.21) -
SFS, p = 2 7.17 (1.03)
< 0.1
6.38 (0.58)
< 0.1
5.63 (0.28) < 0.1
SFS, p = 6 0.77 (2.24)
0.3
0.06 (0.02)
1.4
0.04 (1e-2) 8.0
SFS, p = 10 3.19 (7.41)
1.8
0.03 (0.04)
16.1
2e-3 (7e-3) 104.3
SFS, p [1, 10]
0.77 (2.24)
4.4
0.03 (0.03)
34.1
2e-3 (7e-3) 226.1
SFFS, p [1, 10]
0.77 (2.24)
4.5
0.03 (0.03)
30.4
2e-4 (1e-4) 236.9
F-ABFC 0.11 (0.15)
0.1
0.01 (0.02)
2.0
3e-7 (5e-7) 43.8
EF-ABFC 0.27 (0.31)
0.8
0.02 (0.02)
11.5
1e-4 (4e-4) 250.6
SNR = 4
FP, p [1, 4]
42.71 (16.31)
-
18.36 (2.53)
-
12.12 (1.59) -
SFS, p = 2 24.24 (10.87)
< 0.1
15.62 (2.99)
< 0.1
10.64 (2.38) < 0.1
SFS, p = 6 59.37 (28.09) 0.1 41.37 (11.76) 0.3 25.60 (9.49) 0.8
SFS, p = 10 112.02 (149.28) 0.7 74.10 (40.38) 3.4 39.23 (10.92) 7.9
SFS, p [1, 10]
24.24 (10.87) 1.7 15.62 (2.99) 8.7 10.64 (2.38) 19.5
SFFS, p [1, 10]
24.24 (10.87)
1.8
15.62 (2.99)
7.6
10.64 (2.38) 21.0
F-ABFC 39.05 (17.97) < 0.1 33.13 (15.64) 0.1 22.64 (10.73) 0.3
EF-ABFC 20.24 (6.76) 0.3 13.65 (3.82) 0.8 9.08 (3.16) 2.1
SNR = 2
FP, p [1, 4]
79.40 (37.25)
-
35.97 (8.35)
-
21.79 (4.29) -
SFS, p = 2 36.35 (12.40) < 0.1 26.51 (9.87) < 0.1 18.55 (4.35) < 0.1
SFS, p = 6 88.32 (32.57)
0.1
70.34 (24.81)
0.3
47.11 (16.95) 1.0
SFS, p = 10 209.98 (213.00)
0.8
99.26 (40.07)
2.8
78.04 (31.78) 8.1
SFS, p [1, 10]
36.35 (12.40)
1.7
26.51 (9.87)
5.9
18.55 (4.35) 18.7
SFFS, p [1, 10]
36.35 (12.40)
1.7
26.64 (10.08)
6.3
18.55 (4.35) 19.5
F-ABFC 58.43 (19.72)
< 0.1
72.44 (62.43)
< 0.1
39.93 (19.91) 0.2
EF-ABFC 35.23 (11.04)
0.3
24.94 (6.18)
0.7
17.67 (4.45) 1.8
Table 1. The results of the performed experiments for function Synth1
The results of the performed experiments are summarized in Table 1 and Table 2 in terms of
mean RRMSE value, with its standard deviation reported in parenthesis, and elapsed time.
Note that, due to the space constraints, for fixed degrees only the results of
p {2, 6, 10} (for
Synth1),
p {2, 5} (for Synth2) are given. Detailed results are available at
Figure 6 and Figure 7 visualizes the performance changes of the methods for different
training set sizes and SNRs.
Fig. 6. Performance of the methods for function Synth1 for the different training set sizes
and SNRs: (a) no noise; (b)
SNR = 4 (solid lines) and SNR = 2 (dashed lines)
No noise n = 25 n = 50 n = 100
Method RRMSE Time (s) RRMSE Time (s) RRMSE Time (s)
FP, p [1, 2]
45.40 (4.86) - 38.73 (2.06) - 13.07 (1.37) -
SFS, p = 2 38.17 (13.99) < 0.1 19.13 (3.20) 0.2 11.27 (1.35) 1.0
SFS, p = 5 80.25 (23.80) 12.8 29.13 (12.73) 53.6 4.66 (2.79) 542.9
SFS, p [1, 5]
38.17 (13.99) 14.7 19.13 (3.20) 57.1 4.64 (0.88) 658.7
SFFS, p [1, 5]
37.40 (12.36) 15.9 20.20 (4.03) 82.5 4.01 (2.87) 680.4
F-ABFC 52.86 (11.46) < 0.1 13.14 (6.96) 0.7 1.59 (1.58) 16.5
EF-ABFC 56.39 (16.40) 0.3 12.92 (3.08) 4.2 0.95 (0.46) 98.7
SNR = 4
FP, p [1, 2]
51.78 (8.53) - 41.31 (3.25) - 37.38 (1.51) -
SFS, p = 2 58.85 (15.18) < 0.1 35.44 (7.05) 0.1 23.63 (4.02) 0.3
SFS, p = 5 180.68 (68.02) 10.7 82.78 (23.99) 66.0 62.00 (10.43) 258.7
SFS, p [1, 5]
58.85 (15.18) 13.1 35.44 (7.05) 77.8 23.63 (4.02) 298.8
SFFS, p [1, 5]
61.01 (17.19) 14.2 35.88 (8.69) 78.2 24.21 (3.57) 373.5
F-ABFC 79.07 (35.39) < 0.1 45.59 (9.28) 0.1 28.89 (7.25) 0.5
EF-ABFC 62.79 (11.47) 0.3 35.57 (7.35) 1.3 20.37 (3.51) 6.3
SNR = 2
FP, p [1, 2]
61.23 (9.17) - 46.61 (4.73) - 40.81 (3.12) -
SFS, p = 2 73.81 (17.63) < 0.1 51.69 (8.15) 0.1 37.20 (6.57) 0.2
SFS, p = 5 180.68 (68.02) 11.0 135.99 (37.13) 47.6 115.01 (31.12) 208.9
SFS, p [1, 5]
73.81 (17.63) 13.3 47.92 (6.96) 57.4 37.20 (6.57) 253.0
SFFS, p [1, 5]
76.43 (11.56) 14.3 50.41 (9.44) 64.3 35.15 (5.16) 369.3
F-ABFC 82.42 (18.79) < 0.1 68.08 (15.40) 0.1 49.61 (13.73) 0.3
EF-ABFC 70.84 (9.52) 0.2 51.11 (8.79) 0.8 34.54 (5.93) 3.9
Table 2. The results of the performed experiments for function Synth2
www.intechopen.com
Adaptive Basis Function Construction: An Approach
for Adaptive Building of Sparse Polynomial Regression Models 147
sizes (25 samples, 50 samples, and 100 samples) and three signal-to-noise ratios (no noise,
SNR = 4, and SNR = 2) are used – a total of nine cases for each function. For each case a series
of 20 training data sets are generated (randomly sampled in the domain of x) so that in each
case for each regression modelling method the model building task is performed 20 times.
For each test functions a single test data set is generated containing 5000 samples randomly
sampled in the domain of
x. The test data sets do not contain noise.
The heuristic search algorithms used for the subset selection are the SFS and the SFFS (the
same algorithm adaptation of which is used in the ABFC methods). The algorithms are used
together with the AICC criterion (also the same which is used in the ABFC methods). Note
that the “recursion depth” hyperparameter of F-ABFC is set equal to
2 for Synth1 and equal
to
1 (no recursion) for Synth2.
As for the full polynomials (FP) and the subset selection methods the desirable degree p is
not known beforehand, the modelling results of these methods are stated in two forms:
1) average performance of models of a fixed
p; 2) average performance when a range of
values for p are tried and the model of the lowest RRMSE value is picked. However, note
that this second type of procedure for FP/SFS/SFFS is rather optimistic (in the sense of both
predictive performance and speed) as for correct and fair evaluations there would be an
additional validation data set or a Cross-Validation loop required.
No noise
n = 25 n = 50 n = 100
Method RRMSE Time (s) RRMSE Time (s) RRMSE Time (s)
FP, p [1, 4]
9.29 (1.88)
-
6.74 (0.55)
-
0.78 (0.21) -
SFS, p = 2 7.17 (1.03)
< 0.1
6.38 (0.58)
< 0.1
5.63 (0.28) < 0.1
SFS, p = 6 0.77 (2.24)
0.3
0.06 (0.02)
1.4
0.04 (1e-2) 8.0
SFS, p = 10 3.19 (7.41)
1.8
0.03 (0.04)
16.1
2e-3 (7e-3) 104.3
SFS, p [1, 10]
0.77 (2.24)
4.4
0.03 (0.03)
34.1
2e-3 (7e-3) 226.1
SFFS, p [1, 10]
0.77 (2.24)
4.5
0.03 (0.03)
30.4
2e-4 (1e-4) 236.9
F-ABFC 0.11 (0.15)
0.1
0.01 (0.02)
2.0
3e-7 (5e-7) 43.8
EF-ABFC 0.27 (0.31)
0.8
0.02 (0.02)
11.5
1e-4 (4e-4) 250.6
SNR = 4
FP, p [1, 4]
42.71 (16.31)
-
18.36 (2.53)
-
12.12 (1.59) -
SFS, p = 2 24.24 (10.87)
< 0.1
15.62 (2.99)
< 0.1
10.64 (2.38) < 0.1
SFS, p = 6 59.37 (28.09)
0.1
41.37 (11.76)
0.3
25.60 (9.49) 0.8
SFS, p = 10 112.02 (149.28)
0.7
74.10 (40.38)
3.4
39.23 (10.92) 7.9
SFS, p [1, 10]
24.24 (10.87)
1.7
15.62 (2.99)
8.7
10.64 (2.38) 19.5
SFFS, p [1, 10]
24.24 (10.87)
1.8
15.62 (2.99)
7.6
10.64 (2.38) 21.0
F-ABFC 39.05 (17.97)
< 0.1
33.13 (15.64)
0.1
22.64 (10.73) 0.3
EF-ABFC 20.24 (6.76)
0.3
13.65 (3.82)
0.8
9.08 (3.16) 2.1
SNR = 2
FP, p [1, 4]
79.40 (37.25)
-
35.97 (8.35)
-
21.79 (4.29) -
SFS, p = 2 36.35 (12.40)
< 0.1
26.51 (9.87)
< 0.1
18.55 (4.35) < 0.1
SFS, p = 6 88.32 (32.57)
0.1
70.34 (24.81)
0.3
47.11 (16.95) 1.0
SFS, p = 10 209.98 (213.00)
0.8
99.26 (40.07)
2.8
78.04 (31.78) 8.1
SFS, p [1, 10]
36.35 (12.40)
1.7
26.51 (9.87)
5.9
18.55 (4.35) 18.7
SFFS, p [1, 10]
36.35 (12.40)
1.7
26.64 (10.08)
6.3
18.55 (4.35) 19.5
F-ABFC 58.43 (19.72)
< 0.1
72.44 (62.43)
< 0.1
39.93 (19.91) 0.2
EF-ABFC 35.23 (11.04)
0.3
24.94 (6.18)
0.7
17.67 (4.45) 1.8
Table 1. The results of the performed experiments for function Synth1
The results of the performed experiments are summarized in Table 1 and Table 2 in terms of
mean RRMSE value, with its standard deviation reported in parenthesis, and elapsed time.
Note that, due to the space constraints, for fixed degrees only the results of
p {2, 6, 10} (for
Synth1),
p {2, 5} (for Synth2) are given. Detailed results are available at
Figure 6 and Figure 7 visualizes the performance changes of the methods for different
training set sizes and SNRs.
Fig. 6. Performance of the methods for function Synth1 for the different training set sizes
and SNRs: (a) no noise; (b)
SNR = 4 (solid lines) and SNR = 2 (dashed lines)
No noise n = 25 n = 50 n = 100
Method RRMSE Time (s) RRMSE Time (s) RRMSE Time (s)
FP, p [1, 2]
45.40 (4.86) - 38.73 (2.06) - 13.07 (1.37) -
SFS, p = 2 38.17 (13.99) < 0.1 19.13 (3.20) 0.2 11.27 (1.35) 1.0
SFS, p = 5 80.25 (23.80) 12.8 29.13 (12.73) 53.6 4.66 (2.79) 542.9
SFS, p [1, 5]
38.17 (13.99) 14.7 19.13 (3.20) 57.1 4.64 (0.88) 658.7
SFFS, p [1, 5]
37.40 (12.36) 15.9 20.20 (4.03) 82.5 4.01 (2.87) 680.4
F-ABFC 52.86 (11.46) < 0.1 13.14 (6.96) 0.7 1.59 (1.58) 16.5
EF-ABFC 56.39 (16.40) 0.3 12.92 (3.08) 4.2 0.95 (0.46) 98.7
SNR = 4
FP, p [1, 2]
51.78 (8.53) - 41.31 (3.25) - 37.38 (1.51) -
SFS, p = 2 58.85 (15.18) < 0.1 35.44 (7.05) 0.1 23.63 (4.02) 0.3
SFS, p = 5 180.68 (68.02) 10.7 82.78 (23.99) 66.0 62.00 (10.43) 258.7
SFS, p [1, 5]
58.85 (15.18) 13.1 35.44 (7.05) 77.8 23.63 (4.02) 298.8
SFFS, p [1, 5]
61.01 (17.19) 14.2 35.88 (8.69) 78.2 24.21 (3.57) 373.5
F-ABFC 79.07 (35.39) < 0.1 45.59 (9.28) 0.1 28.89 (7.25) 0.5
EF-ABFC 62.79 (11.47) 0.3 35.57 (7.35) 1.3 20.37 (3.51) 6.3
SNR = 2
FP, p [1, 2]
61.23 (9.17) - 46.61 (4.73) - 40.81 (3.12) -
SFS, p = 2 73.81 (17.63) < 0.1 51.69 (8.15) 0.1 37.20 (6.57) 0.2
SFS, p = 5 180.68 (68.02) 11.0 135.99 (37.13) 47.6 115.01 (31.12) 208.9
SFS, p [1, 5]
73.81 (17.63) 13.3 47.92 (6.96) 57.4 37.20 (6.57) 253.0
SFFS, p [1, 5]
76.43 (11.56) 14.3 50.41 (9.44) 64.3 35.15 (5.16) 369.3
F-ABFC 82.42 (18.79) < 0.1 68.08 (15.40) 0.1 49.61 (13.73) 0.3
EF-ABFC 70.84 (9.52) 0.2 51.11 (8.79) 0.8 34.54 (5.93) 3.9
Table 2. The results of the performed experiments for function Synth2
www.intechopen.com
Machine Learning148
The results in Table 1 indicate that for noise-free data the F-ABFC outperforms its much
slower ensembled extension EF-ABFC while for noisy data it is vice versa. When the data
contains noise, the F-ABFC here can be outperformed even by full polynomials which
mostly give some of the worst performances. This suggests that for noisy data it is important
to curb the flexibility of F-ABFC – to use the EF-ABFC even when the data is sparse.
Fig. 7. Performance of the methods for function Synth2 for the different training set sizes
and SNRs: (a) no noise; (b) SNR = 4 (solid lines) and SNR = 2 (dashed lines)
The results in Table 2 partially confirm those in Table 1 except that this time the EF-ABFC is
always more accurate than F-ABFC which may be caused by the three irrelevant input
variables (pure noise) in the data on which the Synth2 does not depend. Additionally, as
now in the case of
n = 25 the data are very sparse, for this case the ABFC methods are just
too flexible – they largely overfit the data even when there is no additional noise.
Overall, the results for both Synth1 and Synth2 indicate the computational advantage of the
ABFC methods in situations when the required regression model is more complex (of higher
degree). And this advantage grows with the dimensionality of the problem.
For noisy data the best choice of
p for SFS/SFFS almost always was 2. Then the speed of a
single SFS/SFFS search can be outperformed only by F-ABFC. However, as the best
p value
is actually unknown and a number of values must be tried, F-ABFC as well as EF-ABFC is
still faster than the subset selection.
Finally, it must also be noted that the overall results show evidence that for subset selection
the choice of the search algorithm (either SFS or SFFS) was of no great importance. Therefore
further in this study only the SFS algorithm for subset selection is considered.
6.2 Real-world machine learning data sets
The real-world machine learning regression data sets used are: autoMPG (7 input variables,
392 samples), AutoPrice (15 input variables, 159 samples), Bodyfat (14 input variables, 252
samples), Fishcatch (7 input variables, 158 samples), Housing (13 input variables, 506
samples), HousingNOX (13 input variables, 506 samples), MachineCPU (6 input variables,
209 samples), Pyrimidines (27 input variables, 73 samples), Servo (4 input variables, 167
samples), and Stock (9 input variables, 950 samples). The data sets are from UCI Machine
Learning Repository ( Luis Torgo’s
data sets repository ( and
Weka collection of data sets ( They are chosen
because of the relatively low number of samples, which is common in real-world practical
applications, as well as because of mostly continuous input variables and no missing values.
Here the performances of the different regression modelling methods are evaluated using
10-fold Cross-Validation. Note that prior to dividing the data into Cross-Validation folds,
the order of the samples was randomized.
The goal of the performed experiments is to compare the proposed ABFC methods to the
methods of subset selection and to other well known state-of-the-art regression modelling
methods using a set of real-world regression data sets. The compared methods are the
following: FP, SFS, F-ABFC, EF-ABFC, Multivariate Adaptive Regression Splines (MARS)
(Friedman, 1993), M5' Regression Trees (RT) (Witten & Frank, 2005), M5' Model Trees (MT)
(Witten & Frank, 2005), Support Vector Machines (SVM) (Vapnik, 1995; Smola & Scholkopf,
2004), and Multi-Layer Perceptrons (Witten & Frank, 2005). Note that for none of the
methods any of the hyperparameters were manually tuned. MARS was that of
piecewise-cubic type essentially without special limitation of the number of basis functions
(i.e. the limit was 500) and with the smoothing parameter (the number of degrees of freedom
associated with one basis function) either fixed to the default value of
3 or found using an
additional 10-fold Cross-Validation from the range [1, 5] with step size 0.5. SVM used Radial
Basis Function kernel and improved Sequential Minimal Optimization algorithm (Shevade
et al., 1999) for which the complexity parameter and the gamma parameter were found
using grid search and Cross-Validation from the range
{10
-1
, 10
0
, 10
1
, 10
2
} for the complexity
parameter and {10
-2
, 10
-1
, 10
0
, 10
1
} for the gamma parameter. MLP had one hidden layer
with the “best” number of neurons determined by 10-fold Cross-Validation from the range
{10, 20, 30, 40} and the weights were optimized using backpropagation. As implementations
of RT, MT, SVM, and MLP the Weka software (Witten & Frank, 2005) was employed with its
default parameters. Also note that for the ABFC methods the recursion of the state-transition
operators was never used.
The results of the performed experiments are summarized in Table 3 in terms of mean
RRMSE value, with the standard deviation reported in parenthesis, and elapsed time. Here
the modelling results of SFS are stated in the same two forms as in Section 6.1 except that for
the different data sets (different in size, in number of input variables, and in required model
complexity) the values of
p are tried in different intervals (named “p = automatic”) – the
search for the best
p is started with the first degree and p is increased as long as the RRMSE
value improves. The results of FP are not stated, as due to matrix singularity in OLS for
Pyrimidines data set the parameter values of FP models could not be calculated. Also note
that, due to the space constraints, only the results averaged over all the data sets are given.
Detailed results are available at
From the results of the experiments it is concluded that in terms of predictive performance,
the EF-ABFC outperformed all the other regression modelling methods involving
polynomials as well as showed high competitiveness against the other “non-polynomial”
methods. In terms of computational cost, both ABFC methods outperformed subset selection
but were inferior to some of the “non-polynomial” methods, especially RT, MT, and MARS
without CV.
www.intechopen.com
Adaptive Basis Function Construction: An Approach
for Adaptive Building of Sparse Polynomial Regression Models 149
The results in Table 1 indicate that for noise-free data the F-ABFC outperforms its much
slower ensembled extension EF-ABFC while for noisy data it is vice versa. When the data
contains noise, the F-ABFC here can be outperformed even by full polynomials which
mostly give some of the worst performances. This suggests that for noisy data it is important
to curb the flexibility of F-ABFC – to use the EF-ABFC even when the data is sparse.
Fig. 7. Performance of the methods for function Synth2 for the different training set sizes
and SNRs: (a) no noise; (b)
SNR = 4 (solid lines) and SNR = 2 (dashed lines)
The results in Table 2 partially confirm those in Table 1 except that this time the EF-ABFC is
always more accurate than F-ABFC which may be caused by the three irrelevant input
variables (pure noise) in the data on which the Synth2 does not depend. Additionally, as
now in the case of
n = 25 the data are very sparse, for this case the ABFC methods are just
too flexible – they largely overfit the data even when there is no additional noise.
Overall, the results for both Synth1 and Synth2 indicate the computational advantage of the
ABFC methods in situations when the required regression model is more complex (of higher
degree). And this advantage grows with the dimensionality of the problem.
For noisy data the best choice of
p for SFS/SFFS almost always was 2. Then the speed of a
single SFS/SFFS search can be outperformed only by F-ABFC. However, as the best
p value
is actually unknown and a number of values must be tried, F-ABFC as well as EF-ABFC is
still faster than the subset selection.
Finally, it must also be noted that the overall results show evidence that for subset selection
the choice of the search algorithm (either SFS or SFFS) was of no great importance. Therefore
further in this study only the SFS algorithm for subset selection is considered.
6.2 Real-world machine learning data sets
The real-world machine learning regression data sets used are: autoMPG (7 input variables,
392 samples), AutoPrice (15 input variables, 159 samples), Bodyfat (14 input variables, 252
samples), Fishcatch (7 input variables, 158 samples), Housing (13 input variables, 506
samples), HousingNOX (13 input variables, 506 samples), MachineCPU (6 input variables,
209 samples), Pyrimidines (27 input variables, 73 samples), Servo (4 input variables, 167
samples), and Stock (9 input variables, 950 samples). The data sets are from UCI Machine
Learning Repository ( Luis Torgo’s
data sets repository ( and
Weka collection of data sets ( They are chosen
because of the relatively low number of samples, which is common in real-world practical
applications, as well as because of mostly continuous input variables and no missing values.
Here the performances of the different regression modelling methods are evaluated using
10-fold Cross-Validation. Note that prior to dividing the data into Cross-Validation folds,
the order of the samples was randomized.
The goal of the performed experiments is to compare the proposed ABFC methods to the
methods of subset selection and to other well known state-of-the-art regression modelling
methods using a set of real-world regression data sets. The compared methods are the
following: FP, SFS, F-ABFC, EF-ABFC, Multivariate Adaptive Regression Splines (MARS)
(Friedman, 1993), M5' Regression Trees (RT) (Witten & Frank, 2005), M5' Model Trees (MT)
(Witten & Frank, 2005), Support Vector Machines (SVM) (Vapnik, 1995; Smola & Scholkopf,
2004), and Multi-Layer Perceptrons (Witten & Frank, 2005). Note that for none of the
methods any of the hyperparameters were manually tuned. MARS was that of
piecewise-cubic type essentially without special limitation of the number of basis functions
(i.e. the limit was 500) and with the smoothing parameter (the number of degrees of freedom
associated with one basis function) either fixed to the default value of
3 or found using an
additional 10-fold Cross-Validation from the range [1, 5] with step size 0.5. SVM used Radial
Basis Function kernel and improved Sequential Minimal Optimization algorithm (Shevade
et al., 1999) for which the complexity parameter and the gamma parameter were found
using grid search and Cross-Validation from the range
{10
-1
, 10
0
, 10
1
, 10
2
} for the complexity
parameter and {10
-2
, 10
-1
, 10
0
, 10
1
} for the gamma parameter. MLP had one hidden layer
with the “best” number of neurons determined by 10-fold Cross-Validation from the range
{10, 20, 30, 40} and the weights were optimized using backpropagation. As implementations
of RT, MT, SVM, and MLP the Weka software (Witten & Frank, 2005) was employed with its
default parameters. Also note that for the ABFC methods the recursion of the state-transition
operators was never used.
The results of the performed experiments are summarized in Table 3 in terms of mean
RRMSE value, with the standard deviation reported in parenthesis, and elapsed time. Here
the modelling results of SFS are stated in the same two forms as in Section 6.1 except that for
the different data sets (different in size, in number of input variables, and in required model
complexity) the values of
p are tried in different intervals (named “p = automatic”) – the
search for the best
p is started with the first degree and p is increased as long as the RRMSE
value improves. The results of FP are not stated, as due to matrix singularity in OLS for
Pyrimidines data set the parameter values of FP models could not be calculated. Also note
that, due to the space constraints, only the results averaged over all the data sets are given.
Detailed results are available at
From the results of the experiments it is concluded that in terms of predictive performance,
the EF-ABFC outperformed all the other regression modelling methods involving
polynomials as well as showed high competitiveness against the other “non-polynomial”
methods. In terms of computational cost, both ABFC methods outperformed subset selection
but were inferior to some of the “non-polynomial” methods, especially RT, MT, and MARS
without CV.
www.intechopen.com
Machine Learning150
Method RRMSE Time (s)
SFS, p = 1 49.64 (12.05) < 0.1
SFS, p = 2 40.89 (15.11) 4.8
SFS, p = 3 37.83 (15.70) 227.4
SFS, p = 4 47.10 (29.17) 2486.8
SFS, p = automatic 34.83 (10.20) 2207.5
F-ABFC 39.61 (16.93) 108.7
EF-ABFC 31.24 (10.86) 607.8
RT 50.76 (9.85) 0.3
MT 34.79 (12.35) 0.4
MARS 40.81 (17.29) 3.2
MARS + CV 39.87 (15.57) 265.8
SVM 31.87 (10.73) 360.5
MLP 41.50 (18.04) 345.2
Table 3. The average results of the performed experiments for the ten machine learning data
sets
Fig. 8. RRMSE values of the six best methods for the ten data sets
For the different data sets, the best found degree
p for SFS with “p = automatic” varied in
range
[1, 6] (with the average value of 3.0), meaning that the maximal checked value of p
was 7 (though for only one of the data sets). However, the average degree of models
constructed by F-ABFC and EF-ABFC was 6.4 and 7.2 correspondingly. If on average for SFS
such large values of
p would be tried (instead of only 3.0), the SFS would take considerably
more time (orders of magnitude) to complete.
6.3 Real-world metamodelling data sets
In many different industrial applications, to cut down the computational cost of complex,
high fidelity scientific and engineering simulations, regression models (in the context also
referred to as metamodels or surrogate models) are constructed that mimic the behaviour of
the simulation models as closely as possible while being computationally much cheaper to
employ (Myers & Montgomery, 2002; Chen et al., 2006; Martin & Simpson, 2005; Kalnins et
al., 2008b; Kalnins et al., 2008a, Kalnins et al., 2009a; Kalnins et al., 2009b). The process of
design optimization involving metamodelling usually comprises three major steps which
may be interleaved iteratively: 1) selection of samples (known as design of experiments);
2) construction of metamodel and estimation of its predictive performance; 3) employment
of the metamodel in design optimization (i.e., finding the best values for input variables
with which the studied system achieves the optimum response), design space exploration,
what-if analysis, sensitivity analysis, and other routine tasks.
The metamodelling problem addressed here is modelling of the behaviour of “I-core”
all-metal laser-welded sandwich panels under bending load for further design optimization
and analysis in application as deck panels in a modularised watercraft concept (Kalnins et
al., 2008a). The problem has six input variables and four output variables. The data are
generated using finite element simulations and contains 500 samples distributed in the input
space using sequential experimental design (Auzins, 2004).
Originally, metamodelling was associated with low-degree (usually quadratic) polynomial
models. They have been well accepted in engineering practice, as they require only little
data and are computationally very efficient. However, it is understood that they are loosing
efficiency when highly nonlinear behaviour should be approximated.
In this section the compared regression modelling methods are the same as in the Section 6.2
with an addition of three methods which are rather popular in metamodelling literature:
Locally-Weighted Polynomials (LWP) (Cleveland & Devlin, 1988; Kalnins et al., 2008b;
Kalnins et al., 2005), Radial Basis Functions (RBF) (Gutmann, 2001), and Kriging (Martin &
Simpson, 2005, Lophaven et al., 2002). Note again that for none of the methods any of the
hyperparameters were manually tuned. LWP used the Gaussian weight function with the
value of the bandwidth parameter found by Leave-One-Out Cross-Validation. Note that the
LWP has a similar issue of degree
p selection as FP and SFS, so here a number of different
degrees are tried in the interval
[1, 4]. RBF used the multi-quadric basis functions with the
shape parameter fixed to 1. Kriging used first-degree polynomial as a trend function and
employed the Gaussian correlation function. Note that the used source code for the Kriging
technique was developed by (Lophaven et al., 2002). Also note that for the ABFC methods in
the performed experiments the recursion of the state-transition operators was never used.
The results of the performed experiments are summarized in Table 4 in terms of mean
RRMSE value, with its standard deviation reported in parenthesis, and elapsed time. Here
the performances of the different regression modelling methods are evaluated using 5-fold
Cross-Validation. The modelling results of FP and SFS are stated in the same two forms as in
Section 6.1. Note that, due to the space constraints, only the results averaged over all the
data sets are given. Detailed results (as well as the utilized data sets) are available at
The results in Table 4 indicate that with the four metamodelling data sets (all of which are
essentially noise-free) the ensembling of F-ABFC models was not necessary – the accuracy
advantage of EF-ABFC is negligible while it is computationally about ten times slower than
simple F-ABFC. However, both F-ABFC and EF-ABFC outperformed subset selection in
terms of predictive performance as well as in terms of speed. In respect to the other methods
the ABFC approach once again is highly competitive, especially the faster F-ABFC method.
With the metamodelling data sets, on average the best degree
p for SFS was 6.3 while the
average degree of models constructed by F-ABFC and EF-ABFC was 9.2 and 7.9
correspondingly. Similarly to the conclusions of the previous section, trying these larger
values of
p for SFS would take orders of magnitude more time to complete.
www.intechopen.com
Adaptive Basis Function Construction: An Approach
for Adaptive Building of Sparse Polynomial Regression Models 151
Method RRMSE Time (s)
SFS, p = 1 49.64 (12.05) < 0.1
SFS, p = 2 40.89 (15.11) 4.8
SFS, p = 3 37.83 (15.70) 227.4
SFS, p = 4 47.10 (29.17) 2486.8
SFS, p = automatic 34.83 (10.20) 2207.5
F-ABFC 39.61 (16.93) 108.7
EF-ABFC 31.24 (10.86) 607.8
RT 50.76 (9.85) 0.3
MT 34.79 (12.35) 0.4
MARS 40.81 (17.29) 3.2
MARS + CV 39.87 (15.57) 265.8
SVM 31.87 (10.73) 360.5
MLP 41.50 (18.04) 345.2
Table 3. The average results of the performed experiments for the ten machine learning data
sets
Fig. 8. RRMSE values of the six best methods for the ten data sets
For the different data sets, the best found degree
p for SFS with “p = automatic” varied in
range
[1, 6] (with the average value of 3.0), meaning that the maximal checked value of p
was 7 (though for only one of the data sets). However, the average degree of models
constructed by F-ABFC and EF-ABFC was 6.4 and 7.2 correspondingly. If on average for SFS
such large values of
p would be tried (instead of only 3.0), the SFS would take considerably
more time (orders of magnitude) to complete.
6.3 Real-world metamodelling data sets
In many different industrial applications, to cut down the computational cost of complex,
high fidelity scientific and engineering simulations, regression models (in the context also
referred to as metamodels or surrogate models) are constructed that mimic the behaviour of
the simulation models as closely as possible while being computationally much cheaper to
employ (Myers & Montgomery, 2002; Chen et al., 2006; Martin & Simpson, 2005; Kalnins et
al., 2008b; Kalnins et al., 2008a, Kalnins et al., 2009a; Kalnins et al., 2009b). The process of
design optimization involving metamodelling usually comprises three major steps which
may be interleaved iteratively: 1) selection of samples (known as design of experiments);
2) construction of metamodel and estimation of its predictive performance; 3) employment
of the metamodel in design optimization (i.e., finding the best values for input variables
with which the studied system achieves the optimum response), design space exploration,
what-if analysis, sensitivity analysis, and other routine tasks.
The metamodelling problem addressed here is modelling of the behaviour of “I-core”
all-metal laser-welded sandwich panels under bending load for further design optimization
and analysis in application as deck panels in a modularised watercraft concept (Kalnins et
al., 2008a). The problem has six input variables and four output variables. The data are
generated using finite element simulations and contains 500 samples distributed in the input
space using sequential experimental design (Auzins, 2004).
Originally, metamodelling was associated with low-degree (usually quadratic) polynomial
models. They have been well accepted in engineering practice, as they require only little
data and are computationally very efficient. However, it is understood that they are loosing
efficiency when highly nonlinear behaviour should be approximated.
In this section the compared regression modelling methods are the same as in the Section 6.2
with an addition of three methods which are rather popular in metamodelling literature:
Locally-Weighted Polynomials (LWP) (Cleveland & Devlin, 1988; Kalnins et al., 2008b;
Kalnins et al., 2005), Radial Basis Functions (RBF) (Gutmann, 2001), and Kriging (Martin &
Simpson, 2005, Lophaven et al., 2002). Note again that for none of the methods any of the
hyperparameters were manually tuned. LWP used the Gaussian weight function with the
value of the bandwidth parameter found by Leave-One-Out Cross-Validation. Note that the
LWP has a similar issue of degree
p selection as FP and SFS, so here a number of different
degrees are tried in the interval
[1, 4]. RBF used the multi-quadric basis functions with the
shape parameter fixed to 1. Kriging used first-degree polynomial as a trend function and
employed the Gaussian correlation function. Note that the used source code for the Kriging
technique was developed by (Lophaven et al., 2002). Also note that for the ABFC methods in
the performed experiments the recursion of the state-transition operators was never used.
The results of the performed experiments are summarized in Table 4 in terms of mean
RRMSE value, with its standard deviation reported in parenthesis, and elapsed time. Here
the performances of the different regression modelling methods are evaluated using 5-fold
Cross-Validation. The modelling results of FP and SFS are stated in the same two forms as in
Section 6.1. Note that, due to the space constraints, only the results averaged over all the
data sets are given. Detailed results (as well as the utilized data sets) are available at
The results in Table 4 indicate that with the four metamodelling data sets (all of which are
essentially noise-free) the ensembling of F-ABFC models was not necessary – the accuracy
advantage of EF-ABFC is negligible while it is computationally about ten times slower than
simple F-ABFC. However, both F-ABFC and EF-ABFC outperformed subset selection in
terms of predictive performance as well as in terms of speed. In respect to the other methods
the ABFC approach once again is highly competitive, especially the faster F-ABFC method.
With the metamodelling data sets, on average the best degree
p for SFS was 6.3 while the
average degree of models constructed by F-ABFC and EF-ABFC was 9.2 and 7.9
correspondingly. Similarly to the conclusions of the previous section, trying these larger
values of
p for SFS would take orders of magnitude more time to complete.
www.intechopen.com