Luận văn : KHẢO SÁT ẢNH HƯỞNG CỦA NHIỆT ĐỘ VÀ THỜI GIAN SƠ CHẾ, XỬ LÝ ĐẾN CHẤT LƯỢNG CÁ TRA PHI LÊ CẤP ĐÔNG TẠI XNCBTSXK CATACO part 10 pps
Bạn đang xem bản rút gọn của tài liệu. Xem và tải ngay bản đầy đủ của tài liệu tại đây (231.16 KB, 6 trang )
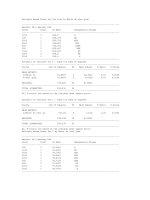
Multiple Range Tests for Cau truc by Nhiet do thoi gian
Method: 95,0 percent LSD
Level Count LS Mean Homogeneous Groups
1015 3 500,0 X
105 3 620,333 XX
2010 3 659,333 XXX
2015 3 693,667 XXX
205 3 734,333 XXXX
305 3 832,667 XXX
1010 3 856,667 XX
3010 3 858,0 XX
3015 3 918,0 X
Analysis of Variance for L - Type III Sums of Squares
Source Sum of Squares Df Mean Square F-Ratio P-Value
MAIN EFFECTS
A:Nhiet do 45,8859 2 22,9429 2,61 0,0960
B:Thoi gian 16,0656 2 8,0328 0,91 0,4155
RESIDUAL 193,286 22 8,78574
TOTAL (CORRECTED) 255,238 26
All F-ratios are based on the residual mean square error.
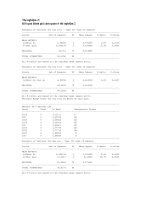
Analysis of Variance for L - Type III Sums of Squares
Source Sum of Squares Df Mean Square F-Ratio P-Value
MAIN EFFECTS
A:Nhiet do thoi gi 107,04 8 13,38 1,63 0,1864
RESIDUAL 148,198 18 8,23322
TOTAL (CORRECTED) 255,238 26
All F-ratios are based on the residual mean square error.
Multiple Range Tests for L by Nhiet do thoi gian
Method: 95,0 percent LSD
Level Count LS Mean Homogeneous Groups
105 3 52,0667 X
1015 3 53,4667 XX
2015 3 54,7067 XXX
3010 3 55,5667 XXX
1010 3 56,4633 XXX
305 3 56,7233 XXX
205 3 57,2367 XX
3015 3 57,5433 XX
2010 3 58,7433 X
Analysis of Variance for a - Type III Sums of Squares
Source Sum of Squares Df Mean Square F-Ratio P-Value
MAIN EFFECTS
A:Nhiet do 0,782807 2 0,391404 1,53 0,2395
B:Thoi gian 0,480207 2 0,240104 0,94 0,4072
RESIDUAL 5,64219 22 0,256463
TOTAL (CORRECTED) 6,90521 26
All F-ratios are based on the residual mean square error.
Analysis of Variance for a - Type III Sums of Squares
Source Sum of Squares Df Mean Square F-Ratio P-Value
MAIN EFFECTS
A:Nhiet do thoi gi 1,89187 8 0,236484 0,85 0,5738
RESIDUAL 5,01333 18 0,278519
TOTAL (CORRECTED) 6,90521 26
All F-ratios are based on the residual mean square error.
Multiple Range Tests for a by Nhiet do thoi gian
Method: 95,0 percent LSD
Level Count LS Mean Homogeneous Groups
2010 3 0,403333 X
3015 3 0,45 X
2015 3 0,563333 X
3010 3 0,57 X
205 3 0,696667 X
1015 3 0,82 X
105 3 0,946667 X
1010 3 1,14 X
305 3 1,14333 X
Analysis of Variance for b - Type III Sums of Squares
Source Sum of Squares Df Mean Square F-Ratio P-Value
MAIN EFFECTS
A:Nhiet do 2,09347 2 1,04674 0,33 0,7250
B:Thoi gian 5,28987 2 2,64494 0,82 0,4516
RESIDUAL 70,5755 22 3,20798
TOTAL (CORRECTED) 77,9588 26
All F-ratios are based on the residual mean square error.
Analysis of Variance for b - Type III Sums of Squares
Source Sum of Squares Df Mean Square F-Ratio P-Value
MAIN EFFECTS
A:Nhiet do thoi gi 12,5599 8 1,56998 0,43 0,8864
RESIDUAL 65,3989 18 3,63327
TOTAL (CORRECTED) 77,9588 26
All F-ratios are based on the residual mean square error.
Multiple Range Tests for b by Nhiet do thoi gian
Method: 95,0 percent LSD
Level Count LS Mean Homogeneous Groups
2010 3 -3,77667 X
205 3 -2,54667 X
1010 3 -2,40333 X
3010 3 -2,24333 X
3015 3 -2,13 X
1015 3 -2,05333 X
305 3 -1,60333 X
105 3 -1,47667 X
2015 3 -1,40333 X
Thí nghiệm 4:
Kết quả đánh giá cảm quan của của thí nghiệm 4
ANOVA Table for Cau truc by Thoi gian
Analysis of Variance
Source Sum of Squares Df Mean Square F-Ratio P-Value
Between groups 0,666667 2 0,333333 0,84 0,4479
Within groups 7,14286 18 0,396825
Total (Corr.) 7,80952 20
Multiple Range Tests for Cau truc by Thoi gian
Method: 95,0 percent LSD
Thoi gian Count Mean Homogeneous Groups
30 7 4,0 X
20 7 4,28571 X
10 7 4,42857 X
ANOVA Table for Mau sac by Thoi gian
Analysis of Variance
Source Sum of Squares Df Mean Square F-Ratio P-Value
Between groups 0,857143 2 0,428571 1,08 0,3606
Within groups 7,14286 18 0,396825
Total (Corr.) 8,0 20
Multiple Range Tests for Mau sac by Thoi gian
Method: 95,0 percent LSD
Thoi gian Count Mean Homogeneous Groups
20 7 3,71429 X
30 7 4,14286 X
10 7 4,14286 X
ANOVA Table for Mui by Thoi gian
Analysis of Variance
Source Sum of Squares Df Mean Square F-Ratio P-Value
Between groups 0,285714 2 0,142857 0,64 0,5374
Within groups 4,0 18 0,222222
Total (Corr.) 4,28571 20
Multiple Range Tests for Mui by Thoi gian
Method: 95,0 percent LSD
Thoi gian Count Mean Homogeneous Groups
30 7 4,14286 X
20 7 4,28571 X
10 7 4,42857 X
ANOVA Table for Vi by Thoi gian
Analysis of Variance
Source Sum of Squares Df Mean Square F-Ratio P-Value
Between groups 0,0952381 2 0,047619 0,18 0,8397
Within groups 4,85714 18 0,269841
Total (Corr.) 4,95238 20
Multiple Range Tests for Vi by Thoi gian
Method: 95,0 percent LSD
Thoi gian Count Mean Homogeneous Groups
20 7 4,28571 X
30 7 4,42857 X
10 7 4,42857 X
Kết quả đo cấu trúc và màu sắc của sản phẩm ở thí nghiệm 4
ANOVA Table for Cau truc by Thoi gian
Analysis of Variance
Source Sum of Squares Df Mean Square F-Ratio P-Value
Between groups 54424,7 2 27212,3 2,86 0,1341
Within groups 57071,3 6 9511,89
Total (Corr.) 111496,0 8
Multiple Range Tests for Cau truc by Thoi gian
Method: 95,0 percent LSD
Thoi gian Count Mean Homogeneous Groups
30 3 198,667 X
20 3 287,333 X
10 3 389,0 X
ANOVA Table for L by Thoi gian
Analysis of Variance
Source Sum of Squares Df Mean Square F-Ratio P-Value
Between groups 3,90249 2 1,95124 0,15 0,8674
Within groups 80,3502 6 13,3917
Total (Corr.) 84,2527 8
Multiple Range Tests for L by Thoi gian
Method: 95,0 percent LSD
Thoi gian Count Mean Homogeneous Groups
30 3 54,5767 X
10 3 55,2567 X
20 3 56,1833 X
ANOVA Table for a by Thoi gian
Analysis of Variance
Source Sum of Squares Df Mean Square F-Ratio P-Value
Between groups 0,480289 2 0,240144 0,42 0,6746
Within groups 3,4252 6 0,570867
Total (Corr.) 3,90549 8
Multiple Range Tests for a by Thoi gian
Method: 95,0 percent LSD
Thoi gian Count Mean Homogeneous Groups
20 3 -0,963333 X
10 3 -0,526667 X
30 3 -0,433333 X
ANOVA Table for b by Thoi gian
Analysis of Variance
Source Sum of Squares Df Mean Square F-Ratio P-Value
Between groups 7,65816 2 3,82908 16,79 0,0035
Within groups 1,3682 6 0,228033
Total (Corr.) 9,02636 8
Multiple Range Tests for b by Thoi gian
Method: 95,0 percent LSD
Thoi gian Count Mean Homogeneous Groups
20 3 -3,79333 X
30 3 -2,21667 X
10 3 -1,60333 X

