Luận văn : ẢNH HƯỞNG CỦA MỘT SỐ NHÂN TỐ SINH THÁI ĐẾN CÂY HỌ SAO - DẦU (Dipterocarpaceae) TRONG KIỂU RỪNG KÍN THƯỜNG XANH VÀ NỬA RỤNG LÁ ẨM NHIỆT ĐỚI Ở ĐỒNG NAI part 10 pps
Bạn đang xem bản rút gọn của tài liệu. Xem và tải ngay bản đầy đủ của tài liệu tại đây (1.96 MB, 17 trang )
Forestry.tk Phạm Văn Hường
Analysis of Deviance
Percentage of
deviance explained by model = 31,6958
Adjusted percentage = 29,8234
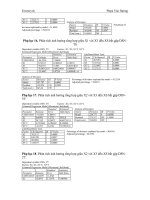
Phụ lục 16. Phân tích ảnh hưởng tổng hợp giữa X1 với X3 đến XS bắt gặp DSN-
TS
Dependent variable: DSN_TT Factors: X1; X3; X1^2; X3^2
Estimated Regression Model (Maximum Likelihood)
Likelihood Ratio Tests
Factor
Chi
-
Squared
Df
P
-
Value
X1 20,5981 1 0,0000
X3 15,7322 1 0,0001
X1^2 22,0407 1 0,0000
X3^2 12,7152 1 0,0004
Analysis of Deviance
Percentage of deviance explained by model = 43,5254
Adjusted percentage = 39,4873
Phụ lục 17. Phân tích ảnh hưởng tổng hợp giữa X2 với X3 đến XS bắt gặp DSN-
TT
Dependent variable: DSN_TS Factors: X2; X3; X2^2; X3^2
Estimated Regression Model (Maximum Likelihood)
Analysis of Deviance
Source
Deviance
Df
P
-
Value
Model 258,777 4 0,0000
Residual 275,317 395 1,0000
Total (corr.) 534,093 399
Likelihood Ratio Tests
Percentage of deviance explained by model = 48,4516
Adjusted percentage = 46,5792
Phụ lục 18. Phân tích ảnh hưởng tổng hợp giữa X2 với X3 đến XS bắt gặp DSN-
TT
Dependent variable: DSN_TT
Factors: X2; X3; X2^2; X3^2
Estimated Regression Model (Maximum Likelihood)
X1^2 34,2131 1 0,0000
X3^2 23,7024 1 0,0000
Source
Deviance
Df
P
-
Value
Model 169,285 4 0,0000
Residual 364,808 395 0,8597
Total (corr.) 534,093 399
Standard
Estimated
Paramet
er
Estimate
Error
Odds Ratio
CONSTANT -44,5326 7,59009
X1 0,74353 0,184824 2,10335
X3 50,4355 13,883 8,01454E21
X1^2 -0,00512637 0,00124016 0,994887
X3^2 -30,4443 9,07261 6,00069E-14
Source
Deviance
Df
P
-
Value
Model 107,787 4 0,0000
Residual 139,854 195 0,9989
Total (corr.) 247,64 199
Standard
Estimated
Parameter
Estima
te
Error
Odds Ratio
CONSTANT
-31,8202 4,00338
X2 8,60491 1,2753 5458,4
X3 26,7152 9,24571 4,00171E11
X2^2 -0,787668 0,104602 0,454904
X3^2 -16,472 6,2161 7,01921E-8
Factor
Chi
-
Squared
Df
P
-
Value
X2 70,2115 1 0,0000
X3 8,41708 1 0,0037
X2^2 90,0004 1 0,0000
X3^2 7,04319 1 0,0080
Standard
Estimated
Parameter
Estimate
Error
Odds Ratio
CONSTANT
-60,8879 11,6743
X2 15,8875 3,72578 7,9404E6
Forestry.tk Phạm Văn Hường
Analysis of Deviance
Source
Deviance
Df
P
-
Value
Model 139,971 4 0,0000
Residual 107,669 195 1,0000
Total (corr.) 247,64 199
Likelihood Ratio Tests
Percentage of deviance explained by model = 56,5221
Adjusted percentage = 52,484
Phụ lục 19. Phân tích ảnh hưởng tổng hợp của X1 – X2 và X3 đến xác suất bắt
gặp Dầu song nàng tái sinh
ependent variable: DSN_TS Factors: X1; X2; X3; X1^2; X2^2; X3^2
Estimated Regression Model (Maximum Likelihood)
Likelihood Ratio Tests
Factor
Chi
-
Squared
Df
P
-
Value
X1 0,0574541 1 0,8106
X2 50,5297 1 0,0000
X3 7,74889 1 0,0054
X1^2 0,103761 1 0,7474
X2^2 63,5615 1 0,0000
X3^2 6,32067 1 0,0119
Analysis of Deviance
Percentage of deviance explained by model = 48,52
Adjusted percentage = 45,8987
Phụ lục 20. Phân tích ảnh hưởng tổng hợp của X1 – X2 và X3 đến xác suất bắt
gặp dầu song nàng trưởng thành
Dependent variable: DSN_TT Factors: X1; X2; X3; X1^2; X2^2; X3^2
Estimated Regression Model (Maximum Likelihood)
Likelihood Ratio Tests
Factor
Chi
-
Squared
Df
P
-
Value
X1 2,27224 1 0,1317
X2 29,8269 1 0,0000
X3 5,23838 1 0,0221
X1^2 2,26769 1 0,1321
X2^2 32,8073 1 0,0000
X3^2 3,83103 1 0,0503
Analysis of Deviance
Percentage of deviance explained by model = 57,444
Adjusted percentage = 51,7906
X3 37,4852 16,4716 1,90379E16
X2^2 -1,30471 0,289498 0,27125
X3^2 -21,4649 10,5962 4,7635E-10
Factor
Chi
-
Squared
Df
P
-
Value
X2 44,1864 1 0,0000
X3 5,64615 1 0,0175
X2^2 49,2363 1 0,0000
X3^2 4,34404 1 0,0371
Standard
Estimated
Parameter
Estimate
Error
Odds Ratio
CONSTANT
-32,409 4,38699
X1 0,0277026 0,115631 1,02809
X2 8,54988 1,42575 5166,13
X3 26,2218 9,46249 2,44339E11
X1^2 -0,000253465 0,000787439
0,999747
X2^2 -0,776861 0,116603 0,459847
X3^2 -15,9573 6,35498 1,1744E-7
Source
Deviance
Df
P
-
Value
Model 259,142 6 0,0000
Residual 274,951 393 1,0000
Total (corr.) 534,093 399
Standard
Estimated
Parameter
Estimate
Error
Odds Ratio
CONSTANT
-65,0182 12,1548
X1 0,312245 0,209061 1,36649
X2 13,8111 3,84817 995636,
X3 35,416 15,9165 2,40412E15
X1^2 -0,0021112 0,00141949 0,997891
X2^2 -1,13585 0,295925 0,32115
X3^2 -20,0359 10,3903 1,98849E-9
Source
Deviance
Df
P
-
Value
Model 142,254 6 0,0000
Residual 105,386 193 1,0000
Total (corr.) 247,64 199
Forestry.tk Phạm Văn Hường
Phụ lục 21. Phân tích ảnh hưởng tương tác của 2 biến X1*X3 đến xác suất bắt gặp
dầu song nàng trưởng thành
Dependent variable: DSN_TT Factors: X1; X3
Estimated Regression Model (Maximum Likelihood)
Likelihood Ratio Tests
Factor
Chi
-
Squared
Df
P
-
Valu
e
X1 22,84 1 0,0000
X3 12,1119 1 0,0005
X1^2 20,0221 1 0,0000
X1*X3 2,97509 1 0,0846
X3^2 14,6699 1 0,0001
Analysis of Deviance
Percentage of deviance explained by model = 44,7268
Adjusted percentage = 39,8811
Phụ lục 22. Phân tích ảnh hưởng tổng hợp giữa X1 – X2 đến xác suất bắt gặp Dầu
con rái tái sinh
Dependent variable: DCR-TS Factors: X1; X2; X1^2; X2^2
Estimated Regression Model (Maximum Likelihood)
Likelihood Ratio Tests
Factor
Chi
-
Squared
Df
P
-
Value
X1 0,0511127 1 0,8211
X2 75,429 1 0,0000
X1^2 0,548777 1 0,4588
X2^2 97,9315 1 0,0000
Analysis of Deviance
Percentage of deviance explained by model = 46,4834
Adjusted percentage = 44,6774
Phụ lục 23. Phân tích ảnh hưởng tổng hợp giữa X1 – X2 đến xác suất bắt gặp dầu
con rái trưởng thành
Dependent variable: DCR-TT Factors: X1; X2; X1^2; X2^2
Estimated Regression Model (Maximum Likelihood)
Standard
Estimated
Parameter
Estimate
Error
O
dds Ratio
CONSTANT
-44,8326 7,77679
X1 0,812276 0,194012 2,25303
X3 45,9393 14,4342 8,93659E19
X1^2 -0,00723394
0,00180384 0,992792
X1*X3 0,313101 0,183523 1,36766
X3^2 -42,7506 11,9015 2,7142E-19
Source
Deviance
Df
P
-
Value
Model 110,762 5 0,0000
Residual 136,879 194 0,9993
Total (corr.) 247,64 199
Standard
Estimated
Parameter
Estimate
Error
Odds Ratio
CONSTANT -24,9058 3,45454
X1 -0,0240663 0,106454 0,976221
X2 10,2346 1,48012 27849,0
X1^2 0,000562836
0,000760653
1,00056
X2^2 -1,02557 0,137793 0,358591
Source
Deviance
Df
P
-
Value
Model 257,382 4 0,0000
Residual 296,326 395 0,9999
Total (corr.) 553,707 399
Standard
Estimated
Parameter
Estimate
Error
Odds Ratio
CONSTANT
-31,8327 6,10332
X1 0,176853 0,166146 1,19346
Forestry.tk Phạm Văn Hường
Likelihood Ratio Tests
Factor
Chi
-
Squared
Df
P
-
Value
X1 1,14746 1 0,2841
X2 35,1115 1 0,0000
X1^2 0,602417 1 0,4377
X2^2 42,9221 1 0,0000
Analysis of Deviance
Percentage of deviance explained by model = 49,0787
Adjusted percentage = 45,2355
Phụ lục 24. Phân tích ảnh hưởng tổng hợp giữa X1 – X3 đến xác suất bắt gặp dầu
con rái tái sinh
Dependent variable: DCR-TS Factors: X1; X3; X1^2; X3^2
Estimated Regression Model (Maximum Likelihood)
Likelihood Ratio Tests
Factor
Chi
-
Squared
Df
P
-
Value
X1 28,676 1 0,0000
X3 11,4936 1 0,0007
X1^2 32,7617 1 0,0000
X3^2 12,346 1 0,0004
Analysis of Deviance
Percentage of deviance explained by model = 21,0071
Adjusted percentage = 19,201
Phụ lục 25. Phân tích ảnh hưởng tổng hợp giữa X1 – X3 đến xác suất bắt gặp dầu
con rái trưởng thành
Dependent variable: DCR –TT Factors: X1; X3; X1^2; X3^2
Estimated Regression Model (Maximum Likelihood)
Likelihood Ratio Tests
Factor
Chi
-
Squared
Df
P
-
Value
X1 26,5924 1 0,0000
X3 3,21872 1 0,0728
X1^2 28,1062 1 0,0000
X3^2 3,24745 1 0,0715
Analysis of Deviance
Percentage of deviance explained by model = 29,6395
Adjusted percentage = 25,7962
Phụ lục 26. Phân tích ảnh hưởng tổng hợp giữa X2 – X3 đến xác suất bắt gặp dầu
con rái tái sinh
Dependent variable: DCR1 Factors: X2; X3; X2^2; X3^2
Estimated Regression Model (Maximum Likelihood)
X2 9,54399 2,04199 13960,5
X1^2 -0,000893447 0,00115376 0,999107
X2^2 -0,867417 0,16868 0,420035
Source
Deviance
Df
P
-
Value
Model 127,7 4 0,0000
Residual 132,494 195 0,9998
Total (corr.) 260,195 199
Standard
Estimated
Parameter
Estimate
Error
Odds Ratio
CONSTANT -22,3234 2,96231
X1 0,433202 0,0857693 1,54219
X3 24,107 7,20501 2,94799E10
X1^2 -0,00310047
0,000575943 0,996904
X3^2 -16,6253 4,80186 6,02151E-8
Source
Deviance
Df
P
-
Value
Model 116,318 4 0,0000
Residual 437,39 395 0,0693
Total (corr.) 553,707 399
Standard
Estimated
Parameter
Estimate
Error
Odds Ratio
CONSTANT -28,8546 5,07931
X1 0,65521 0,144886 1,92555
X3 19,9047 10,998 4,41044E8
X1^2 -0,00451551
0,00096919 0,995495
X3^2 -13,245 7,30628 0,00000176915
Source
Deviance
Df
P
-
Value
Model 77,1203 4 0,0000
Residual 183,074 195 0,7200
Total (corr.) 260,195 199
Standard
Estimated
Parameter
Estimate
Error
Odds Ratio
CONSTANT -26,6816 3,54481
Forestry.tk Phạm Văn Hường
Likelihood Ratio Tests
Factor
Chi
-
Squared
Df
P
-
Value
X2 74,0558 1 0,0000
X3 1,65264 1 0,1986
X2^2 97,0752 1 0,0000
X3^2 1,19434 1 0,2745
Analysis of Deviance
Percentage of deviance explained by model = 44,5711
Adjusted percentage = 42,7651
Phụ lục 27. Phân tích ảnh hưởng tổng hợp giữa X2 – X3 đến xác suất bắt gặp dầu
con rái trưởng thành
Dependent variable: DCR-TT Factors: X2; X3; X2^2; X3^2
Estimated Regression Model (Maximum Likelihood)
Likelihood Ratio Tests
Factor
Chi
-
Squared
Df
P
-
Value
X2 50,454 1 0,0000
X3 0,0479002 1 0,8268
X2^2 60,0072 1 0,0000
X3^2 0,00854127 1 0,9264
Analysis of Deviance
Percentage of deviance explained by model = 47,5675
Adjusted percentage = 43,7243
Phụ lục 28. Phân tích ảnh hưởng tổng hợp giữa X1, X2, và X3 đến xác suất bắt
gặp dầu con rái tái sinh
Dependent variable: DCR1 Factors: X1; X2; X3; X1^2; X2^2; X3^2
Estimated Regression Model (Maximum Likelihood)
Likelihood Ratio Tests
Factor
Chi
-
Squared
Df
P
-
Value
X1 0,26375 1 0,6076
X2 55,2721 1 0,0000
X3 2,00994 1 0,1563
X1^2 1,05997 1 0,3032
X2^2 75,4375 1 0,0000
X3^2 2,08 1 0,1492
Analysis of Deviance
Percentage of deviance explained by model = 46,86
Adjusted percentage = 44,3315
Phụ lục 29. Phân tích ảnh hưởng tổng hợp giữa X1, X2, và X3 đến XS bắt gặp DCR-TT
Dependent variable: (DCR—TT) Factors: X1; X2; X3; X1^2; X2^2; X3^2
Estimated Regression Model (Maximum Likelihood)
X2 9,10968 1,33513 9042,36
X3 11,8431 9,1422 139118,
X2^2 -0,884858 0,119115 0,412773
X3^2 -6,84527 6,2237 0,00106448
Source
Deviance
Df
P
-
Value
Model 246,793 4 0,0000
Residual 306,914 395 0,9996
Total (corr.) 553,707 399
Standard
Estimated
Parameter
Estimate
Error
Odds Ratio
CONSTANT
-30,4758 6,02948
X2 10,8706 2,18984 52607,5
X3 2,95166 13,4256 19,1377
X2^2 -0,949312 0,175425 0,387007
X3^2 -0,829033 8,95532 0,436471
Source
Deviance
Df
P
-
Value
Model 123,768 4 0,0000
Residual 136,427 195 0,9995
Total (corr.) 260,195 199
Standard
Estimated
Parameter
Estimate
Error
Odds Ratio
CONSTANT
-26,5634 3,78682
X1 -0,0570921 0,111134 0,944507
X2 9,56678 1,52861 14282,3
X3 13,5508 9,43765 767395,
X1^2 0,000811408 0,000789385
1,00081
X2^2 -0,971805 0,140826 0,3784
X3^2 -9,30608 6,38408 0,0000908703
Source
Deviance
Df
P
-
Value
Model 259,467 6 0,0000
Residual 294,24 393 0,9999
Total (corr.) 553,707 399
Standard
Estimated
Parameter
Estimate
Error
Odds Ratio
CONSTANT -31,9249 6,44045
X1 0,17182 0,171412 1,18746
Forestry.tk Phạm Văn Hường
Likelihood Ratio Tests
Factor
Chi
-
Squared
Df
P
-
Value
X1 1,02101 1 0,3123
X2 29,6588 1 0,0000
X3 0,00525915 1 0,9422
X1^2 0,539363 1 0,4627
X2^2 37,1202 1 0,0000
X3^2 0,0032793 1 0,9543
Analysis of Deviance
Percentage of deviance explained by model = 49,0849
Adjusted percentage = 43,7043
Phụ lục 30. Phân tích ảnh hưởng tương tác của X1 và X3 đến xác suất bắt gặp
Dầu con rái tái sinh
Dependent variable: DCR1 Factors: X1; X3
Estimated Regression Model (Maximum Likelihood)
Likelihood Ratio Tests
Factor
Chi
-
Squared
Df
P
-
Value
X1 32,1961 1 0,0000
X3 7,02293 1 0,0080
X1^2 28,1462 1 0,0000
X1*X3 4,18256 1 0,0408
X3^2 16,4611 1 0,0000
Analysis of Deviance
Percentage of deviance explained by model = 21,7624
Adjusted percentage = 19,5952
Phụ lục 31. Phân tích ảnh hưởng tương tác của X1 và X3 đến XS bắt gặp DCR-
TT
Dependent variable: (DCR-TT) Factors: X1; X3
Estimated Regression Model (Maximum Likelihood)
Likelihood Ratio Tests
Factor
Chi
-
Squared
Df
P
-
Value
X1 31,9374 1 0,0000
X3 1,30514 1 0,2533
X1^2 28,7767 1 0,0000
X1*X3 6,36542 1 0,0116
X3^2 8,73131 1 0,0031
Analysis of Deviance
Percentage of deviance explained by model = 32,0859
Adjusted percentage = 27,4739
Phụ lục 32. Phân tích ảnh hưởng tương tác của X2 và X3 đến XS bắt gặp DSR-TS
Dependent variable: DCR-TS Factors: X2; X3
Estimated Regression Model (Maximum Likelihood)
X2 9,49791 2,14285 13331,8
X3 1,034 14,2294 2,81229
X1^2 -0,000866029 0,00118313 0,999134
X2^2 -0,864212 0,1763 0,421384
X3^2 -0,540644 9,42874 0,582373
Source
Deviance
Df
P
-
Value
Model 127,716 6 0,0000
Residual 132,479 193 0,9997
Total (corr.) 260,195 199
Standard
Estimated
Parameter
Estimate
Error
Odds Ratio
CONSTANT
-21,9002 2,87449
X1 0,474449 0,089262 1,60713
X3 19,4945 7,46351 2,9266E8
X1^2 -0,00444457 0,000905789
0,995565
X1*X3 0,20245 0,103809 1,2244
X3^2 -23,2924 5,94524 7,6601E-11
Source
Deviance
Df
P
-
Value
Model 120,5 5 0,0000
Residual 433,207 394 0,0843
Total (corr.) 553,707 399
Standard
Estimated
Parameter
Estimate
Error
Odds Ratio
CONSTANT
-29,2748 5,06891
X1 0,756842 0,155154 2,13153
X3 12,6057 11,0388 298267,
X1^2 -0,00720348 0,00154457 0,992822
X1*X3 0,381149 0,160824 1,46397
X3^2 -26,9056 9,09662 2,06564E-12
Sou
rce
Deviance
Df
P
-
Value
Model 83,4857 5 0,0000
Residual 176,709 194 0,8082
Total (corr.) 260,195 199
Standard
Estimated
Parameter
Estimate
Error
Odds Ratio
Forestry.tk Phạm Văn Hường
Likelihood Ratio Tests
Factor
Chi
-
Squared
Df
P
-
Value
X2 76,0679 1 0,0000
X3 0,197124 1 0,6571
X2^2 87,6156 1 0,0000
X2*X3 15,717 1 0,0001
X3^2 9,93501 1 0,0016
Analysis of Deviance
Percentage of deviance explained by model = 47,4096
Adjusted percentage = 45,2424
Phụ lục 33. Phân tích ảnh hưởng tương tác của X2 và X3 đến XS bắt gặp DCR-
TT
Dependent variable: DCR – TT Factors: X2; X3
Estimated Regression Model (Maximum Likelihood)
Likelihood Ratio Tests
Factor
Chi
-
Squared
Df
P
-
Value
X2 46,7371 1 0,0000
X3 0,151094 1 0,6975
X2^2 66,3074 1 0,0000
X2*X3 14,6228 1 0,0001
X3^2 5,08669 1 0,0241
Analysis of Deviance
Percentage of deviance explained by model = 53,1875
Adjusted percentage = 48,5756
Phụ lục 34. Phân tích ảnh hưởng tổng hợp của X1 và X2 đến XS bắt gặp VeV-TS
Dependent variable: VeV_TS Factors: X1; X2; X1^2; X2^2
Estimated Regression Model (Maximum Likelihood)
Likelihood Ratio Tests
Factor
Chi
-
Squared
Df
P
-
Value
X1 0,204455 1 0,6511
X2 65,462 1 0,0000
X1^2 0,0105663 1 0,9181
X2^2 81,0248 1 0,0000
Analysis of Deviance
Percentage of deviance explained by model = 39,3819
Adjusted percentage = 37,5702
Phụ lục 35. Phân tích ảnh hưởng tổng hợp của X1 và X2 đến xác suất bắt gặp vên
vên trưởng thành
Dependent variable: VeV_TT Factors: X1; X2; X1^2; X2^2
Estimated Regression Model (Maximum Likelihood)
CONSTANT -23,8779 3,16873
X2 10,45 1,62979 34543,7
X3 -4,80091 10,8813 0,00822224
X2^2 -1,56405 0,257968 0,209287
X2*X3 7,87853 2,21138 2640,0
X3^2 -23,5676 7,45172 5,81745E-11
Source
Deviance
Df
P
-
Value
Model 262,51 5 0,0000
Residual 291,197 394 1,0000
Total (corr.) 553,707 399
Standard
Estimated
Parameter
Estimate
Error
Odds Ratio
CONSTANT -27,4037 5,47118
X2 11,1628 2,31248 70460,6
X3 -5,76417 14,981 0,00313799
X2^2 -1,56524 0,284237 0,209037
X2*X3 8,69873 2,65613 5995,28
X3^2 -27,2637 12,0574 1,44381E-12
Source
Deviance
Df
P
-
Value
Model 138,391 5 0,0000
Residual 121,804 194 1,0000
Total (corr.) 260,195 199
Standard
Estimated
Parameter
Estimate
Error
Odds Ratio
CONSTANT -33,1808 5,51064
X1 0,0542154 0,120168 1,05571
X2 11,3956 2,11852 88927,7
X1^2 -0,0000852904
0,000829926
0,999915
X2^2 -1,05434 0,179133 0,348423
Source
Deviance
Df
P
-
Value
Model 217,37 4 0,0000
Residual 334,585 395 0,9876
Total (corr.) 551,955 399
Standard
Estimated
Forestry.tk Phạm Văn Hường
Likelihood Ratio Tests
Factor
Chi
-
Squared
Df
P
-
Value
X1 0,240395 1 0,6239
X2 48,7265 1 0,0000
X1^2 0,356499 1 0,5505
X2^2 54,4287 1 0,0000
Analysis of Deviance
Percentage of deviance explained by model = 43,9095
Adjusted percentage = 40,2057
Phụ lục 36. Phân tích ảnh hưởng tổng hợp của X1 và X3 đến xác suất bắt gặp vên
vên tái sinh
Dependent variable: VeV_TS Factors: X1; X3; X1^2; X3^2
Estimated Regression Model (Maximum Likelihood)
Likelihood Ratio Tests
Factor
Chi
-
Squared
Df
P
-
Value
X1 22,8268 1 0,0000
X3 26,895 1 0,0000
X1^2 25,2995 1 0,0000
X3^2 27,2347 1 0,0000
Analysis of Deviance
Percentage of deviance explained by model = 23,2397
Adjusted percentage = 21,4279
Phụ lục 37. Phân tích ảnh hưởng tổng hợp của X1 và X3 đến xác suất bắt gặp vên
vên trưởng thành
Dependent variable: VeV_TT Factors: X1; X3; X1^2; X3^2
Estimated Regression Model (Maximum Likelihood)
Likelihood Ratio Tests
Factor
Chi
-
Squared
Df
P
-
Value
X1 17,0119 1 0,0000
X3 5,78798 1 0,0161
X1^2 17,6964 1 0,0000
X3^2 5,68998 1 0,0171
Analysis of Deviance
Percentage of deviance explained by model = 24,1281
Adjusted percentage = 20,4244
Phụ lục 38. Phân tích ảnh hưởng tổng hợp của X2 và X3 đến xác suất bắt gặp vên
vên tái sinh
Dependent variable: VeV_TS Factors: X2; X3; X2^2; X3^2
Estimated Regression Model (Maximum Likelihood)
Parameter
Estimate
Error
Odds Ratio
CONSTANT -41,7414 8,64369
X1 -0,0871395 0,177922 0,916549
X2 15,4749 3,33169 5,25593E6
X1^2 0,000722355 0,0012128 1,00072
X2^2 -1,29346 0,262632 0,274319
Source
Deviance
Df
P
-
Value
Model 118,553 4 0,0000
Residual 151,442 195 0,9909
Total (corr.) 269,995 199
Standard
Estimated
Parameter
Estimate
Error
Odds Ratio
CONSTANT
-30,897 4,11336
X1 0,455389 0,101243 1,57679
X3 42,0266 9,01356 1,7861E18
X1^2 -0,00317163 0,000671058 0,996833
X3^2 -27,8227 5,86379 8,25607E-13
Source
Deviance
Df
P
-
Value
Model 128,272 4 0,0000
Residual 423,683 395 0,1538
Total (corr.) 551,955 399
Standard
Estimated
Parameter
Estimate
Error
Odds Ratio
CONSTANT
-26,7783 5,02784
X1 0,515899 0,13636 1,67514
X3 25,4023 10,7001 1,07661E11
X1^2 -0,00351288 0,000907621 0,996493
X3^2 -16,6712 7,07233 5,75188E-8
Source
Deviance
Df
P
-
Value
Model 65,1447 4 0,0000
Residual 204,85 195 0,3000
Total (corr.) 269,995 199
Standard
Estimated
Parameter
Estimate
Error
Odds Rat
io
Forestry.tk Phạm Văn Hường
Likelihood Ratio Tests
Factor
Chi
-
Squared
Df
P
-
Value
X2 53,5838 1 0,0000
X3 10,9074 1 0,0010
X2^2 68,3934 1 0,0000
X3^2 9,73793 1 0,0018
Analysis of Deviance
Percentage of deviance explained by model = 39,9918
Adjusted percentage = 38,18
Phụ lục 39. Phân tích ảnh hưởng tổng hợp của X2 và X3 đến XS bắt gặp VeV-TT
Dependent variable: VeV_TT Factors: X2; X3; X2^2; X3^2
Estimated Regression Model (Maximum Likelihood)
Likelihood Ratio Tests
Factor
Chi
-
Squared
Df
P
-
Value
X2 55,8649 1 0,0000
X3 0,0779008 1 0,7802
X2^2 62,464 1 0,0000
X3^2 0,103725 1 0,7474
Analysis of Deviance
Percentage of deviance explained by model = 43,6069
Adjusted percentage = 39,9031
Phụ lục 40. Phân tích ảnh hưởng tổng hợp của X1, X2 và X3 đến XS bắt gặp VeV-TS
Dependent variable: VeV_TS Factors: X1; X2; X3; X1^2; X2^2; X3^2
Estimated Regression Model (Maximum Likelihood)
Likelihood Ratio Tests
Factor
Chi
-
Squared
Df
P
-
Val
ue
X1 0,066018 1 0,7972
X2 39,5087 1 0,0000
X3 11,662 1 0,0006
X1^2 0,0117895 1 0,9135
X2^2 52,9724 1 0,0000
X3^2 11,3042 1 0,0008
Analysis of Deviance
Phụ lục 41. Phân tích ảnh hưởng tổng hợp của X1, X2 và X3 đến xác suất bắt gặp
vên vên trưởng thành
Dependent variable: VeV_TT Factors: X1; X2; X3; X1^2; X2^2; X3^2
Estimated Regression Model (Maximum Likelihood)
CONSTANT -38,1886 5,48001
X2 9,70758 1,85414 16441,7
X3 33,136 10,5233 2,45918E14
X2^2 -0,891731 0,155232 0,409946
X3^2 -20,7977 6,92565 9,2831E-10
Source
Deviance
Df
P
-
Value
Model 220,736 4 0,0000
Residual 331,219 395 0,9913
Total (corr.) 551,955 399
Standard
Estimated
Parameter
Estimate
Error
Odds Ratio
CONSTANT
-43,7239 8,6142
X2 15,5734 3,26611 5,79992E6
X3 -3,87729 13,9312 0,0207069
X2^2 -1,2864 0,256468 0,276262
X3^2 2,94593 9,17817 19,0284
Source
Deviance
Df
P
-
Value
Model 117,736 4 0,0000
Residual 152,258 195 0,9896
Total (corr.) 269,995 199
Standard
Estimated
Parameter
Estimate
Error
Odds Ratio
CONSTANT
-37,527 5,55675
X1 0,0310048 0,120712 1,03149
X2 9,07576 1,87486 8740,82
X3 33,368 10,2007 3,10113E14
X1^2 0,0000905919 0,000834243 1,00009
X2^2 -0,870982 0,159665 0,41854
X3^2 -21,9809 6,78409 2,84315E-10
Source
Deviance
Df
P
-
Value
Model 229,072 6 0,0000
Residual 322,883 393 0,9959
Total (corr.) 551,955 399
Standard
Estimated
Par
ameter
Estimate
Error
Odds Ratio
CONSTANT -41,7224 8,6963
Forestry.tk Phạm Văn Hường
Likelihood Ratio Tests
Factor
Chi
-
Squared
Df
P
-
Value
X1 0,25718 1 0,6121
X2 41,1975 1 0,0000
X3 0,046295 1 0,8296
X1^2 0,367454 1 0,5444
X2^2 46,8547 1 0,0000
X3^2 0,0529287 1 0,8180
Analysis of Deviance
Percentage of deviance explained by model = 43,9332
Adjusted percentage = 38,7479
Phụ lục 42. Phân tích ảnh hưởng tương tác giữa X1 và X2 đến XS bắt gặp VeV-
TT
Dependent variable: VeV_TT Factors: X1; X2
Estimated Regression Model (Maximum Likelihood)
Likelihood Ratio Tests
Factor
Chi
-
Squared
Df
P
-
Value
X1 0,324393 1 0,5690
X2 51,6345 1 0,0000
X1^2 3,0413 1 0,0812
X1*X2 3,05853 1 0,0803
X2^2 10,8864 1 0,0010
Analysis of Deviance
Percentage of deviance explained by model = 45,0423
Adjusted percentage = 40,5977
Phụ lục 43. Phân tích ảnh hưởng tương tác giữa X1 và X3 đến XS bắt gặp VeV-
TS
Dependent variable: VeV_TS Factors: X1; X3
Estimated Regression Model (Maximum Likelihood)
Likelihood Ratio Tests
Factor
Chi
-
Squared
Df
P
-
Value
X1 23,4697 1 0,0000
X3 16,1204 1 0,0001
X1^2 26,9169 1 0,0000
X1*X3 5,33576 1 0,0209
X3^2 32,198 1 0,0000
Analysis of Deviance
X1 -0,090784 0,17927 0,913215
X2 15,8601 3,84428 7,72586E6
X3 -3,02643 14,0981 0,0484886
X1^2 0,00073685 0,00121873 1,00074
X2^2 -1,32407 0,302377 0,266051
X3^2 2,14284 9,33747 8,5236
Source
Deviance
Df
P
-
Value
Model 118,617 6 0,0000
Residual 151,377 193 0,9880
Total (corr.) 269,995 199
Standard
Estimated
Parameter
Estimate
Error
Odds Ratio
CONSTANT -42,5001 8,58468
X1 -0,0995797 0,175475 0,905218
X2 15,7547 3,29809 6,95327E6
X1^2 0,00353331 0,00210692 1,00354
X1*X2 -0,0684168 0,0389708 0,933871
X2^2 -0,883912 0,324974 0,413163
Source
De
viance
Df
P
-
Value
Model 121,612 5 0,0000
Residual 148,383 194 0,9936
Total (corr.) 269,995 199
Standard
Estimated
Parameter
Estimate
Error
Odds Ratio
CONSTANT -29,112 3,98068
X1 0,477085 0,104639 1,61137
X3 35,8114 9,64059 3,57027E15
X1^2 -0,00472898 0,000990415 0,995282
X1*X3 0,265222 0,122054 1,30372
X3^2 -36,3335 7,54549 1,66169E-16
Source
Deviance
Df
P
-
Value
Model 133,608 5 0,0000
Forestry.tk Phạm Văn Hường
Percentage of deviance explained by model = 24,2064
Adjusted percentage = 22,0323
Phụ lục 44. Phân tích ảnh hưởng tương tác giữa X1 và X3 đến XS bắt gặp VeV-
TT
Dependent variable: VeV_TT Factors: X1; X3
Estimated Regression Model (Maximum Likelihood)
Likelihood Ratio Tests
Factor
Chi
-
Squared
Df
P
-
Value
X1 19,6166 1 0,0000
X3 3,03507 1 0,0815
X1^2 17,6934 1 0,0000
X1*X3 3,44789 1 0,0633
X3^2 9,08252 1 0,0026
Analysis of Deviance
Percentage of deviance explained by model = 25,4052
Adjusted percentage = 20,9606
Phụ lục 45. Phân tích ảnh hưởng tương tác giữa X2 và X3 đến xác suất bắt gặp
vên vên tái sinh
Dependent variable: VeV_TS Factors: X2; X3
Estimated Regression Model (Maximum Likelihood)
Likelihood Ratio Tests
Factor
Chi
-
Squared
Df
P
-
Value
X2 43,5256 1 0,0000
X3 3,25991 1 0,0710
X2^2 62,6866 1 0,0000
X2*X3 5,36804 1 0,0205
X3^2 14,6963 1 0,0001
Analysis of Deviance
Percentage of deviance explained by model = 40,9643
Adjusted percentage = 38,7902
Phụ lục 46. Phân tích ảnh hưởng tương tác giữa X2và X3 đến xác suất bắt gặp vên
vên trưởng thành
Dependent variable: VeV_TT Factors: X2; X3
Estimated Regression Model (Maximum Likelihood)
Likelihood Ratio Tests
Factor
Chi
-
Squa
red
Df
P
-
Value
X2 50,5191 1 0,0000
X3 0,520682 1 0,4705
X2^2 56,2859 1 0,0000
X2*X3 4,18564 1 0,0408
X3^2 0,397112 1 0,5286
Analysis of Deviance
Residual 418,347 394 0,1911
Total (corr.) 551,955 399
Standard
Estimated
Parameter
Estimate
Error
Odds Ratio
CONSTANT -26,2275 4,90347
X1 0,575306 0,143037 1,77767
X3 19,0513 11,1099 1,87871E8
X1^2 -0,00530961 0,0013893 0,994704
X1*X3 0,26533 0,150831 1,30386
X3^2 -25,3137 8,67995 1,01488E-11
Source
Deviance
Df
P
-
Value
Model 68,5926 5 0,0000
Residual 201,402 194 0,3428
Total (corr.) 269,995 199
Standard
Estimated
Parameter
Estimate
Error
Odds Ratio
CONSTANT -32,1706 5,43765
X2 9,19665 1,91011 9864,0
X3 21,5462 11,99 2,27714E9
X2^2 -1,16498 0,223141 0,31193
X2*X3 4,48315 2,09103 88,5134
X3^2 -29,0857 8,02608 2,3347E-13
Source
Deviance
Df
P
-
Value
Model 226,105 5 0,0000
Residual 325,85 394 0,9948
Total (corr.) 551,955 399
Standard
Estimated
Paramete
r
Estimate
Error
Odds Ratio
CONSTANT -40,0975 8,53606
X2 15,2919 3,28174 4,37702E6
X3 -10,4895 14,6817 0,0000278276
X2^2 -1,51736 0,287853 0,219289
X2*X3 3,77099 2,02953 43,4232
X3^2 -6,85631 10,9576 0,0010528
Source
Deviance
Df
P
-
Value
Model 121,922 5 0,0000
Forestry.tk Phạm Văn Hường
Percentage of deviance explained by model = 45,1572
Adjusted percentage = 40,7126
Phụ lục 47. Phân tích ảnh hưởng của X1 đến xác suất bắt gặp DSN-TS trong các
kiểu trạng thái rừng
Dependent variable: DSN_TS Factors: X1; X1^2; IIB; IIIA1; IIIA2
Estimated Regression Model (Maximum Likelihood)
Likelihood Ratio Tests
Factor
Chi
-
Squared
Df
P
-
Value
X1 96,2606 1 0,0000
X1^2 110,473 1 0,0000
IIB 8,44123 1 0,0037
IIIA1 1,93793 1 0,1639
IIIA2 0,212104 1 0,6451
Analysis of Deviance
Percentage of deviance explained by model = 28,1205
Adjusted percentage = 25,8737
Phụ lục 48. Phân tích ảnh hưởng của X1 đến xác suất bắt gặp DSN-TT trong các
kiểu trạng thái rừng
Dependent variable: DSN_TT Factors: X1; X1^2; IIB; IIIA1; IIIA2
Estimated Regression Model (Maximum Likelihood)
Likelihood Ratio Tests
Factor
Chi
-
Squared
Df
P
-
Value
X1 48,0498 1 0,0000
X1^2 49,1643 1 0,0000
IIB 8,76464 1 0,0031
IIIA1 4,16913 1 0,0412
IIIA2 0,492285 1 0,4829
Analysis of Deviance
Percentage of deviance explained by model = 39,4765
Adjusted percentage = 34,6308
Phụ lục 49. Phân tích ảnh hưởng của X1 đến xác suất bắt gặp DCR-TS trong các
kiểu trạng thái rừng
Dependent variable: DCR_TS Factors: X1; X1^2; IIB; IIIA1; IIIA2
Estimated Regression Model (Maximum Likelihood)
Likelihood Ratio Tests
Factor
Chi
-
Squared
Df
P
-
Va
lue
X1 80,6263 1 0,0000
X1^2 90,6585 1 0,0000
IIB 2,46936 1 0,1161
IIIA1 9,26269 1 0,0023
IIIA2 0,122868 1 0,7259
Residual 148,073 194 0,9940
Total (corr.) 269,995 199
Standard
Estimated
Parameter
Estimate
Error
Odds Ratio
CONSTANT -18,7916 3,0574
X1 0,626526 0,0831273 1,8711
X1^2 -0,00457735 0,000560264 0,995433
IIB -1,46801 0,511537 0,230384
IIIA1 -0,503416 0,363983 0,604462
IIIA2 -0,165335 0,359309 0,84761
Source
Deviance
Df
P
-
Value
Model 150,19 5 0,0000
Residual 383,903 394 0,6327
Total (corr.) 534,093 399
Standard
Estimated
Parameter
Estimate
Error
Odds Ratio
CONSTANT -26,4877 6,08098
X1 0,833076 0,16641 2,30038
X1^2 -0,0057433 0,00110625 0,994273
IIB -2,33079 0,814254 0,097219
IIIA1 -1,21116 0,6143 0,297851
IIIA2 -0,444064 0,636397 0,641424
Source
Deviance
Df
P
-
Value
Model 97,7598 5 0,0000
Residual 149,88 194 0,9918
Total (corr.) 247,64 199
Standard
Estimated
Parameter
Estimate
Error
Odd
s Ratio
CONSTANT -17,4868 2,9085
X1 0,556038 0,0785218 1,74375
X1^2 -0,00401424 0,000527858 0,995994
IIB -0,729352 0,464044 0,482221
IIIA1 -0,992526 0,333046 0,370639
IIIA2 0,115208 0,328649 1,12211
Forestry.tk Phạm Văn Hường
Analysis of Deviance
Percentage of deviance explained by model = 21,3903
Adjusted percentage = 19,2231
Phụ lục 50. Phân tích ảnh hưởng của X1 đến xác suất bắt gặp DCR-TT trong các
kiểu trạng thái rừng
Dependent variable: DCR_TT Factors: X1; X1^2; IIB; IIIA1; IIIA2
Estimated Regression Model (Maximum Likelihood)
Likelihood Ratio Tests
Factor
Chi
-
Squared
Df
P
-
Value
X1 71,4967 1 0,0000
X1^2 69,7904 1 0,0000
IIB 4,50379 1 0,0338
IIIA1 0,000976384 1 0,9751
IIIA2 0,210713 1 0,6462
Analysis of Deviance
Percentage of deviance explained by model = 30,5111
Adjusted percentage = 25,8991
Phụ lục 51. Phân tích ảnh hưởng của X1 đến xác suất bắt gặp VeV-TS trong các
kiểu trạng thái rừng
Dependent variable: VeV_TS Factors: X1; X1^2; IIB; IIIA1; IIIA2
Estimated Regression Model (Maximum Likelihood)
Likelihood Ratio Tests
Factor
Chi
-
Squared
Df
P
-
Value
X1 71,056 1 0,0000
X1^2 78,2091 1 0,0000
IIB 1,20915 1 0,2715
IIIA1 0,510065 1 0,4751
IIIA2 1,11157 1 0,2917
Analysis of Deviance
Percentage of deviance explained by model = 19,8117
Adjusted percentage = 17,6068
Phụ lục 52. Phân tích ảnh hưởng của X1 đến xác suất bắt gặp VeV-TT trong các
kiểu trạng thái rừng
Source
Deviance
Df
P
-
Value
Model 118,44 5 0,0000
Residual 435,268 394 0,0742
Total (corr.) 553,707 399
Standard
Estimated
Parameter
Estimate
Error
Odds Ratio
CONSTANT -34,2671 6,47522
X1 0,965323 0,169471 2,62564
X1^2 -0,00641819 0,00109499 0,993602
IIB 1,79358 0,913074 6,01092
IIIA1 -0,0153916 0,492597 0,984726
IIIA2 0,227501 0,49578 1,25546
Source
Deviance
Df
P
-
Value
Model 79,3882 5 0,0000
Residual 180,807 194 0,7427
Total (corr.) 260,195 199
Standard
Estimated
Parameter
Estimate
Error
Odds Ratio
CONSTANT -22,6929 3,8668
X1 0,655585 0,101946 1,92627
X1^2 -0,00455716 0,000669206 0,995453
IIB -0,489787 0,445334 0,612757
IIIA1 -0,225393 0,31611 0,798202
IIIA2 0,3292 0,312624 1,38986
Source
Deviance
Df
P
-
Value
Model 107,822 5 0,0000
Residual 436,411 394 0,0690
Total (corr.) 544,234 399
Forestry.tk Phạm Văn Hường
Dependent variable: VeV_TT Factors: X1; X1^2; IIB; IIIA1; IIIA2
Estimated Regression Model (Maximum Likelihood)
Likelihood Ratio Tests
Factor
Chi
-
Squared
Df
P
-
Value
X1 50,2859 1 0,0000
X1^2 48,8772 1 0,0000
IIB 0,433117 1 0,5105
IIIA1 0,261384 1 0,6092
IIIA2 1,33565 1 0,2478
Analysis of Deviance
Percentage of deviance explained by model = 23,0702
Adjusted percentage = 18,6256
Phụ lục 53. Phân tích ảnh hưởng của X2 đến xác suất bắt gặp DSN-TS trong các
kiểu trạng thái rừng
Dependent variable: DSN_TS Factors: X2; X2^2; IIB; IIIA1; IIIA2
Estimated Regression Model (Maximum Likelihood)
Likelihood Ratio Tests
Factor
Chi
-
Squared
Df
P
-
Value
X2 186,117 1 0,0000
X2^2 217,104 1 0,0000
IIB 15,6955 1 0,0001
IIIA1 0,165371 1 0,6843
IIIA2 3,02229 1 0,0821
Analysis of Deviance
Percentage of deviance explained by model = 50,4047
Adjusted percentage = 48,1579
Phụ lục 54. Phân tích ảnh hưởng của X2 đến xác suất bắt gặp DSN-TT trong 4
kiểu trạng thái rừng
Dependent variable: DSN_TT Factors: X2; X2^2; IIB; IIIA1; IIIA2
Estimated Regression Model (Maximum Likelihood)
Likelihood Ratio Tests
Factor
Chi
-
Squared
Df
P
-
Value
X2 92,1321 1 0,0000
X2^2 96,0313 1 0,0000
IIB 14,9208 1 0,0001
IIIA1 2,40281 1 0,1211
IIIA2 1,85269 1 0,1735
Analysis of Deviance
Percentage of deviance explained by model = 58,4363
Adjusted percentage = 53,5906
Phụ lục 55. Phân tích ảnh hưởng của X2 đến xác suất bắt gặp DCR-TS trong các
kiểu trạng thái rừng
Dependent variable: DCR_TS Factors: X2; X2^2; IIB; IIIA1; IIIA2
Estimated Regression Model (Maximum Likelihood)
Standard
Estimated
Parameter
Estimate
Error
O
dds Ratio
CONSTANT -25,9773 5,47829
X1 0,740371 0,144088 2,09671
X1^2 -0,00492544 0,000936692 0,995087
IIB 0,474314 0,730371 1,60691
IIIA1 -0,240942 0,472242 0,785887
IIIA2 -0,529225 0,460923 0,589061
Source
Deviance
Df
P
-
Value
Model 62,2883 5 0,0000
Residual 207,707 194 0,2376
Total (corr.) 269,995 199
Standard
Estimated
Parameter
Estimate
Error
Odds Ratio
CONSTANT -24,0585 3,20659
X2 9,97615 1,1063 21507,4
X2^2 -0,918232 0,0949323 0,399224
IIB -1,98872 0,525682 0,136871
IIIA1 0,202399 0,498249 1,22434
IIIA2 -0,835362 0,490055 0,433718
Source
Deviance
Df
P
-
Value
Model 269,208 5 0,0000
Residual 264,885 394 1,0000
Total (corr.) 534,093 399
Standard
Estimated
Parameter
Estimate
Error
Odds Ratio
CONSTANT -47,6192 12,2794
X2 17,376 3,93897 3,51813E7
X2^2 -1,43557 0,304682 0,237981
IIB -3,26937 0,946498 0,0380304
IIIA1 -1,17222 0,772092 0,309679
IIIA2 -1,08506 0,812732 0,337883
Source
Deviance
Df
P
-
Value
Model 144,712 5 0,0000
Residual 102,928 194 1,0000
Total (corr.) 247,64 199
Forestry.tk Phạm Văn Hường
Likelihood Ratio Tests
Factor
Chi
-
Squared
Df
P
-
Value
X2 166,461 1 0,0000
X2^2 202,006 1 0,0000
IIB 17,0965 1 0,0000
IIIA1 6,30016 1 0,0121
IIIA2 2,01729 1 0,1555
Analysis of Deviance
Percentage of deviance explained by model = 47,3085
Adjusted percentage = 45,1413
Phụ lục 56. Phân tích ảnh hưởng của X2 đến xác suất bắt gặp DCR-TT trong các
kiểu trạng thái rừng
Dependent variable: DCR_TT Factors: X2; X2^2; IIB; IIIA1; IIIA2
Estimated Regression Model (Maximum Likelihood)
Likelihood Ratio Tests
Factor
Chi
-
Squared
Df
P
-
Value
X2 107,222 1 0,0000
X2^2 114,987 1 0,0000
IIB 0,020624 1 0,8858
IIIA1 0,501704 1 0,4788
IIIA2 0,144705 1 0,7036
Analysis of Deviance
Percentage of deviance explained by model = 47,6742
Adjusted percentage = 43,0622
Phụ lục 57. Phân tích ảnh hưởng của X2 đến xác suất bắt gặp VeV-TS trong các
kiểu trạng thái rừng
Dependent variable: VeV_TS Factors: X2; X2^2; IIB; IIIA1; IIIA2
Estimated Regression Model (Maximum Likelihood)
Likelihood Ratio Tests
Factor
Chi
-
Squared
Df
P
-
Value
X2 169,014 1 0,0000
X2^2 198,258 1 0,0000
IIB 10,1848 1 0,0014
IIIA1 0,0354195 1 0,8507
IIIA2 0,425461 1 0,5142
Analysis of Deviance
Percentage of deviance explained by model = 47,6888
Adjusted percentage = 45,4839
Phụ lục 58. Phân tích ảnh hưởng của X2 đến xác suất bắt gặp VeV-TT trong các
kiểu trạng thái rừng
Dependent variable: VeV_TT Factors: X2; X2^2; IIB; IIIA1; IIIA2
Estimated Regression Model (Maximum Likelihood)
Standard
Estimated
Parameter
Estimate
Error
Odds Ratio
CONSTANT -21,9975 3,12152
X2 9,76693 1,17301 17447,1
X2^2 -0,961362 0,110859 0,382372
IIB -2,02945 0,51978 0,131408
IIIA1 -1,12706 0,46283 0,323984
IIIA2 -0,663399 0,474734 0,515097
Source
Deviance
Df
P
-
Value
Model 261,951 5 0,0000
Residual 291,757 394 1,0000
Total (corr.) 553,707 399
Standard
Estimated
Parameter
Estimate
Error
Odds Ratio
CONSTANT -31,5227 6,72865
X2 11,6907 2,16084 119454,
X2^2 -1,00709 0,171462 0,365281
IIB 0,109838 0,766412 1,1161
IIIA1 0,445418 0,632829 1,56114
IIIA2 -0,229073 0,603458 0,79527
Source
Deviance
Df
P
-
Value
Model 124,046 5 0,0000
Residual 136,149 194 0,9994
Total (corr.) 260,195 199
Standard
Estimated
Parameter
Estimate
Error
Odds Ratio
CONSTANT -62,5783 14,3592
X2 23,7977 5,14015 2,1637E10
X2^2 -2,20381 0,459206 0,110382
IIB -1,45693 0,464749 0,23295
IIIA1 0,0817271 0,43458 1,08516
IIIA2 -0,257018 0,395095 0,773354
Source
Deviance
Df
P
-
Value
Model 259,539 5 0,0000
Residual 284,695 394 1,0000
Total (corr.) 544,234 399
Standard
Estimated
Parameter
Estimate
Error
Odds Ratio
CONSTANT -47,4126 9,81538
Forestry.tk Phạm Văn Hường
Likelihood Ratio Tests
Factor
Chi
-
Squared
Df
P
-
Value
X2 105,744 1 0,0000
X2^2 111,339 1 0,0000
IIB 0,032395 1 0,8572
IIIA1 0,00305633 1 0,9559
IIIA2 4,5224 1 0,0335
Analysis of Deviance
Percentage of deviance explained by model = 45,8673
Adjusted percentage = 41,4227
Phụ lục 59. Phân tích ảnh hưởng của X3 đến xác suất bắt gặp DSN-TS trong các
kiểu trạng thái rừng
Dependent variable: DSN_TS Factors: X3; X3^2; IIB; IIA1; IIIA2
Estimated Regression Model (Maximum Likelihood)
Likelihood Ratio Tests
Factor
Chi
-
Squared
Df
P
-
Value
X3 85,3503 1 0,0000
X3^2 90,6128 1 0,0000
IIB 3,76976 1 0,0522
IIIA1 2,57356 1 0,1087
IIIA2 0,0205965 1 0,8859
Analysis of Deviance
Percentage of deviance explained by model = 22,6854
Adjusted percentage = 20,4386
Phụ lục 60. Phân tích ảnh hưởng của X3 đến xác suất bắt gặp DCR-TS trong các
kiểu trạng thái rừng
Dependent variable: DCR_TS Factors: X3 ;X3^2; IIB; IIIA1; IIIA2
Estimated Regression Model (Maximum Likelihood)
Likelihood Ratio Tests
Factor
Chi
-
Squared
Df
P
-
Value
X3 65,9578 1 0,0000
X3^2 76,7227 1 0,0000
IIB 9,05285 1 0,0026
IIIA1 16,2243 1 0,0001
IIIA2 0,25097 1 0,6164
Analysis of Deviance
Percentage of deviance explained by model = 18,5844
Adjusted percentage = 16,4172
Phụ lục 61. Phân tích ảnh hưởng của X3 đến xác suất bắt gặp DCR-TS trong các
kiểu trạng thái rừng
Dependent variable: VeV_TS Factors: X3; X3^2; IIB; IIIA1; IIIA2
Estimated Regression Model (Maximum Likelihood)
X2 16,5505 3,14048 1,54098E7
X2^2 -1,36496 0,245587 0,255391
IIB -0,13308 0,738431 0,875395
IIIA1 -0,0349191 0,631431 0,965684
IIIA2 -1,20396 0,586255 0,300005
Source
Deviance
Df
P
-
Value
Model 123,839 5 0,0000
Residual 146,156 194 0,9957
Total (corr.) 269,995 199
Standard
Estima
ted
Parameter
Estimate
Error
Odds Ratio
CONSTANT -16,0386 2,66733
X3 50,5646 6,904 9,11855E21
X3^2 -35,2674 4,543 4,82594E-16
IIB -1,02795 0,525325 0,357741
IIIA1 -0,566639 0,356941 0,56743
IIIA2 -0,0486224 0,338818 0,952541
Source
Deviance
Df
P
-
Value
Model 121,161 5 0,0000
Residual 412,932 394 0,2458
Total (corr.) 534,093 399
Standard
Estimated
Parameter
Estimate
Error
Odds Ratio
CONSTANT -11,9453 2,25192
X3 41,645 6,09817 1,21959E18
X3^2 -31,0612 4,21983 3,23804E-14
IIB -1,5079 0,502321 0,221375
IIIA1 -1,36816 0,35425 0,254575
IIIA2 0,163328 0,326192 1,17742
Source
Devi
ance
Df
P
-
Value
Model 102,903 5 0,0000
Residual 450,804 394 0,0252
Total (corr.) 553,707 399
Standard
Estimated
Parameter
Estimate
Error
Odds Ratio
CONSTANT -23,8087 4,15052
Forestry.tk Phạm Văn Hường
Likelihood Ratio Tests
Factor
Chi
-
Squared
Df
P
-
Value
X3 85,9406 1 0,0000
X3^2 95,7903 1 0,0000
IIB 3,65388 1 0,0559
IIIA1 2,89275 1 0,0890
IIIA2 0,994058 1 0,3188
Analysis of Deviance
Percentage of deviance explained by model = 22,8545
Adjusted percentage = 20,6496
X3 69,2079 10,6951 1,13917E30
X3^2 -47,9111 6,94372 1,55763E-21
IIB -0,96377 0,50286 0,381452
IIIA1 -0,580592 0,344994 0,559567
IIIA2 0,316922 0,318407 1,3729
Source
Deviance
Df
P
-
Value
Model 124,382 5 0,0000
Residual 419,852 394 0,1774
Total (corr.) 544,234 399