Luận văn : ẢNH HƯỞNG CỦA MỘT SỐ NHÂN TỐ SINH THÁI ĐẾN CÂY HỌ SAO - DẦU (Dipterocarpaceae) TRONG KIỂU RỪNG KÍN THƯỜNG XANH VÀ NỬA RỤNG LÁ ẨM NHIỆT ĐỚI Ở ĐỒNG NAI part 9 potx
Bạn đang xem bản rút gọn của tài liệu. Xem và tải ngay bản đầy đủ của tài liệu tại đây (1.95 MB, 17 trang )
Forestry.tk Phạm Văn Hường
Mean 18.02995 0.0275784 12.47438 0.2095885 Count 219 219 219 219
Standard Error 0.8840546 0.0027179 0.2364268 0.0262176 Average 17,4306 12,0932 0,030144 0,215391
Median 13 0.0123641 12.35 0.0696491 Median 14,6 11,7 0,0167 0,0951
Mode 10.2 0.0081671 13 0.0490044
Mode 800,00% 11 0,005
Standard Deviation 13.752663 0.0422812 3.6779376 0.4078497 Standard deviation 8,97445 4,22507 0,031913 0,294562
Sample Variance 189.13573 0.0017877 13.527225 0.1663414 Coeff. of variation 51,49% 34,94% 105,87% 136,76%
Kurtosis 13.042771 27.695807 6.1168128 30.05685 Standard error 0,606437 0,285504 0,002156 0,019905
Skewness 3.1731658 4.5864311 1.6811808 4.9833782
Minimum 5 3 0,002 0,0088
Range 95.62 0.337959 30 3.180204
Maximum 55,1 27 0,2383 2,7408
Minimum 8 0.005024 3 0.0095378 Range 50,1 24 0,2363 2,732
Maximum 103.62 0.342983 33 3.1897418 Skewness 1,00462 0,51864 2,30862 3,86421
Sum 4363.248 6.6739648 3018.8 50.720406 Stnd. skewness 6,06946 3,13338 13,9476 23,3457
Count 242 242 242 242
Stnd. kurtosis 2,15795 0,134111 26,104 76,5793
Confidence Level (95.0) 1.7414605 0.005354 0.4657268 0.0516448
Sum 3817,3 2648,4 6,6015 47,1706
Trạng thái rừng IIIA
2
Trạng thái rừng IIIA
3
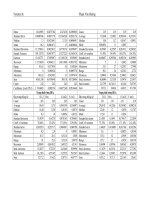
Đặc trung thống kê D1,3 Hvn G (m2) V (m3) Đặc trung thống kê D1,3 Hvn G (m2) V (m3)
Count 265 265 265 265 Count 219 219 219 219
Average 19,69 11,75 0,045559 0,356897 Average 29,0192 14,3265 0,101902 0,998218
Median 14,40 11,50 0,0163 0,0875 Median 22,00 12 0,038 0,1787
Mode 8,3 10 0,0054 0,0322 Mode 17,50 11 0,024
Standard deviation 13,9079 4,16278 0,078163 0,784605 Standard deviation 21,4031 6,1694 0,174417 2,12059
Coeff. of variation 70,64% 35,42% 171,56% 219,84% Coeff. of variation 73,76% 43,06% 171,16% 212,44%
Standard error 0,854353 0,255717 0,004801 0,048198 Standard error 1,44629 0,416889 0,011786 0,143296
Minimum 0,5 2,8 0 0,0001 Minimum 5,6 5 0,0025 0,0148
Maximum 81,5 28,1 0,5214 5,888 Maximum 133,3 32 1,3949 18,8306
Range 81 25,3 0,5214 5,8879 Range 127,7 27 1,3924 18,8158
Skewness 2,08895 0,861032 3,69352 4,5141 Skewness 1,88494 1,09766 3,84365 4,58978
Stnd. skewness 13,8827 5,72225 24,5464 29,9998 Stnd. skewness 11,3879 6,63154 23,2215 27,7292
Stnd. kurtosis 16,2183 6,57145 51,5555 79,7267 Stnd. kurtosis 12,664 1,93912 57,5978 85,1389
Sum 5217,2 3114,2 12,0731 94,5777 Sum 6355,2 3137,5 22,3165 218,61
Forestry.tk Phạm Văn Hường
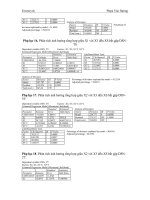
Phụ lục 2. Phân tích thống kê bắt gặp và không bắt gặp loài cây họ Sao - Dầu
trong các trạng thái rừng.
(1) Dầu song nàng giai đoạn tái sinh (DSN-TS)
Tests of Independence
Test
Statistic
Df
P
-
Value
Chi-Squared 30,957 3 0,0000
Summary Statistics
(2) Dầu song nàng cấp tuổi 1 (DSN1)
Tests of Independence
Test
Statistic
Df
P
-
Value
Chi-Squared 19.631 3 0.0002
Summary Statistics
With Rows
With Columns
Statistic
Value
P
-
Value
Df
Statistic
Symmetric
Dependent
Dependent
Contingency Coeff. 0.2990
Lambda 0.1222 0.1127 0.1267 Cramer's V 0.3133
Uncertainty Coeff.
0.0484 0.0758 0.0356 Pearson's R 0.3037 0.0000 198
Somer's D 0.2691 0.2167 0.3548 Kendall's Tau b 0.2773 0.0000
Eta 0.3133 0.3037 Kendall's Tau c 0.3250
(3) Dầu song nàng cấp tuổi 2 (DSN2)
Tests of Independence
Test
Statistic
Df
P
-
Value
Chi-Squared 16.913 3 0.0007
Summary Statistics
With Rows
With Columns
Statistic
Value
P
-
Value
Df
Statistic
Symmetric
Dependent
Dependent
Contingency Coeff. 0.2792
Lambda 0.1496 0.1905 0.1267 Cramer's V 0.2908
Uncertainty Coeff.
0.0411 0.0624 0.0306 Pearson's R 0.1722 0.0148 198
Somer's D 0.1536 0.1267 0.1950 Kendall's Tau b 0.1572 0.0152
Eta 0.2908 0.1722 Kendall's Tau c 0.1900
(4) Dầu song nàng giai đoạn trưởng thành (DCR-TT)
Tests of Independence
Test
Statistic
Df
P
-
Value
With Rows
With Columns
Statistic
Value
P
-
Value
Df
Statistic
Symmetric
Dependent
Dependent
Contingency Coeff. 0,2680
Lambda 0,1253 0,1548 0,1100 Cramer's V 0,2782
Uncertainty Coeff. 0,0371 0,0571 0,0275 Conditional Gamma 0,3525
Somer's D 0,2103 0,1717 0,2712 Pearson's R 0,2364 0,0000 398
Eta 0,2782 0,2364 Kendall's Tau b 0,2158 0,0000
Kendall's Tau c 0,2575
Forestry.tk Phạm Văn Hường
Chi-Squared 49,836 3 0,0000
Summary Statistics
With Rows
With Columns
Statistic
Value
P
-
Value
Df
Statistic
Symmetric
Dependent
Dependent
Contingency Coeff. 0,4466
Lambda 0,2311 0,3226 0,1933 Cramer's V 0,4992
Uncertainty Coeff. 0,1211 0,1962 0,0876 Conditional Gamma 0,6619
Somer's D 0,3906 0,3067 0,5376 Pearson's R 0,4448 0,0000 198
Eta 0,4992 0,4448 Kendall's Tau b 0,4060 0,0000
Kendall's Tau c 0,4600
(5) Dầu con rái giai đoạn tái sinh (DSN-TS)
Tests of Independence
Test
Statistic
Df
P
-
Value
Chi-Squared 21,754 3 0,0001
Summary Statistics
With Rows
With Columns
Statistic
Value
P
-
Value
Df
Statistic
Symmetric
Dependent
Dependent
Contingency Coeff. 0,2271
Lambda 0,1303 0,1885 0,0933 Cramer's V 0,2332
Uncertainty Coeff.
0,0264 0,0397 0,0198 Conditional Gamma 0,3117
Somer's D 0,1902 0,1583 0,2380 Pearson's R 0,2126 0,0000 398
Eta 0,2332 0,2126 Kendall's Tau b 0,1941 0,0000
Kendall's Tau c 0,2375
(6) Dầu con rái cấp tuổi 1 (DCR1)
Tests of Independence
Test
Statistic
Df
P
-
Value
Chi-Squared 13.600 3 0.0035
Summary Statistics
With Rows
With Columns
Statistic
Value
P
-
Value
Df
Statistic
Symmetric
Dependent
Dependent
Contingency Coeff. 0.2523
Lambda 0.1600 0.2600 0.0933 Cramer's V 0.2608
Uncertainty Coeff.
0.0331 0.0496 0.0248 Pearson's R 0.2415 0.0006 198
Somer's D 0.2160 0.1800 0.2700 Kendall's Tau b 0.2205 0.0007
Eta 0.2608 0.2415 Kendall's Tau c 0.2700
(7) Dầu con rái cấp tuổi 2 (DCR2)
Tests of Independence
Te
st
Statistic
Df
P
-
Value
Chi-Squared 9.900 3 0.0194
Summary Statistics
With Rows
With Columns
Statistic
Value
P
-
Value
Df
Forestry.tk Phạm Văn Hường
Statistic
Symmetric
Dependent
Dependent
Contingency Coeff. 0.2172
Lambda 0.1120 0.1319 0.1000 Cramer's V 0.2225
Uncertainty Coeff.
0.0241 0.0363 0.0180 Pearson's R 0.1841 0.0091 198
Somer's D 0.1645 0.1367 0.2067 Kendall's Tau b 0.1681 0.0094
Eta 0.2225 0.1841 Kendall's Tau c 0.2050
(8) Dầu con rái giai đoạn trưởng thành (DCR-TT)
Tests of Independence
Test
Statistic
Df
P
-
Value
Chi-Squared 8.101 3 0.0440
Summary Statistics
With Rows
With Columns
Statistic
Value
P
-
Value
Df
Statistic
Symmetric
Dependent
Dependent
Contingency Coeff. 0.1973
Lambda 0.0633 0.0282 0.0800 Cramer's V 0.2013
Uncertainty Coeff.
0.0194 0.0303 0.0142 Pearson's R 0.1636 0.0207 198
Somer's D 0.1449 0.1167 0.1911 Kendall's Tau b 0.1493 0.0210
Eta 0.2013 0.1636 Kendall's Tau c 0.1750
(9) Vên vên giai đoạn tái sinh (VeV-TS)
Tests of Independence
Test
Statistic
Df
P
-
Value
Chi-Squared 23,974 3 0,0000
Summary Statistics
With Rows
With Columns
Statistic
Value
P
-
Value
Df
Statistic
Symmetric
Dependent
Dependent
Contingency Coeff. 0,2378
Lambda 0,0855 0,0476 0,1067 Cramer's V 0,2448
Uncertainty Coeff. 0,0305 0,0463 0,0227 Conditional Gamma 0,2951
Somer's D 0,1778 0,1467 0,2258 Pearson's R 0,1993 0,0001 398
Eta 0,2448 0,1993 Kendall's Tau b 0,1820 0,0001
Kendall's Tau c 0,2200
(10) Vên vên cấp tuổi 1 (VeV1)
Tests of Independence
Test
Statistic
Df
P
-
Value
Chi-Squared 11.987 3 0.0074
Summary Statistics
With Rows
With Columns
Statistic
Value
P
-
Value
Df
Statistic
Symmetric
Dependent
Dependent
Contingency Coeff. 0.2378
Lambda 0.0855 0.0476 0.1067 Cramer's V 0.2448
Uncertainty Coeff.
0.0305 0.0463 0.0227 Pearson's R 0.1993 0.0047 198
Somer's D 0.1778 0.1467 0.2258 Kendall's Tau b 0.1820 0.0049
Forestry.tk Phạm Văn Hường
Eta 0.2448 0.1993 Kendall's Tau c 0.2200
(11) Vên vên cấp tuổi 2 (VeV2)
Tests of Independence
Test
Statistic
Df
P
-
Value
Chi-Squared 8.480 3 0.0371
Summary Statistics
With R
ows
With Columns
Statistic
Value
P
-
Value
Df
Statistic
Symmetric
Dependent
Dependent
Contingency Coeff. 0.2017
Lambda 0.1240 0.1800 0.0867 Cramer's V 0.2059
Uncertainty Coeff.
0.0207 0.0310 0.0155 Pearson's R 0.1968 0.0052 198
Somer's D 0.1760 0.1467 0.2200 Kendall's Tau b 0.1796 0.0055
Eta 0.2059 0.1968 Kendall's Tau c 0.2200
(12) Vên vên giai đoạn trưởng thành (VeV-TT)
Tests of Independence
Test
Statistic
Df
P
-
Value
Chi-Squared 12.014 3 0.0073
Summary Statistics
With Rows
With Columns
Sta
tistic
Value
P
-
Value
Df
Statistic
Symmetric
Dependent
Dependent
Contingency Coeff. 0.2380
Lambda 0.1126 0.1235 0.1067 Cramer's V 0.2451
Uncertainty Coeff.
0.0291 0.0444 0.0216 Pearson's R 0.2050 0.0036 198
Somer's D 0.1826 0.1500 0.2334 Kendall's Tau b 0.1871 0.0038
Eta 0.2451 0.2050 Kendall's Tau c 0.2250
Forestry.tk Phạm Văn Hường
Phục lục 3. Phân tích sai khác về xác suất bắt gặp cây họ Sao – Dầu trong
các trạng thái rừng
(1) Dầu song nàng cấp tuổi 1 (DSN1)
Dependent variable: DSN1 Factors: IIB; IIIA1; IIIA2;
Estimated Regression Model (Maximum Likelihood)
Analysis of Deviance
Sou
rce
Deviance
Df
P
-
Value
Model 19,7162 3 0,0002
Residual 240,479 196 0,0166
Total (corr.) 260,195 199
Likelihood Ratio Tests
Percentage of deviance explained by model = 7,57748
Adjusted percentage = 4,50286
(2) Dầu song nàng cấp tuổi 2 (DSN2)
Dependent variable: DSN2 Factors: IIB; IIIA1; IIIA2
Estimated Regression Model (Maximum Likelihood)
Analysis of Deviance
Source
Deviance
Df
P
-
Value
Model 16,9697 3 0,0007
Residual 255,147 196 0,0029
Total (corr.) 272,117 199
Likelihood Ratio Tests
Percentage of deviance explained by model = 6,23618
Adjusted percentage = 3,29626
(3) Dầu song nàng giai đoạn tái sinh (DSN-TS)
Dependent variable: DSN_TS Factors: IIB; IIIA1; IIIA2
Estimated Regression Model (Maximum Likelihood)
Analysis of Deviance
Source
Deviance
Df
P
-
Value
Model 30,4702 3 0,0000
Residual 503,623 396 0,0002
Total (corr.) 534,093 399
Likelihood Ratio Tests
Percentage of deviance explained by model = 5,70503
Adjusted percentage = 4,20717
(4) Dầu song nàng giai đoạn trưởng thành (DSN-TT)
Dependent variable: DSN_TT Factors: IIB; IIIA1; IIIA2
Standard
Estimated
Parameter
Estimate
Error
Odds Ratio
CONSTANT 1,38629 0,353553
IIB -1,70907 0,455084 0,181034
IIIA1 -0,980829 0,456435 0,375
IIIA2 -0,233615 0,484406 0,791667
Factor
Chi
-
Squared
Df
P
-
Value
IIB 15,6802 1 0,0001
IIIA1 4,83145 1 0,0279
IIIA2 0,233357 1 0,6290
Standard
Estimated
Parameter
Estimate
Error
Odds Ratio
CONSTANT 0,489548 0,291358
IIB -1,15284 0,417152 0,315738
IIIA1 0,454913 0,429053 1,57604
IIIA2 0,0858159 0,414361 1,08961
Factor
Chi
-
Squared
Df
P
-
Value
IIB 7,95943 1 0,0048
IIIA1 1,13398 1 0,2869
IIIA2 0,042904 1 0,8359
Standard
Estimated
Parameter
Estimate
Error
Odds Ratio
CONSTANT 0,895384 0,220373
IIB -1,38493 0,301677 0,250341
IIIA1 -0,23209 0,305168 0,792875
IIIA2 -0,0480862 0,310131 0,953052
Factor
Chi
-
Squared
Df
P
-
Value
IIB 22,3935 1 0,0000
IIIA1 0,579765 1 0,4464
IIIA2 0,0240422 1 0,8768
Forestry.tk Phạm Văn Hường
Estimated Regression Model (Maximum Likelihood)
Analysis of Deviance
Source
Devianc
e
Df
P
-
Value
Model 48,5887 3 0,0000
Residual 199,052 196 0,4258
Total (corr.) 247,64 199
Likelihood Ratio Tests
Percentage of deviance explained by model = 19,6207
Adjusted percentage = 16,3902
Phụ lục 4. Phân tích ảnh hưởng của độ ẩm đất (X1) đến XS bắt gặp dầu song nàng
(1) Dầu song nàng cấp tuổi 1 – (DSN1)
Dependent variable: DSN1 Factors: X1; X1^2
Estimated Regression Model (Maximum Likelihood)
Analysis of Deviance
Source
Deviance
Df
P
-
Value
Model 81.8469 2 0.0000
Residual 178.348 197 0.8257
Total (corr.) 260.195 199
Likelihood Ratio Tests
Percentage of deviance explained by model = 31.456
Adjusted percentage = 29.15
(2) Dầu song nàng cấp tuổi 2 - (DSN2)
Dependent variable: DSN2 Factors: X1; X1^2
Estimated Regression Model (Maximum Likelihood)
Analysis of Deviance
Source
Deviance
Df
P
-
Value
Model 62.6805 2 0.0000
Residual 209.436 197 0.2587
Total (corr.) 272.117 199
Likelihood Ratio Tests
Percentage of deviance explained by model = 23.0344
Adjusted percentage = 20.8295
(3) Dầu song nàng tái sinh DSN-TS (D1,3 < 10 Cm)
Dependent variable: DSN_TS Factors: X1; X1^2
Estimated Regression Model (Maximum Likelihood)
Standard
Estimated
Parameter
Estimate
Error
Odds Ratio
CONSTANT 1,99243 0,435144
IIB -2,83973 0,533468 0,0584416
IIIA1 -0,946462 0,541572 0,388112
IIIA2 -0,334202 0,581512 0,715909
Factor
Chi
-
Squared
Df
P
-
Value
IIB 37,5928 1 0,0000
IIIA1 3,2464 1 0,0716
IIIA2 0,33321 1 0,5638
Standard
Estimated
Parameter
Estimate
Error
Odds Ratio
CONSTANT -24.5775 4.05572
X1 0.773494 0.118686 2.16733
X1^2 -0.00551618
0.000825273
0.994499
Factor
Chi
-
Squared
Df
P
-
Value
X1 81.7878 1 0.0000
X1^2 81.0747 1 0.0000
Standard
Estimated
Parameter
Estimate
Error
Odds Ratio
CONSTANT
-22.8016 4.13493
X1 0.678369 0.116617 1.97066
X1^2 -0.00469379
0.000793476 0.995317
Factor
Chi
-
Squared
Df
P
-
Value
X1 61.5911 1 0.0000
X1^2 58.7672 1 0.0000
Standard
Estimated
Parameter
Estimate
Error
Odds Ratio
Forestry.tk Phạm Văn Hường
Analysis of Deviance
Source
Deviance
Df
P
-
Value
Model 140.864 2 0.0000
Residual 393.229 397 0.5440
Total (corr.) 534.093 399
Likelihood Ratio Tests
Percentage of deviance explained by model = 26.3744
Adjusted percentage = 25.251
(4) Dầu song nàng trưởng thành – (DSN-TT)
Dependent variable: DSN_TT Factors: X1; X1^2
Estimated Regression Model (Maximum Likelihood)
Analysis of Deviance
Source
Deviance
Df
P
-
Value
Model 87.1993 2 0.0000
Residual 160.441 197 0.9735
Total (corr.) 247.64 199
Likelihood Ratio Tests
Percentage of deviance explained by model = 35.2121
Adjusted percentage = 32.7892
Phụ lục 5. Phân tích ảnh hưởng của độ ẩm (X1) đất đến XS bắt gặp dầu con rái
(1) Đối với cấp tuổi 1 – (DCR1)
Dependent variable: DCR1 Factors: X1; X1^2
Estimated Regression Model (Maximum Likelihood)
Analysis of Deviance
Source
Deviance
Df
P
-
Value
Model 43,2973 2 0,0000
Residual 233,962 197 0,0367
Total (corr.) 277,259 199
Likelihood Ratio Tests
Percentage of deviance explained by model = 15,6162
Adjusted percentage = 13,4521
(2) Đối với cấp tuổi 2 – (DCR2)
Dependent variable: DCR2 Factors: X1; X1^2
Estimated Regression Model (Maximum Likelihood)
Analysis of Deviance
Source
Deviance
Df
P
-
Value
Model 64,8431 2 0,0000
Residual 210,794 197 0,2380
Total (corr.) 275,637 199
Likelihood Ratio Tests
Percentage of deviance explained by model = 23,5249
Adjusted percentage = 21,3481
(3) Đối với toàn bộ giai đoạn tái sinh- (DCR-TS)
CONSTANT
-23.1968 2.83619
X1 0.710365 0.0814086 2.03473
X1^2 -0.00499408
0.000560047 0.995018
Factor
Chi
-
Squared
Df
P
-
Value
X1 140.529 1 0.0000
X1^2 136.765 1 0.0000
Standard
Estimated
Parameter
Estimate
Error
Odds Ratio
CONSTANT
-32.6294 5.77874
X1 0.93734 0.161188 2.55318
X1^2 -0.00622302 0.00107703 0.993796
Factor
Chi
-
Squared
Df
P
-
Value
X1 69.4822 1 0.0000
X1^2 61.0774 1 0.0000
Standard
Estimated
Parameter
Estimate
Error
Odds Ratio
CONSTANT
-15,3083 3,05692
X1 0,47594 0,0888992 1,60953
X1^2 -0,00344932
0,000624218 0,996557
Factor
Chi
-
Squared
Df
P
-
Value
X1 42,5029 1 0,0000
X1^2 43,2931 1 0,0000
Standard
Estimated
Parameter
Estimate
Error
Odds Ratio
CONSTANT
-24,1987 4,35779
X1 0,714328 0,121998 2,04281
X1^2 -0,00494821
0,000826888 0,995064
Factor
Chi
-
Squared
Df
P
-
Value
X1 64,3402 1 0,0000
X1^2 62,1027 1 0,0000
Forestry.tk Phạm Văn Hường
Dependent variable: DCR1 Factors: X1; X1^2
Estimated Regression Model (Maximum Likelihood)
Analysis of Deviance
Source
Deviance
Df
P
-
Value
Model 103,691 2 0,0000
Residual 450,017 397 0,0338
Total (corr.) 553,707 399
Likelihood Ratio Tests
Percentage of deviance explained by model = 18,7266
Adjusted percentage = 17,643
(4) Đối với giai đoạn trưởng thành – (DCR-TT)
Dependent variable: DCR-TT Factors: X1; X1^2
Estimated Regression Model (Maximum Likelihood)
Analysis of Deviance
Source
Deviance
Df
P
-
Value
Model 73,8644 2 0,0000
Residual 186,33 197 0,6964
Total (corr.) 260,195 199
Likelihood Ratio Tests
Percentage of deviance explained by model = 28,3881
Adjusted percentage = 26,0821
Phụ lục 6. Phân tích ảnh hưởng của độ ẩm đất (X1) đến xác suất bắt gặp vên vên
(1) Đối với cấp tuổi 1 – (VeV1)
Dependent variable: VeV1 Factors: X1; X1^2
Estimated Regression Model (Maximum Likelihood)
Analysis of Deviance
Source
Deviance
Df
P
-
Value
Model 51,4497 2 0,0000
Residual 220,667 197 0,1188
Total (corr.) 272,117 199
Likelihood Ratio Tests
Percentage of deviance explained by model = 18,9072
Adjusted percentage = 16,7023
(2) Đối với cấp tuổi 2 – (VeV2)
Dependent variable: VeV2 Factors: X1; X1^2
Estimated Regression Model (Maximum Likelihood)
Analysis of Deviance
Source
Deviance
Df
P
-
Value
Model 50,5244 2 0,0000
Residual 226,734 197 0,0719
Total (corr.) 277,259 199
Standard
Estimated
Parameter
Estimate
Error
Odds Ratio
CONSTANT -18,8162 2,53075
X1 0,569649 0,07218 1,76765
X1^2 -0,00403181
0,000497879
0,995976
Factor
Chi
-
Squared
Df
P
-
Value
X1 103,674 1 0,0000
X1^2 102,434 1 0,0000
Standard
Estimated
Parameter
Estimate
Error
Odds Ratio
CONSTANT
-26,1748 4,57432
X1 0,779054 0,129529 2,17941
X1^2 -0,00533905
0,000879134
0,994675
Facto
r
Chi
-
Squared
Df
P
-
Value
X1 70,0998 1 0,0000
X1^2 65,3319 1 0,0000
Standard
Estimated
Parameter
Estimate
Error
Odds Ratio
CONSTANT
-24,7189 4,95851
X1 0,699556 0,135447 2,01286
X1^2 -0,00478948
0,000905366 0,995222
Factor
Chi
-
Squared
Df
P
-
Value
X1 51,033 1 0,0000
X1^2 49,3277 1 0,0000
Standard
Estimated
Parameter
Estimate
Error
Odds Ratio
CONSTANT
-21,4455 4,24101
X1 0,617985 0,117531 1,85519
X1^2 -0,00423036
0,000792264 0,995779
Forestry.tk Phạm Văn Hường
Likelihood Ratio Tests
Percentage of deviance explained by model = 18,2228
Adjusted percentage = 16,0588
(3) Đối với toàn bộ giai đoạn tái sinh (VeV-TS)
Dependent variable: VeV-TS Factors: X1; X1^2
Estimated Regression Model (Maximum Likelihood)
Analysis of Deviance
Source
Deviance
Df
P
-
Value
Model 101,019 2 0,0000
Residual 450,936 397 0,0316
Total (corr.) 551,955 399
Likelihood Ratio Tests
Percentage of deviance explained by model = 18,3021
Adjusted percentage = 17,215
(4) Đối với giai đoạn trưởng thành (VeV-TT)
Dependent variable: VeV – TT Factors: X1; X1^2
Estimated Regression Model (Maximum Likelihood)
Analysis of Deviance
Source
Deviance
Df
P
-
Value
Model 59,3543 2 0,0000
Residual 210,64 197 0,2402
Total (corr.) 269,995 199
Likelihood Ratio Tests
Percentage of deviance explained by model = 21,9835
Adjusted percentage = 19,7612
Phụ lục 7. Phân tích ảnh hưởng của độ pH đất (X2) đến XS bắt gặp dầu song nàng
(1) Đối với cấp tuổi 1 (DSN1)
Dependent variable: DSN1 Factors: X2; X2^2
Estimated Regression Model (Maximum Likelihood)
Analysis of Deviance
Source
Deviance
Df
P
-
Value
Model 153,346 2 0,0000
Residual 106,848 197 1,0000
Total (corr.) 260,195 199
Likelihood Ratio Tests
Percentage of deviance explained by model = 58,9352
Adjusted percentage = 56,6292
(2) Đối với cấp tuổi 2 (DSN2)
Dependent variable: DSN2 Factors: X2; X2^2
Estimated Regression Model (Maximum Likelihood)
Factor
Chi
-
S
quared
Df
P
-
Value
X1 49,202 1 0,0000
X1^2 46,6542 1 0,0000
Standard
Estimated
Parameter
Estimate
Error
Odds Ratio
CONSTANT
-22,7333 3,20655
X1 0,649063 0,0882188 1,91375
X1^2 -0,00444417 0,000592165
0,995566
Factor
Chi
-
Squared
Df
P
-
Value
X1 99,4116 1 0,0000
X1^2 95,1794 1 0,0000
Standard
Estimated
Parameter
Estimate
Error
Odds Ratio
CONSTANT
-22,898 4,35187
X1 0,662776 0,121271 1,94017
X1^2 -0,00447431 0,000816819
0,995536
Factor
Chi
-
Squared
Df
P
-
Value
X1 53,819 1 0,0000
X1^2 49,1292 1 0,0000
Standard
Estimated
Parameter
Estimate
Error
Odds Ratio
CONSTANT -30,9074 5,20799
X2 12,153 1,81705 189654,
X2^2 -1,0933 0,154302 0,335109
Factor
Chi
-
Squared
Df
P
-
Value
X2 146,248 1 0,0000
X2^2 152,716 1 0,0000
Standard
Estimated
Parameter
Estimate
Error
Odds Ratio
CONSTANT
-27,1564 5,41892
Forestry.tk Phạm Văn Hường
Analysis of Deviance
Source
Deviance
Df
P
-
Value
Model 102,391 2 0,0000
Residual 169,726 197 0,9206
Total (corr.) 272,117 199
Likelihood Ratio Tests
Percentage of deviance explained by model = 37,6276
Adjusted percentage = 35,4226
(3) Đối với toàn bộ giai đoạn tái sinh (DSN-TS)
Dependent variable: DSN_TS Factors: X2; X2^2
Estimated Regression Model (Maximum Likelihood)
Analysis of Deviance
Source
Deviance
Df
P
-
Value
Model 247,762 2 0,0000
Residual 286,331 397 1,0000
Total (corr.) 534,093 399
Likelihood Ratio Tests
Percentage of deviance explained by model = 46,3892
Adjusted percentage = 45,2658
(4) Đối với giai đoạn trưởng thành (DSN – TT)
Dependent variable: DSN – TT Factors: X2; X2^2
Estimated Regression Model (Maximum Likelihood)
Analysis of Deviance
Source
Deviance
Df
P
-
Value
Model 129,467 2 0,0000
Residual 118,173 197 1,0000
Total (corr.) 247,64 199
Likelihood Ratio Tests
Percentage of deviance explained by model = 52,2804
Adjusted percentage = 49,8576
Phụ lục 8. Phân tích ảnh hưởng của độ pH đất đến xác suất bắt gặp dầu con rái
(1) Đối với cấp tuổi 1 (DCR1)
Dependent variable: DCR1 Factors: X2; X2^2
Estimated Regression Model (Maximum Likelihood)
Analysis of Deviance
Source
Deviance
Df
P
-
Value
Model 104,397 2 0,0000
Residual 172,862 197 0,8917
Total (corr.) 277,259 199
X2 9,9846 1,79152 21689,9
X2^2 -0,86274 0,145194 0,422004
Factor
Chi
-
Squared
Df
P
-
Value
X2 101,199 1 0,0000
X2^2 102,201 1 0,0000
Standard
Estimated
Parameter
Estimate
Error
Odds Ratio
CONSTANT -27,9983 3,61819
X2 10,6456 1,22153 42007,2
X2^2 -0,939266 0,100989
0,390915
Factor
Chi
-
Squar
ed
Df
P
-
Value
X2 240,843 1 0,0000
X2^2 247,705 1 0,0000
Standard
Estimated
Parameter
Estimate
Error
Odds Ratio
CONSTANT -58,5148 10,7812
X2 19,8491 3,48845 4,17194E8
X2^2 -1,58678 0,271819 0,204583
Factor
Chi
-
Squared
Df
P
-
Value
X2 123,711 1 0,0000
X2^2 114,001 1 0,0000
Standard
Estimated
Parameter
Estimate
Error
Odds Ratio
CONSTANT -20,2009 3,38696
X2 8,49774 1,33329 4903,68
X2^2 -0,833043 0,129912 0,434724
Forestry.tk Phạm Văn Hường
Likelihood Ratio Tests
Percentage of deviance explained by model = 37,6531
Adjusted percentage = 35,4891
(2) Đối với cấp tuổi 2 (DCR2)
Dependent variable: DCR2 Factors: X2; X2^2
Estimated Regression Model (Maximum Likelihood)
Analysis of Deviance
Source
Deviance
Df
P
-
Value
Model 151,445 2 0,0000
Residual 124,192 197 1,0000
Total (corr.) 275,637 199
Likelihood Ratio Tests
Percentage of deviance explained by model = 54,9436
Adjusted percentage = 52,7668
(3) Đối với toàn bộ giai đoạn tái sinh (DCR-TS)
Dependent variable: DCR-TS Factors: X2; X2^2
Estimated Regression Model (Maximum Likelihood)
Analysis of Deviance
Source
Deviance
Df
P
-
Value
Model 243,263 2 0,0000
Residual 310,444 397 0,9995
Total (corr.) 553,707 399
Likelihood Ratio Tests
Percentage of deviance explained by model = 43,9336
Adjusted percentage = 42,85
(4) Đối với giai đoạn trưởng thành (DCR-TT)
Dependent variable: DCR-TT Factors: X2; X2^2
Estimated Regression Model (Maximum Likelihood)
Analysis of Deviance
Source
Deviance
Df
P
-
Value
Model 122,87 2 0,0000
Residual 137,325 197 0,9996
Total (corr.) 260,195 199
Likelihood Ratio Tests
Percentage of deviance explained by model = 47,2224
Adjusted percentage = 44,9164
Phụ lục 9. Phân tích ảnh hưởng của độ pH đất (X2) đến xác suất bắt gặp vên vên
(1) Đối với cấp tuổi 1 (VeV1)
Dependent variable: VeV1 Factors: X2; X2^2
Estimated Regression Model (Maximum Likelihood)
Factor
Chi
-
Squared
Df
P
-
Value
X2 88,0425 1 0,0000
X2^2 97,6642 1 0,0000
Standard
Estimated
Parameter
Estimate
Error
Odds Ratio
CONSTANT -45,21 9,54237
X2 16,8791 3,29814 2,14034E7
X2^2 -1,50731 0,282384 0,221505
Factor
Chi
-
Squared
Df
P
-
Value
X2 142,635 1 0,0000
X2^2 149,941 1 0,0000
Standard
Estimated
Parameter
Estimate
Error
Odds Ratio
CONSTANT -25,5576 3,20976
X2 10,2675 1,17659 28782,4
X2^2 -0,969078 0,107509 0,379433
Factor
Chi
-
Squared
Df
P
-
Value
X2 218,778 1 0,0000
X2^2 235,986 1 0,0000
Standard
Estimated
Parameter
Estimate
Error
Odds Ratio
CONSTANT -30,8494 5,89782
X2 11,4562 1,95728 94489,3
X2^2 -0,985671 0,158039 0,373189
Factor
Chi
-
Squared
Df
P
-
Value
X2 122,092 1 0,0000
X2^2 122,214 1 0,0000
Standard
Estimated
Parameter
Estimate
Error
Odds Ratio
Forestry.tk Phạm Văn Hường
Analysis of Deviance
Sou
rce
Deviance
Df
P
-
Value
Model 123,567 2 0,0000
Residual 148,55 197 0,9959
Total (corr.) 272,117 199
Likelihood Ratio Tests
Percentage of deviance explained by model = 45,4095
Adjusted percentage = 43,2046
(2) Đối với cấp tuổi 2 (VeV2)
Dependent variable: VeV2 Factors: X2; X2^2
Estimated Regression Model (Maximum Likelihood)
Analysis of Deviance
Source
Deviance
Df
P
-
Value
Model 98,4576 2 0,0000
Residual 178,801 197 0,8194
Total (corr.) 277,259 199
Likelihood Ratio Tests
Percentage of deviance explained by model = 35,5111
Adjusted percentage = 33,347
Phụ lục 10. Phân tích ảnh hưởng của độ tàn che tán rừng (X3) đến xác suất bắt
gặp dầu song nàng
(1) Đối với cấp tuổi 1 (DSN1)
Dependent variable: DSN1 Factors: X3; X3^2
Estimated Regression Model (Maximum Likelihood)
Analysis of Deviance
Source
Deviance
Df
P
-
Value
Model 59,1933 2 0,0000
Residual 201,002 197 0,4076
Total (corr.) 260,195 199
Likelihood Ratio Tests
Percentage of deviance explained by model = 22,7496
Adjusted percentage = 20,4436
(2) Đối với cấp tuổi 2 (DSN2)
Dependent variable: DSN2 Factors: X3; X3^2
Estimated Regression Model (Maximum Likelihood)
Analysis of Deviance
Source
Deviance
Df
P
-
Value
Model 57,9568 2 0,0000
Residual 214,16 197 0,1910
Total (corr.) 272,117 199
Likelihood Ratio Tests
CONSTANT -75,1963 19,899
X2 27,5618 7,17557 9,33138E11
X2^2 -2,48424 0,644461 0,0833888
Factor
Chi
-
Squared
Df
P
-
Value
X2 116,249 1 0,0000
X2^2 121,993 1 0,0000
Standard
Estimated
Parameter
Estimate
Error
Odds Ratio
CONSTANT -29,9355 6,4618
X2 10,8836 2,14909 53295,4
X2^2 -0,949293 0,176551 0,387015
Factor
Chi
-
Squared
Df
P
-
Value
X2 95,5365 1 0,0000
X2^2 98,3888 1 0,0000
Standard
Estimated
Parameter
Estimate
Error
Odds Ratio
CONSTANT -18,3748 3,38108
X3 53,7728 9,42362 2,25541E23
X3^2 -35,8891 6,34225 2,5915E-16
Factor
Chi
-
Squared
Df
P
-
Value
X3 52,2846 1 0,0000
X3^2 46,6263 1 0,0000
Standard
Estimated
Parameter
Estimate
Error
Odds Ratio
CONSTANT -19,0308 3,51788
X3 55,6005 9,7515 1,40274E24
X3^2 -37,6653 6,56593 4,38704E-17
Factor
Chi
-
Squared
Df
P
-
Value
X3 55,4132 1 0,0000
Forestry.tk Phạm Văn Hường
Percentage of deviance explained by model = 21,2985
Adjusted percentage = 19,0936
(3) Đối với toàn bộ giai đoạn tái sinh (DSN-TS)
Dependent variable: DSN -TS
Factors: X3; X3^2
Estimated Regression Model (Maximum Likelihood)
Analysis of Deviance
Source
Deviance
Df
P
-
Value
Model 116,191 2 0,0000
Residual 417,902 397 0,2258
Total (corr.) 534,093 399
Likelihood Ratio Tests
Percentage of deviance explained by model = 21,7548
Adjusted percentage = 20,6314
(4) Đối với giai đoạn trưởng thành (DSN-TT)
Dependent variable: DSN-TT Factors: X3; X3^2
Estimated Regression Model (Maximum Likelihood)
Analysis of Deviance
Source
Devian
ce
Df
P
-
Value
Model 84,8457 2 0,0000
Residual 162,795 197 0,9641
Total (corr.) 247,64 199
Likelihood Ratio Tests
Percentage of deviance explained by model = 34,2617
Adjusted percentage = 31,8388
Phụ lục 11. Phân tích ảnh hưởng của độ tàn che rừng XS bắt gặp dầu con rái
(1) Đối với cấp tuổi 1 (DCR1)
Dependent variable: DCR1 Factors: X3; X3^2
Estimated Regression Model (Maximum Likelihood)
Analysis of Deviance
Source
Deviance
Df
P
-
Value
Model 32,9931 2 0,0000
Residual 244,266 197 0,0123
Total (corr.) 277,259 199
Likelihood Ratio Tests
X3^2 51,4765 1 0,0000
Standard
Estimated
P
arameter
Estimate
Error
Odds Ratio
CONSTANT -18,5788 2,42187
X3 54,3124 6,72779 3,86897E23
X3^2 -36,5179 4,52738 1,3819E-16
Factor
Chi
-
Squared
Df
P
-
Value
X3 107,38 1 0,0000
X3^2 97,7954 1 0,0000
Standard
Estimated
Parameter
Estimate
Error
Odds Ratio
CONSTANT -26,6139 5,03264
X3 72,6134 13,3526 3,43237E31
X3^2 -45,7579 8,59809 1,34149E-20
Factor
Chi
-
Squared
Df
P
-
Value
X3 53,5898 1 0,0000
X3^2 43,9433 1 0,0000
Standard
Estimated
Parame
ter
Estimate
Error
Odds Ratio
CONSTANT -12,3204 2,64611
X3 37,2293 7,62826 1,47391E16
X3^2 -26,2401 5,32374 4,01845E-12
Factor
Chi
-
Squared
Df
P
-
Value
Forestry.tk Phạm Văn Hường
Percentage of deviance explained by model = 11,8997
Adjusted percentage = 9,73571
(2) Đối với cấp tuổi 2 (DCR2)
Dependent variable: DCR2 Factors: X3; X3^2
Estimated Regression Model (Maximum Likelihood)
Analysis of Deviance
Source
Deviance
Df
P
-
Value
Model 46,8739 2 0,0000
Residual 228,763 197 0,0600
Total (corr.) 275,637 199
Likelihood Ratio Tests
Percentage of deviance explained by model = 17,0057
Adjusted percentage = 14,8289
(3) Đối với toàn bộ giai đoạn tái sinh (DCR-TS)
Dependent variable: DCR-TS Factors: X3; X3^2
Estimated Regression Model (Maximum Likelihood)
Analysis of Deviance
Source
Deviance
Df
P
-
Value
Model 78,0601 2 0,0000
Residual 475,647 397 0,0040
Total (corr.) 553,707 399
Likelihood Ratio Tests
Percentage of deviance explained by model = 14,0977
Adjusted percentage = 13,0141
(4) Đối với giai đoạn trưởng thành (DCR-TT)
Dependent variable: DCR-TT Factors: X3; X3^2
Estimated Regression Model (Maximum Likelihood)
Analysis of Deviance
Source
Deviance
Df
P
-
Value
Model 48,5148 2 0,0000
Residual 211,68 197 0,2250
Total (corr.) 260,195 199
Likelihood Ratio Tests
Percentage of deviance explained by model = 18,6456
Phụ lục 12. Phân tích ảnh hưởng của độ tàn che đến xác suất bắt gặp vên vên
(1) Đối với cấp tuổi 1 (VeV1)
Dependent variable: VeV1 Factors: X3; X3^2
Estimated Regression Model (Maximum Likelihood)
Analysis of Deviance
Source
Deviance
Df
P
-
Value
Model 57,786 2 0,0000
Residual 214,331 197 0,1888
Total (corr.) 272,117 199
X3 32,9828 1 0,0000
X3^2 32,2291 1 0,0000
Standard
Estimated
Parameter
Estimate
Error
Odds Ratio
CONSTANT -16,3844 3,21753
X3 47,8804 8,97664 6,22564E20
X3^2 -32,6183 6,08996 6,82441E-15
Factor
Chi
-
Squared
Df
P
-
Value
X3 45,2592 1 0,0000
X3^2 42,2914 1 0,0000
Standard
Estimated
Parameter
Estimate
Error
Odds Ratio
CONSTANT -14,0972 2,0412
X3 41,8736 5,79097 1,53268E18
X3^2 -28,9913 3,98672 2,5658E-13
Factor
Chi
-
Squared
Df
P
-
Value
X3 77,1239 1 0,0000
X3^2 73,5332 1 0,0000
Standard
Estimated
Pa
rameter
Estimate
Error
Odds Ratio
CONSTANT -15,3489 3,00138
X3 45,0979 8,46861 3,85264E19
X3^2 -30,0178 5,75998 9,19241E-14
Factor
Chi
-
Squared
Df
P
-
Value
X3 41,3321 1 0,0000
X3^2 36,2348 1 0,0000
Standard
Estimated
Parameter
Estimate
Error
Odds Ratio
CONSTANT -27,058 5,6281
X3 74,2638 14,8938 1,78802E32
X3^2 -49,4878 9,71805 3,21914E-22
Forestry.tk Phạm Văn Hường
Likelihood Ratio Tests
Percentage of deviance explained by model = 21,2357
Adjusted percentage = 19,0308
(2) Đối với cấp tuổi 2 (VeV2)
Dependent variable: VeV2 Factors: X3; X3^2
Estimated Regression Model (Maximum Likelihood)
Analysis of Deviance
Source
Deviance
Df
P
-
Value
Model 44,8543 2 0,0000
Residual 232,405 197 0,0427
Total (corr.) 277,259 199
Likelihood Ratio Tests
Percentage of deviance explained by model = 16,1778
Adjusted percentage = 14,0137
(3) Đối với toàn bộ giai đoạn tái sinh (VeV-TS)
Dependent variable: VeV-TS Factors: X3; X3^2
Estimated Regression Model (Maximum Likelihood)
Analysis of Deviance
Source
Deviance
Df
P
-
Value
Model 50,179 2 0,0000
Residual 279,759 235 0,0240
Total (corr.) 329,938 237
Likelihood Ratio Tests
Percentage of deviance explained by model = 15,2086
Adjusted percentage = 13,3901
(4) Đối với cây trưởng thành (VeV-TT)
Dependent variable: VeV-TT Factors: X3; X3^2
Estimated Regression Model (Maximum Likelihood)
Analysis of Deviance
Source
Deviance
Df
P
-
Value
Model 47,3205 2 0,0000
Residual 222,674 197 0,1012
Total (corr.) 269,995 199
Likelihood Ratio Tests
Percentage of deviance explained by model = 17,5264
Adjusted percentage = 15,3042
Phụ lục 13. Phân tích ảnh hưởng tổng hợp của X1 với X2 đến XS bắt gặp dầu
song nàng tái sinh
Factor
Chi
-
Squared
Df
P
-
Value
X3 56,4652 1 0,0000
X3^2 53,6307 1 0,0000
Standard
Estimated
Parameter
Estimate
Error
Odds Ratio
CONSTANT -17,794 3,72089
X3 49,6755 10,0779 3,74813E21
X3^2 -33,0021 6,68677 4,64919E-15
Factor
Chi
-
Squared
Df
P
-
Value
X3 41,3131 1 0,0000
X3^2 37,66 1 0,0000
Standard
Estimated
Parameter
Estimate
Error
Odds Ratio
CONSTANT -18,0523 3,57508
X3 50,4791 9,55822 8,37134E21
X3^2 -33,6361 6,28173 2,46621E-15
Factor
Chi
-
Squared
Df
P
-
Value
X3 48,5127 1 0,0000
X3^2 45,4233 1 0,0000
Standard
Estimated
Parameter
Estimate
Error
Odds Ratio
CONSTANT -16,1474 3,30091
X3 45,687 9,07851 6,94405E19
X3^2 -29,9379 6,07228 9,95681E-14
Factor
Chi
-
Squared
Df
P
-
Value
X3 38,903 1 0,0000
X3^2 33,7766 1 0,0000
Forestry.tk Phạm Văn Hường
Dependent variable: DSN_TS Factors: X1; X2; X1^2; X2^2
Estimated Regression Model (Maximum Likelihood)
Analysis of Deviance
Source
Deviance
Df
P
-
Value
Model 248,761 4 0,0000
Residual 285,332 395 1,0000
Total (corr.) 534,093 399
Likelihood Ratio Tests
Percentage of deviance explained by model = 46,5763
Adjusted percentage = 44,704
Phụ lục 14. Phân tích ảnh hưởng tổng hợp của X1 với X2 đến XS bắt gặp DSN-
TT
Dependent variable: DSN_TT Factors: X1; X2; X1^2; X2^2
Estimated Regression Model (Maximum Likelihood)
Analysis of Deviance
Source
Deviance
Df
P
-
Value
Model 131,791 4 0,0000
Residual 115,849 195 1,0000
Total (corr.) 247,64 199
Likelihood Ratio Tests
Percentage of deviance explained by model = 53,2187
Adjusted percentage = 49,1806
Phụ lục 15. Phân tích ảnh hưởng tổng hợp của X1 với X3 đến XS bắt gặp DSN-
TS
Dependent variable: DSN_TS Factors: X1; X3; X1^2; X3^2
Estimated Regression Model (Maximum Likelihood)
Likelihood Ratio Tests
Standard
Estimated
Parameter
Estimate
Error
Odds Ratio
CONSTANT -29,3702 3,95026
X1 0,111477 0,111462 1,11793
X2 9,77148 1,46484 17526,8
X1^2 -0,000748934 0,000762179
0,999251
X2^2 -0,868214 0,119168 0,4197
Factor
Chi
-
Squared
Df
P
-
Value
X1 0,997293 1 0,3180
X2 79,0663 1 0,0000
X1^2 0,964326 1 0,3261
X2^2 92,9551 1 0,0000
Standard
Estimated
Parameter
Estimate
Error
Odds Ratio
CONSTANT -61,0997 11,9773
X1 0,295457 0,203551 1,34374
X2 17,1541 3,97981 2,81793E7
X1^2 -0,00191853 0,00137352 0,998083
X2^2 -1,37691 0,306105 0,252356
Factor
Chi
-
Squared
Df
P
-
Value
X1 2,19657 1 0,1383
X2 42,5202 1 0,0000
X1^2 2,01518 1 0,1557
X2^2 44,4259 1 0,0000
Standard
Estimated
P
arameter
Estimate
Error
Odds Ratio
CONSTANT -29,1028 3,5379
X1 0,473531 0,0938498 1,60565
X3 39,8324 8,18733 1,99068E17
X1^2 -0,00352881 0,000632404 0,996477
X3^2 -25,2078 5,41837 1,12826E-11
Factor
Chi
-
Squared
Df
P
-
Value
X1 27,2709 1 0,0000
X3 26,6121 1 0,0000