2006 results and outlook for 2007 holcim switzerland
Bạn đang xem bản rút gọn của tài liệu. Xem và tải ngay bản đầy đủ của tài liệu tại đây (1.92 MB, 41 trang )
©2007 Holcim/Switzerland
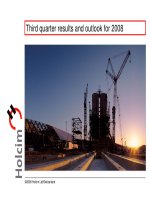
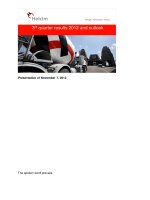
2006 results and outlook for 2007
1
2006 results©2007 Holcim/Switzerland
Key facts at a glance
Record result and strong organic growth
Stake in Ambuja Cements strengthens position in India
Acquisitions in USA and UK underline significance of
aggregates segment
Growth in all Group regions
Innovation in terms of markets, products and processes
Recognition as leader in area of sustainable development
Proposal for higher dividend
2
2006 results©2007 Holcim/Switzerland
Facts on Europe
Healthy order books in construction sector
Substantially higher cement sales in several markets
Volumes of aggregates and ready-mix concrete up
Improved prices and greater efficiency
Operating EBITDA increases by 22.5 percent
Internal operating EBITDA growth of 14.9 percent
3
2006 results©2007 Holcim/Switzerland
Facts on North America
Solid demand in infrastructure and commercial construction,
residential construction weak
Local cement production up
Meyer Material strengthens aggregates and ready-mix
concrete
Holcim US and St. Lawrence Cement post record results
Operating EBITDA 11.3 percent higher
Internal operating EBITDA growth of 11.7 percent
4
2006 results©2007 Holcim/Switzerland
Facts on Latin America
Domestic demand and exports accelerate growth
Higher cement sales volumes posted by all companies
Strong increase in aggregates and ready-mix concrete
Some significantly higher results seen thanks to better prices
Operating EBITDA up by 10.5 percent
Internal operating EBITDA growth of 10.4 percent
5
2006 results©2007 Holcim/Switzerland
Facts on Africa Middle East
Economic environment intact, and generally sound construction
activity
Cement deliveries up significantly in some cases
Increase in volumes of aggregates and ready-mix concrete
sold
With the exception of Holcim Lebanon, better results achieved
Operating EBITDA 12.7 percent higher
Internal operating EBITDA growth of 17.8 percent
6
2006 results©2007 Holcim/Switzerland
Facts on Asia Pacific
Huge demand for infrastructure and residential construction
Strong rise in cement sales thanks to new consolidation of
ACC/Ambuja Cements in India
New consolidations lift ready-mix concrete deliveries
Several Group companies achieve better results
Operating EBITDA increases 139.6 percent
Internal operating EBITDA growth of 5.3 percent
7
2006 results©2007 Holcim/Switzerland
Key financial figures
1
adjusted in line with revised IFRS
2
before goodwill amortization
3
proposal of the board of directors
LFL CIS FX in CHF
Net sales 13,215 18,468 23,969 9.0% 19.5% 1.3% 29.8%
Operating EBITDA 3,588 4,627 6,086 13.2% 17.5% 0.8% 31.5%
Operating profit 2,511
2
3,316 4,385 17.0% 14.6% 0.6% 32.2%
Net income 1,128 1,789 2,719 0.7% 52.0%
Cash flow from
operating activities
2,622 3,405 4,423 20.4% 8.6% 0.9% 29.9%
EPS in CHF 4.21 6.61 8.64 0.9% 30.7%
Dividend per share
in CHF 1.25 1.65 2.00
3
21.2%
Dividend payment
286 382 509
3
33.2%
Million CHF
+/-
2004
1
2005
1
2006
8
2006 results©2007 Holcim/Switzerland
Major changes in the scope of consolidation
Effective as at
+ Aggregate Industries, UK/US March 21, 2005
+ Ambuja Cement Eastern, India April 11, 2005
+ ACC, India January 24, 2006
+ Gujarat Ambuja Cements, India May 3, 2006
+ Meyer Material, US July 21, 2006
+ Foster Yeoman, UK September 7, 2006
+/– Various smaller companies
9
2006 results©2007 Holcim/Switzerland
Exchange rates
Statement of income
average exchange rates in CHF
2004 2005 2006 +/-
1 EUR 1.54 1.55 1.58 1.9%
1 GBP 2.27 2.27 2.31 1.8%
1 USD 1.24 1.25 1.25 0.0%
1 LATAM Basket (MXN, BRL, ARS, CLP)
1
0.94 1.00 1.02 2.0%
1 African Basket (EGP, ZAR, MAD)
1
0.98 1.00 0.97 -3.0%
1 Asian Basket (AUD, IDR, INR, THB, PHP)
1
1.00 1.00 1.05 5.0%
Balance sheet
exchange rates in CHF
31/12/04 31/12/05 31/12/06 +/-
1 EUR 1.55 1.56 1.61 3.2%
1 GBP 2.18 2.26 2.40 6.2%
1 USD 1.14 1.32 1.22 -7.6%
1 LATAM Basket (MXN, BRL, ARS, CLP)
1
0.82 1.00 0.92 -8.0%
1 African Basket (EGP, ZAR, MAD)
1
0.96 1.00 0.89 -11.0%
1 Asian Basket (AUD, IDR, INR, THB, PHP)
1
0.90 1.00 1.02 2.0%
1
weighted by net sales full year 2005
10
2006 results©2007 Holcim/Switzerland
Exchange rates – Translation gains / losses
Million CHF
2004
1
2005
1
2006
Net sales -392 189 246
Operating EBITDA -127 55 39
Operating profit -82 42 22
Net income - equity holders of Holcim Ltd -31 25 16
Cash flow from operating activities -83 38 30
Total shareholders' equity -586 1,474 -619
Net financial debt -465 1,070 11
1
adjusted in line with revised IFRS
11
2006 results©2007 Holcim/Switzerland
Currency sensitivity
USD sensitivity
Million CHF
USD/CHF
at 1.25
USD/CHF
at 1.24
+/-
Net sales 23,969 23,935 -34
Operating EBITDA 6,086 6,077 -9
Net income 2,719 2,719 0
Cash flow from operating activities 4,423 4,418 -5
Euro sensitivity
Million CHF
Euro/CHF
at 1.58
Euro/CHF
at 1.57
+/-
Net sales 23,969 23,946 -23
Operating EBITDA 6,086 6,081 -5
Net income 2,719 2,706 -13
Cash flow from operating activities 4,423 4,418 -5
12
2006 results©2007 Holcim/Switzerland
Cement – sales volumes by region
Δ
2005/2006 LFL Change in
structure
Total
Europe 3.5% 0.0% 3.5%
North America -2.7% 0.0% -2.7%
Latin America 9.3% 0.0% 9.3%
Africa Middle East 6.1% -2.7% 3.4%
Asia Pacific -2.8% 93.1% 90.3%
Total 3.2% 24.0% 27.2%
17.7
18.2
17.5
32.9
31.8
30.8
55.0
28.9
25.8
15.3
14.8
14.0
25.9
20.6
23.7
Total Group
2004 102.1
2005 110.6
2006 140.7
Million t
13
2006 results©2007 Holcim/Switzerland
Aggregates – sales volumes by region
Δ
2005/2006 LFL Change in
structure
Total
Europe 5.0% 14.7% 19.7%
North America -13.8% 14.0% 0.2%
Latin America 8.5% 0.0% 8.5%
Africa Middle East 15.5% 0.0% 15.5%
Asia Pacific -3.1% 3.1% 0.0%
Total -1.5% 12.3% 10.8%
65.165.0
21.2
95.4
79.7
57.8
3.23.2
4.1
11.2
9.7
9.0
12.7
12.1
11.7
Total Group
2004 104.2
2005 169.3
2006 187.6
Million t
14
2006 results©2007 Holcim/Switzerland
Ready-mix concrete and asphalt – sales volumes
13.3
15.3
29.3
38.2
44.2
0.2
2004 2005 2006
+23.9%
+15.0%
+30.4%
Ready-mix concrete in million m
3
Asphalt in million t
+15.7%
+8.5%
15
2006 results©2007 Holcim/Switzerland
23,969
18,468
13,215
2004 2005 2006
Net sales
Like-for-Like (LFL) 908 7.2% 1,329 10.1% 1,647 9.0%
Change in structure 99 0.8% 3,735 28.2% 3,608 19.5%
Forex movements -392 -3.1% 189 1.5% 246 1.3%
Total change 615 4.9% 5,253 39.8% 5,501 29.8%
Million CHF
16
2006 results©2007 Holcim/Switzerland
Net sales by region
Δ
2005/2006 LFL Change in
structure
Currency Total
Europe 8.0% 13.0% 2.2% 23.2%
North America 6.5% 8.4% 2.4% 17.3%
Latin America 14.6% 0.4% 1.4% 16.4%
Africa Middle East 16.0% -1.5% -3.1% 11.4%
Asia Pacific 5.9% 101.3% 0.2% 107.4%
Total 9.0% 19.5% 1.3% 29.8%
5520
4704
2630
3675
3158
2785
8673
4744
7037
1540
1873
2086
4745
2288
1945
2004
2005
2006
Million CHF
17
2006 results©2007 Holcim/Switzerland
North America
22.3%
Europe
35.1%
Asia Pacific
19.2%
Africa Middle East
8.5%
Latin America
14.9%
Net sales by region
Net sales 2006
18
2006 results©2007 Holcim/Switzerland
3,588
4,627
6,086
27.2%
25.1%
25.4%
26.0%
2004 2005 2006
Operating EBITDA
Margin
Like-for-Like (LFL) 376 11.4% 377 10.5% 611 13.2%
Change in structure 28 0.8% 607 16.9% 809 17.5%
Forex movements -127 -3.8% 55 1.6% 39 0.8%
Total change 277 8.4% 1,039 29.0% 1,459 31.5%
1
margin on a like-for-like basis
Million CHF
1
19
2006 results©2007 Holcim/Switzerland
Operating EBITDA by region
Δ
2005/2006 LFL Change in
structure
Currency Total
Europe 14.9% 5.3% 2.3% 22.5%
North America 11.7% -2.4% 2.0% 11.3%
Latin America 10.4% 0.1% 0.0% 10.5%
Africa Middle East 17.8% -2.8% -2.3% 12.7%
Asia Pacific 5.3% 134.7% -0.4% 139.6%
Total 13.2% 17.5% 0.8% 31.5%
1033
551
928
1244
1126
1095
1966
1202
1605
692
614
483
1366
570
465
Million CHF
2004*
2005
2006
*
adjusted to exclude certain Group charges
20
2006 results©2007 Holcim/Switzerland
6.0%
6.2%
5.3%
6.3%
6.8% 7.5%
0%
10%
2001 2002 2003 2004 2005 2006
0
200
400
600
800
1'000
1'200
1'400
32.6%
31.4%
30.7%
31.4%
32.3%
28.9%
20%
30%
2001 2002 2003 2004 2005 2006
0
2'000
4'000
6'000
Operating EBITDA margin target by segment
Cement and Mineral
Components: 33 %
20.7%
20.2%
20.9%
20.6%
20.4%
21.2%
0%
10%
20%
30%
2001 2002 2003 2004 2005 2006
0
200
400
600
800
1'000
1'200
1'400
Aggregates: 27 %
Other Construction Materials
and Services: 8 %
% of net sales
in million CHF
% of net sales
in million CHF
% of net sales
in million CHF
21
2006 results©2007 Holcim/Switzerland
4,385
3,316
2,511
18.3%
18.0%
19.0%
19.3%
2004 2005 2006
Operating profit
Like-for-Like (LFL) 416 19.3% 401 16.0% 564 17.0%
Change in structure 20 0.9% 362 14.4% 483 14.6%
Forex movements -82 -3.8% 42 1.7% 22 0.6%
Total change 354 16.4% 805 32.1% 1,069 32.2%
Margin
Million CHF
1
margin on a like-for-like basis
2
before goodwill amortization
1
2
22
2006 results©2007 Holcim/Switzerland
Operating profit by region
993
866
849
1402
1125
850
602
524
403
933
362
271
Δ
2005/2006 LFL Change in
structure
Currency Total
Europe 19.4% 2.8% 2.4% 24.6%
North America 13.1% -9.4% 2.2% 5.9%
Latin America 14.9% 0.1% -0.3% 14.7%
Africa Middle East 20.3% -2.9% -2.5% 14.9%
Asia Pacific 11.0% 147.5% -0.8% 157.7%
Total 17.0% 14.6% 0.6% 32.2%
Million CHF
677
639
366
*
before goodwill amortization and adjusted to exclude certain Group charges
2004*
2005
2006
23
2006 results©2007 Holcim/Switzerland
Group net income
2,719
1,789
1,128
2,104
1,511
889
2004 2005 2006
Net income
Net income - equity holders of Holcim Ltd
+30.4%
+39.2%
+21.6%
+52.0%
1
1
+66.0%
+55.7%
Million CHF
1
adjusted in line with revised IFRS
24
2006 results©2007 Holcim/Switzerland
4,423
3,405
2,622
18.5%
18.4%
19.8%
20.4%
2004 2005 2006
Cash flow from operating activities
Million CHF
Like-for-Like (LFL) 62 2.4% 244 9.3% 695 20.4%
Change in structure 24 0.9% 501 19.2% 293 8.6%
Forex movements -83 -3.2% 38 1.4% 30 0.9%
Total change 3 0.1% 783 29.9% 1,018 29.9%
Margin
1
margin on a like-for-like basis
1