Dynamic Mechanical Analysis part 7 docx
Bạn đang xem bản rút gọn của tài liệu. Xem và tải ngay bản đầy đủ của tài liệu tại đây (224.27 KB, 13 trang )
©1999 CRC Press LLC
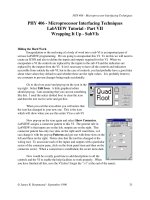
FIGURE 5.14 Crystal–crystal slip. The alpha star transition, T
a
*, in polypropylene corresponding to a crystal–crystal slip in the polymer.
©1999 CRC Press LLC
FIGURE 5.15 The heat-set temperature by (a) TMA, (b) CGL, and (c) DMA.
©1999 CRC Press LLC
the melting peak, and enthalpy as the material changes,
48
resulting from changes in
the polymer molecular weight and crystallinity.
Degradation, polymer structure, and environmental effects all influence what
changes occur. Polymers that degrade by cross-linking will look very different from
those that exhibit chain scissoring. Very highly cross-linked polymers will not melt,
as they are unable to flow.
The study of polymer melts and especially their elasticity was one of the areas
that drove the development of commercial DMAs. Although we see a decrease in
the melt viscosity as temperature increases, the DMA is most commonly used to
measure the frequency dependence of the molten polymer as well as its elasticity.
The latter property, especially when expressed as the normal forces, is very important
in polymer processing. These topics will be discussed in detail in Chapter 7.
5.7 FREQUENCY DEPENDENCIES IN TRANSITION
STUDIES
We have neglected to discuss either the choice of a testing frequency or its effect
on the resulting data. While most of our discussion on frequency will be in Chapter
7, a short discussion of how frequencies are chosen and how they affect the mea-
surement of transitions is in order. If we consider that higher frequencies induce
more elastic-like behavior, we can see that there is some concern a material will act
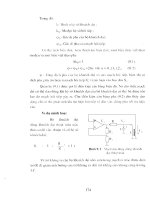
FIGURE 5.16 The terminal zone or melting region follows the rubbery plateau and is
sensitive to the M
w
of the polymer. (Used with permission of Rheometric Scientific, Piscat-
away, NJ.)
©1999 CRC Press LLC
stiffer than it really is at high test frequencies. Frequencies for testing are normally
chosen by one of three methods.
The most scientific method would be to use the frequency of the stress or strain
that the material is exposed to in the real world. However, this is often outside of
the range of the available instrumentation. In some cases, the test method or the
industry standard sets a certain frequency and this frequency is used. Ideally, a
standard method like this is chosen so that the data collected on various commercial
instruments can be shown to be compatible. Some of the ASTM methods for DMA
are listed in Table 5.1. Many industries have their own standards, so it is important
to know whether the data is expected to match a Mil-spec, an ASTM standard, or
a specific industrial test. Finally, one can arbitrarily pick a frequency. This is done
more often than not, so that 1 Hz and 10 rad/s are often used. As long as the data
are run under the proper conditions, they can be compared to highlight material
differences. This requires that frequency, stresses, and the thermal program be the
same for all samples in the data set.
TABLE 5.1
ASTM Tests for the DMA
This list of ASTM methods was supplied courtesy of Dr. Alan Riga. (Used with permission of
Rheometric Scientific, Piscataway, NJ.)
©1999 CRC Press LLC
So what is the effect of frequency on transitions? Briefly, lowering the frequency
shifts the temperature of a transition to a lower temperature (Figure 5.17a). At one
time, it was suggested that multiple frequencies could be used and the T
g
should
then be determined by extrapolation to 0 Hz. This was never really accepted, as it
represented a fairly large increase in testing time for a small improvement in accu-
racy. For most polymer systems, for very precise measurements, one uses a DSC.
Different types of transitions also have different frequency dependencies; McCrum
et al. listed many of these.
10
If one looks at the slope of the temperature dependence
of transitions against frequency, one sees that in many cases the primary transitions
like T
m
and T
g
are less dependent than the secondary transitions (Figure 5.17b).
However, a perusal of McCrum’s data shows this isn’t always true.
5.8 PRACTICE PROBLEMS AND APPLICATIONS
In the above discussion, we have been staying mainly with either a homopolymer
or with a material such as a fiber-filled composite where the filler does not show
transitions. Actual commercial formulations and systems tend to be a bit messier,
and I would like to address some of those issues here.
Many commercial polymers contain modifiers, and fillers
49
that are blended with
the polymer to improve properties and/or to reduce costs. The concentration and
presence of these additives is often best studied by other methods, but DMA lets us
examine their effects on the bulk properties of the polymers. These may show up
as small drops in the storage modulus curve. More likely, the effects are seen as
changes to the strength and temperature of the bulk polymer. For example, changing
the amount of filler or the amount of oil in peanut butter makes noticeable changes
in the DMA scan as shown in Figure 5.18. Adding more filler to a rubber increases
its modulus and improves the material’s resistance to abrasion (Figure 5.18a). Adding
oil to peanut butter softens it and makes it easier to spread (Figure 5.18b). Rigid
PVC is made flexible to improve its resistance to breakage and make the tubing
made from it easier to use (Figure 5.18c). Some of these effects are best seen in
frequency scans and will be discussed in Chapter 7. Sometimes the polymer is added
as a binder to an inorganic material, like the magnetic particles used to make the
magnetic coating on a videotape. This is then coated on a polymer film. The
overlapping transitions are difficult to see, and the uncoated PET film’s data was
subtracted from the coated film to allow detection of the transitions of the binder
(Figure 5.18d).
Many polymers contain a second or third polymer as either a blend (a physical
mixture of materials) or as a copolymer (a chemical mixture). This is done to toughen
a hard, brittle material by adding a quantity of a rubbery material to it. The study
of “rubber-toughened” or just “toughened plastics” is a large and sophisticated area
of research.
50
In the DMA scan, it is often possible to see the transitions of both the
main polymer and of the toughening agent.
For copolymers
51
in the DMA, one sees effects like the T
g
of the copolymer
moving between the extremes of the two homopolymers in relation to the molecular
concentration of the components.
52
These effects are summarized in Figure 5.19,
which shows how copolymers and blends change the T
g
. There is a morphological
©1999 CRC Press LLC
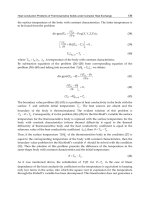
FIGURE 5.18 Effects of additives, fillers, and coatings on polymers. (a) The effect of increasing fill content on a rubber, making it harder.
(Used with the permission of Rheometric Scientific, Piscataway, NJ.) (b) The effect of adding oil to peanut butter to soften it and increase
its spreadability. (Data taken by Dr. Farrell Summers and used with his permission.) Rigid and flexible PVC are shown in (c), where additives
decrease the stiffness of the material. Coating are used to give materials special properties like the magnetic coating applied to PET in (d).
The curve for the coating is obtained by subtracting the PET curve from the coated curve.
η=
()
kM
34,
©1999 CRC Press LLC
FIGURE 5.18 (Condinued).
©1999 CRC Press LLC
However, this is not a common use of the DMA, and it is more common to hold
material under constant dynamic stress at a set temperature under some sort of
special conditions. This condition can simply be elevated temperature where degra-
dation occurs or it can be a special environment, like UV light, solvents, humidity,
or corrosive gases. These conditions are normally chosen to accelerate the degrada-
tion or changes seen in the final use of the material. Figure 5.21 shows the effect
of elevated temperature and a cottonseed–olive oil mixture at 70°C on high-impact
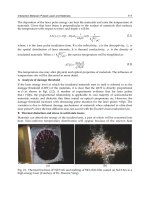
(a)
(b)
FIGURE 5.20 Micro-DMA: (a) a Perkin-Elmer DMA-7 adapted to allow use of a micro-
scope with heated stage and (b) results of mapping the modulus across the thickness of a part.
©1999 CRC Press LLC
polystyrene (HIPS). Other examples include medical-grade polyurethane in saline
or Rykker’s solution, fibers in organic solvents, oil filters in oil, Teflon piping gaskets
and valves at elevated temperatures in crude oil, soft contact lenses in saline under
UV, thermoset composites in high humidity, geotextile fabrics in highly acidic media,
coatings in corrosive gases like H
2
S, human hair coated with hair sprays at elevated
temperature, and photo-curing adhesives in UV. Only a few of these approaches
have been published,
57
since many of the tests are industry-specific. The ability to
get failure data in these diverse conditions while exploring the changes in modulus,
viscosity, and damping during the tests is a uniquely useful strength of DMA.
5.10 CONCLUSIONS
We have intentionally not covered all of the details of the effects of blends, mor-
phology, and additives in order to limit the scope of this chapter to basic topics. Nor
are we going to discuss relaxation spectra or other more advanced topics. In Chapter
8, we will discuss where you can go for more and specialized information. What is
important to realize is that performing time or temperature studies in the DMA on
thermoplastics or cured thermosets allows one to probe the transitions that define
their properties. This is not to suggest that you should throw out your impact or
Izod tester, as the promise of DMA does not always come through. It is to suggest
that more transitions than the T
g
are important for describing behavior in the solid
state. DMA allows you to easily collect data that is difficult or costly by other means.
Now, we need to consider thermosets and their study in the DMA.
NOTES
1. A. Sircar et al., in Assignment of the Glass Transition, R. Seyler, Ed., ASTM,
Philadelphia, 1994, 293.
2. This is a fairly serious concern of a lot of users in practice, though it does not get
discussed in the literature frequently. See for example R. Armstrong, Short Course
in Polymeric Fluids Rheology, MIT, Cambridge, 1990. R. De le Garza, Measurement
of Viscoelastic Properties by Dynamic Mechanical Analysis, Masters thesis, Univer-
sity of Texas at Austin, 1994. R. Hagan, Polymer Testing, 13, 113, 1994.
3. S. Goodkowski and B. Twombly, Thermal Application Notes, Perkin-Elmer, Norwalk,
56, 1994.
4. P. Flory, Principles of Polymer Chemistry, Cornell University Press, Ithaca, NY, 1953.
5. R. Bird, C. Curtis, R. Armstrong, and O. Hassenger, Dynamics of Polymer Fluids,
vol. 1 & 2, 2nd ed., Wiley, New York, 1987.
6. J. D. Ferry, Viscoelastic Properties of Polymers, 3rd ed., Wiley, New York, 1980. J. J.
Aklonis and W. J. McKnight, Introduction to Polymer Viscoelasticity, 2nd ed., Wiley,
New York, 1983.
7. L. C. E. Struik, Physical Aging in Amorphous Polymers and Other Materials, Elsevier,
New York, 1978. L. C. E. Struik, in Failure of Plastics, W. Brostow and R. D.
Corneliussen, Eds., Hanser, New York, 1986, Ch. 11. S. Matsuoka, in Failure of
Plastics, W. Brostow and R. D. Corneliussen, Eds., Hanser, New York, 1986, Ch. 3.
S. Matsuoka, Relaxation Phenomena in Polymers, Hanser, New York, 1992.
6
©1999 CRC Press LLC
Time and Temperature
Studies: Thermosets
This chapter will concentrate on the study of curing systems in the DMA. The fully
cured material was treated in Chapter 5, as the concerns there are the same as for
thermoplastics. However, the interest in studying curing behavior and curing mate-
rials may be even greater. The high sensitivity of the DMA and its ability to measure
viscosity quickly make it one of the most valuable tools for studying curing systems.
I personally have found it more useful even than DSC, although characterizing a
thermoset without having both techniques available would be inefficient at best. In
examining the applications of the DMA to thermosets, we will discuss fingerprinting
materials, curing kinetics, methods of characterization like the Gillham–Enns dia-
gram, post-cure studies, and decomposition studies. This chapter, like Chapter 5,
will concentrate on methods that mainly involve the variation of time and temper-
ature, although a few digressions will occur.
6.1 THERMOSETTING MATERIALS: A REVIEW
Thermosets are materials that change chemically on heating. This can occur in one
step or in several, and those multiple steps do not need to be immediately sequential.
In addition, many processes not normally considered chemical are studied the same
way. Cakes, cookies, eggs, and meat gels (i.e., hot dog batter) are all curing systems.
1
Figure 6.1 shows the DMA scan of a commercial angel food cake batter (a) and an
acrylate resin used as a dental material (b). Despite the great difference in materials,
both curves show similar features and can be analyzed by the same approach. The
same DMA techniques applied to traditional chemical studies can be applied to
problems considered very different from those areas. The materials can even be in
powdered form, as shown in Figure 6.1c, instead of solid disks or liquids. So when
we discuss the cure profile below, it should be remembered that this applies to
epoxies, foods, paints, coatings, and adhesives in a variety of forms. These materials,
even after curing, may change on reheating, as shown by the two scans in Figure
6.1d. So care in analyzing them is required.
Thermosetting reactions can be classed into those that involve the loss of a
molecule on reacting, the condensation resins, and those that join “mers” together
without changes in the repeat structure, the addition condensation reactions.
2
This
classification is based on the reaction mechanism of the polymers and is manifested
in very different kinetics. Figure 6.2 shows the curing of a resin that releases water
in the first stage of its cure and that doesn’t lose a part of the molecule in the second.
The first valley will often show noise, which appears as a very jagged curve, due to
loss of water, while the material in the second valley undergoes chain growth. This
noise is often smoothed out in practice and can be related to the kinetics on a mole
©1999 CRC Press LLC
affects the viscosity of the prepeg (an uncured resin that is impregnated onto the
matrix), as shown in Figure 6.3. After the material is cured to a degree where it can
support its own weight (usually 1
¥
10
6
Pa. s), the item is removed from its mold
or form and post-cured. Post-curing involves heating the free-standing piece in an
oven until full mechanical strength is developed.
Figure 6.4 shows an idealized relationship of degree of cure to
T
g
.
5
Initially, the
material in region 1 is a monomer, and as it begins to cure it continues to act like
a monomer. This continues up to about 35% of cure, when it begins to start devel-
oping polymeric properties. After a transition zone, the relationship levels off and
T
g
tracks well with degree of cure. The point at which the curve levels off to this
slope is sometimes referred to as a critical glass transition temperature,
T
g
c
, and is
where the materials starts showing the properties of a high polymer.
6
At some point,
normally at less than 100% as measured by residual cure energy in the DSC, the
rate of increase of the
T
g
greatly slows or stops increasing and the material has full
mechanical strength. Many physical properties follow this shape of curve when
plotted against molecular weight or degree of cure.
6
For example, in some epoxy-based systems, the cure reaches a point where
increased post-cure time causes little to no increase in either the modulus or
T
g
. At
this point, increased post-curing gives no advantage and only wastes money and
time.
7
In some systems, this occurs as low as 94% of complete cure when measured
by the residue enthalpy of curing in the DSC. Being aware of this value and of
where full mechanical strength is developed is necessary for cost-efficient process
(b) Acrylate resin cure
FIGURE 6.1
(
Continued
).
©1999 CRC Press LLC
design. If we can develop full mechanical strength at 4 hours for the material shown
in Figure 6.5, post-curing for 8 hours would only mean lost profit. As can be seen,
both the
T
g
and the storage modulus (measured at 50
∞
C) level out and do not increase
any more after 3 to 4 hours of post-cure. This might not be true of another property
such as solvent resistance or aging, and that should be checked separately.
6.2 STUDY OF CURING BEHAVIOR IN THE DMA:
CURE PROFILES
The DMA’s ability to give viscosity and modulus values for each point in a
temperature scan allows us to estimate kinetic behavior as a function of viscosity.
This has the advantage of telling us how fluid the material is at any given time,
so we can determine the best time to apply pressure, what design of tooling to
use, and when we can remove the material from the mold. The simplest way to
(c)
FIGURE 6.1
(
Continued
).
©1999 CRC Press LLC
analyze a resin system is to run a plain temperature ramp from ambient to some
elevated temperature.
8
This “cure profile” allows us to collect several vital pieces
of information.
Before we analyze the cure in Figure 6.6 in more detail, we should mention that
in curing studies, all three types of commercial DMAs are used. The shape of curve
and the temperature of events follow the same pattern. The values for viscosity and
modulus often differ greatly. Both types of forced-resonance DMAs also use samples
impregnated into fabrics in techniques that are referred to as “torsion braid.” There
are some problems with this technique, as temperature increases will cause an
apparent curing of nondrying oils as thermal expansion increases friction. However,
the “soaking of resin into a shoelace,” as this technique has been called, allows one
to handle difficult specimens under conditions where the pure resin is impossible to
run in bulk (due to viscosity or evolved volatiles). Composite materials such as
graphite–epoxy composites are sometimes studied in industrial situations as the
composite rather than the “neat” or pure resin because of the concern that the kinetics
may be significantly different. In terms of ease of handling and sample, the composite
is often easier to work with.
(d)
FIGURE 6.1
(
Continued
).