Gear Noise and Vibration Episode 1 Part 3 pptx
Bạn đang xem bản rút gọn của tài liệu. Xem và tải ngay bản đầy đủ của tài liệu tại đây (806.39 KB, 20 trang )
20
Chapter
2
pinion
tip
^
T\\\\\\\x\NX\x^^^^^
relief
roll
roll_
distance"
root
tS
P
pitch
(a)
P°
int
I
pure
involute
or
zero
T.E.
I
positive
metal
I.E.
4
^^
negative metal
(b)
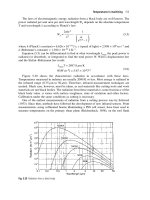
Fig 2.6
Effects
of
mating
two
spur gear profiles, each with
tip
relief.
T.E.
traces
are
conventionally drawn with positive metal giving
an
upward movement
but
when testing experimentally
the
results
can
correspond
to
positive metal either
way so it is
advisable
to
check polarity.
In the
metrology
lab
this
can
simplest
be
done
by
passing
a
piece
of
paper
or
hair
though
the
mesh.
The
combined
effect
of one
pair
of
teeth meshing under
no
load
would
be to
give
a
T.E.
of the
shape shown
in
Fig.
2.6(b)
with about
one
third
of the
total span
following
the
involute
for
both profiles
and
generating
no
error.
The tip
reliefs
then give
a
drop (negative metal)
at
both ends.
The
same
effect
is
obtained
if the
relief
is
solely
on the
pinion
at tip and
root.
However,
the
geometry
is
more complex
at the
root
as the
mating
tip
does
not
penetrate
to the
bottom
of the
machined
flank.
Putting several pairs
of
teeth
in
mesh
in
succession gives
the
effect
shown
in
Fig.
2.7(a).
If
there
are no
pitch
or
profile
errors
and no
load
applied
so no
elastic deflections,
the
central involute sections
will
be at the
same level
(of
"zero" T.E.)
and
part
way
down
the tip
relief there
will
be a
handover
to the
next contacting pair
of
teeth.
One
base pitch
is
then
the
distance
from
handover
to
handover. When
we
measure
T.E.
under
no-load
conditions
we
cannot
see the
parts shown
dashed
since handover
to the
next
pair
of
teeth
has
occurred.
Harris
Mapping
for
Spur Gears
21
pure
involute
or
zero
T.E.
roll
distance
one
base
pitch
Fig
2.7(a)
Effect
on
T.E.
of
handover
to
successive teeth when there
are no
elastic deflections.
pitch
error
roll
distance
zero
T.E.
base
pitch
Fig
2.7(b)
Effect
of
pitch error
on
position
of
handover
and
T.E.
Fig.
2.7(b) shows
the
effect
of a
pitch error which will
not
only give
a
raised section
but
will alter
the
position
at
which
the
handover
from one
pair
to the
next
occurs,
2.4
Effect
of
load
on
T.E.
We
wish
to
predict
the
T.E. under load
as
this
is the
excitation which
will
determine
the
vibration levels
in
operation.
As
soon
as
load
is
applied there
are two
regimes,
one
around
the
pitch
point where only
one
pair
of
teeth
are in
contact
and one
near
the
handover points where there
are two
pairs
in
contact, sharing
the
load
but
not,
in
general,
equally.
The
total load remains constant
so, as we are
taking
the
simplifying
assumption that
stiffness
is
constant,
the
combined deflection
of
the two
pairs
in
contact must equal
the
deflection when just
one
pair
is in
contact.
In
particular, exactly
at the
changeover
points,
the
loads
and
deflections
are
equal
if
there
are no
pitch
errors
so
each contact deflection
should
be
half
the
"single
pair"
value.
22
Chapter
2
pitch
point
\
iefl
z_
I o
X
changeover
point
changeover
point
one
base
pitch
roll
distance
contact
ratio times base
pitch
Fig 2.8
Harris
map of
interaction
of
elastic deflections
and
long
tip
relief.
This explanation
of the
handover
process
was
developed
by
Harris
[3] and the
diagrams
of the
effects
of
varying load
are
termed "Harris
maps."
Fig.
2.8
shows
the
effect.
The top
curve
(n) is the
T.E. under
no
load
and
then
as
load
is
applied
the
double contact regime steadily expands around
the
changeover point. Curve
(h) is the
curve
for
half
"design"
load.
At
a
particular "design
load"
the
effects
of tip
relief
are
exactly cancelled
by the
elastic deflections (curve
d) so
there
is no
T.E. There
is a
downward
deflection
(defl)
away
from the
"rigid pure involute" position but,
as the sum
of tip
relief
and
deflection
is
constant,
it
does
not
cause vibration.
Above
the
"design"
load
the
single contact deflections
are
greater
than
the
combined double contact plus
tip
relief deflections.
The
result
is as
shown
by
curve
(o)
with
a
"positive metal"
effect
at
changeover. Varying
stiffness
throughout
the
mesh alters
the
effects
slightly,
but the
principle
remains.
In
this approach
it
should
be
emphasised that "design" load
is the
load
at
which minimum T.E.
is
required,
not the
maximum applied load
which
may be
much greater.
Since
the
eventual objective
is to
achieve
minimum
T.E. when
the
drive
is
running under load, there
will
normally
be a
desired design T.E.
under
(test)
no-load.
This leads
to the
curious phraseology
of the
"error
in the
transmission
error,"
meaning
the
change
from the
desired
no-load
T.E. which
has
been estimated
to
give
zero-loaded
T.E.
Harris Mapping
for
Spur Gears
23
2.5
Long,
short,
or
intermediate relief
In
1970, Neimann
in
Germany
[4] and
Munro
in the
U.K.
introduced
and
developed
the
ideas
of
"long"
and
"short"
relief designs
for
the two
extreme load
cases
where
the
"design" load
is
full
load
or is
zero load.
Fig.
2.8
shows
the
variation
of
T.E. with load
for a
"long
relief
design"
which
is
aimed
at
producing minimum noise
in the
"design
load"
condition.
Specifying
the tip
relief
profile
begins with determining
the tip
relief
at the
extreme
tip
points
T,
making
the
normal assumptions about overload
due to
misalignment
and
manufacturing
errors.
The
necessary relief
at the
crossover
points
C
(where contact hands over
to the
next pair
of
teeth
at
no-load)
is
half
the
mean
elastic
deflection
and
here
we do not
take manufacturing errors into
account. Typically
the
relief
at T may be 3 to 4
times that
at C. The
crossover points
C are
spaced
one
base pitch apart
and the tip
points
T are
spaced apart
the
contact ratio times
a
base
pitch.
It is, of
course, simplest
if
the tip
reliefs (which should
be
equal)
are
symmetrical.
The
start
of
(linear)
tip
relief
is
then
found
by
extending
TC
backwards till
it
meets
the
pure
involute
at the
point
S.
An
alternative requirement
is to
have
a
design which
is
quiet
at no
load
or a
very light load since this
is
likely
to
occur
for the final
drive
motorway
cruising condition
or
when industrial machinery
is
running light,
as
often
happens.
combined
IE of
one
pairof
teeth
involute
/
n
h
I
[ft
pitch
I /
point
|
T/
changeover
point
one
base
pitch
11
•
,,
,.
.
^
I
contact
ratio
times base
pitch
roll
distance
r
Fig
2.9
Harris
map of
deflections with
a
"short"
tip
relief design.
24
Chapter
2
The
"design" condition
is
zero load
so we
require
"short
relief
as
shown
in
Fig. 2.9, which shows
the
variation
of
T.E. with load
for
"short"
tip
relief.
The
pure involute extends
for the
whole
of a
base pitch
so
there
is no
tip
relief encountered
at all at
light load (n).
The tip
relief
at T
must,
however,
still
allow
for all
deflections
and
errors.
As
load
is
applied
we are
then exceeding
"design"
load
of
zero
and
there
will
be
considerable T.E. with high sections
at the
changeover points.
Curve "ft"
is the
full
torque curve where there
is a
section
at
changeover with
double
contact
and
hence half
the
deflection
(defl)
from the
pure involute that
occurs near
the
pitch points. Palmer
and
Munro
[5]
succeeded
in
getting very
good agreement between predicted
and
measured T.E. under varying load
in a
test
rig to
confirm these predictions.
Care must
be
taken when discussing
"design
load"
in
gearing
to
define
exactly what
is
meant because
one
designer
may be
thinking purely
in
terms
of
strength
so his
"design"
load
will
be the
maximum that
the
drive
can
take.
If,
however, noise
is the
critical factor,
"design
load"
may
refer
to the
condition
where noise
has to be a
minimum
and may be
only
10% of the
permitted
maximum
load.
If the
requirement
is for
minimum noise
at, for
instance, half load, then
the
relief should correspondingly
be a
"medium"
relief.
The
short
or
long descriptions refer
to the
starting position
of the
relief,
but the
amount
of
relief
at the tip of
each tooth remains constant.
Pure involute
Expected single pair
deflection
under
full
load
Previous
pair
Tip
Crossover
position
Fig
2.10 Tooth relief shapes near crossover
for
low, medium,
and
high
values
of
design quiet load
in
relation
to
maximum load.
Harris Mapping
for
Spur Gears
25
Fig.
2.10
shows
for
comparison
the
three shapes
of
relief near
the
crossover point
for the
conditions
of the
design quiet condition being zero,
half
and
full
load.
For
standard gears with
a
contact ratio well below
2 it is
only
possible
to
optimise
for one
"design" condition
but as
soon
as the
contact
ratio
exceeds
2
then there
can be two
conditions
in
which
zero T.E.
is
theoretically attainable.
References
1.
Gregory,
R.W.,
Harris, S.L.
and
Munro,
R.G.,
'Dynamic
behaviour
of
spur
gears.'
Proc.
Inst.
Mech. Eng.,
Vol
178, 1963-64, Part
I, pp
207-226.
2.
Maag Gear Handbook (English version) Maag, CH8023, Zurich,
Switzerland.
3.
Harris, S.L.,
'Dynamic
loads
on the
teeth
of
spur
gears.
1
Proc. Inst.
Mech.
Eng.,
Vol
172, 1958,
pp
87-112.
4.
Niemann,
G. and
Baethge,
J.,
'Transmission
error, tooth
stiffness,
and
noise
of
parallel axis
gears.'
VDI-Z,
Vol 2,
1970,
No 4 and No
8.
5.
Palmer,
D. and
Munro, R.G.,
'Measurements
of
transmission error,
vibration
and
noise
in
spur
gears.'
British Gear Association
Congress, 1995, Suite
45,
IMEX
Park, Shobnall Rd., Burton
on
Trent.
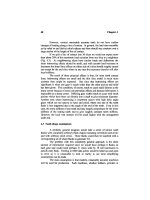
3.1
Elastic averaging
of
T.E.
A
spur gear, especially
if an old
design,
will give
a
T.E. with
a
strong regular excitation
at
once
per
tooth
and
harmonics
(Fig
3.1),
even
when
loaded.
The
idea
of
using
a
helical gear
is
that
if we
think
of a
helical
gear
as a
pack
of
narrow spur gears,
we
average
out the
errors associated with
each
"slice"
via the
elasticity
of the
mesh
by
"staggering"
the
slices.
If
we
have
a
helical gear which
is
exactly
one
axial pitch wide,
the
theoretical length
of the
line
of
contact remains constant. Fig.
3.2(a)
shows
a
true view
of the
pressure plane which
is the 3-D
"unwrapping
band"
that
unreels
from one
base cylinder
and
reels onto
the
other base cylinder.
With
a
spur gear
the
contact
"point"
in end
view, i.e., 2-D, appears
as a
straight line parallel
to the
axis,
but
with
a
helical gear
in
3-D,
the
contact line
is
angled
at the
base helix angle
afc.
As
each section along
the
face
width will
be at a
different
point
in its
once-per-tooth
meshing cycle,
there will
be an
elastic averaging
of
errors giving reduced T.E. Fig.
3.2(b)
shows
that
if the
slices
are
staggered,
the
total amount
of
interference
and
force
remains roughly constant.
In
practice,
using
a
helical gear
is
found
to
improve matters
but not as
much
as
might
be
hoped.
The
idea
is
right
but the
realities complicate
life
since
we can
rarely
get the
axial alignment
of two
helical gears accurate enough. There
are
four
tolerances involved even before
we
start thinking about elastic
effects
on
gear
bodies, supporting
shafts,
bearings
and
casing.
' 1
tooth
'
rotation
Fig 3.1
Typical section
of
T.E.
of
meshing spur gears.
27
28
Chapter
3
pitch
_
line
axial
facewidth
Fig
3.2 (a)
View
of
pressure plane
of
helical gear showing contact lines.
elastic
interference
on
each slice
combined
profile
shape
one
contact
line
position
of
slices
axial facewidth
Fig 3.2 (b)
Total
of
interferences
on
slices along contact lines summing
to a
roughly
steady value.
A
theoretical mean mesh deflection
of
about
15
u,m
(200
N/mm
loading)
may
easily
be
associated with
a 30
um
(1.2
mil) misalignment over
a
150
mm (6
inch)
face
width. Hence
an
angular error
of 2 in
10,000 still gives
100%
overload
at one end and
zero loading
at the
other. With this variation
in
load
the
elastic averaging
effects
along
the
helix
are
much less
effective
and
the
helical gear transmission errors start
to
rise toward
those
of a
spur
gear.
Theoretical Helical
Effects
29
Increasing helix angle
so
that there
are
several axial pitches
in a
face
width
improves
the
elastic averaging
effect
under load
but
penalties exist
in
increased axial loads
and
lower transverse contact ratios.
3.2
Loading along contact
line
Another
major
effect
with
helical
gears
is
indicated
in
Fig.
3.3
which
is
a
view
of a
single tooth
flank
showing
a
contact line across
the
face.
As the
mesh
progresses,
the
contact line comes onto
the
tooth
face
at the
lower right
corner,
extends
and
travels across
the
face,
and
then disappears
off
the top
left
comer.
With this engagement pattern there
is no
longer
the
necessity
to
achieve
a
smooth run-in with
tip
relief because
we can do it
with
end
relief.
In
a
high power gear such
as a
turbine reduction gear
a
typical tooth
face
is
much
wider (axially) than
it is
high. This
can
give
us a
large strength bonus
as the
full
loading
per
unit length
of
line
of
contact
can be
maintained nearly
up
to the
tips
of the
teeth.
tip and
root
relief
limits
/N.
tooth
tip
7
contact
line
__
— —
i
i
tooth
root
start
start
ofend
ofend
relief
relief
Fig 3.3
Theoretical
flank
contact line
on a
helical tooth face.
There
is
less tooth
face
"wasted"
as a
result
of
tapering
in
over
two-
thirds
of a
module
at
each
end of the
tooth, compared with more than
a
module
(in
roll distance)
at top and
bottom
if the
gear
is
designed
as a
spur
gear.
A
chamfer
is
needed
at the
tooth tips
as it is
also needed
at the end
faces
of a
spur gear
to
prevent corner loading which gives very high local
stresses
and
gives
oil film
failure.
This
stress
relief
chamfer
is
small
in
extent
compared with (long)
tip
relief which
can
come
one
third
of the way
down
the
working flank.
30
Chapter
3
maximum
loading
pattern
with
end
relief
maximum
loading
pattern
with
tip
relief
Fig 3.4
Variation
of
loading intensity along contact line with
end and tip
reliefs.
Fig.
3.4
suggests
the
change
in the
shape
of the
load variation curve
in
the two
cases.
With
end
relief there
is
much
fuller
use of the
gear face,
but
the
design then behaves
as an
extremely short relief.
These
ideas
do not
apply
in the
same
way
with
an
automotive
gearbox
as the
teeth
may be as
high (radially)
as
they
are
long.
The
logical extension
of
these
ideas
is to
have neither
tip
relief
or
end
relief
but to use
solely
"corner"
relief with
the
relief restricted
to a
small
area
on the
corner where
the
line
of
contact
first
runs onto
the
flank.
This,
in
theory, gives
the
strongest possible gear
but it is
considerably more expensive
to
manufacture
so is not
popular
because
the
gain
in
strength
is
small. Also,
with
any
design which takes loads right
up to
corners, very great care must
be
taken
to
avoid stress concentration
effects
and oil film
breakdown
effects,
either
of
which
will
have disastrous consequences.
There
is a
difference
between
the use of end
relief
and tip
relief when
it
comes
to
misalignment. Load will
be
thrown onto
one end of the
gear
and
the
effect
will
be
similar
to
having
a
spur gear,
so if a tip
relief design
has
been used
it is
more
likely
to be
quiet
at
higher loads.
If end
relief
has
been
used,
the
profile
will
be
much nearer
a
pure involute
(an
extremely
"short"
relief)
and is
likely
to
give relatively
low
T.E.
at
light loads
but,
correspondingly,
a
higher
T.E.
at
design load.
3.3
Axial forces
Single
helical gears produce axial forces which
for a
given torque
are
proportional
to the
tangent
of the
base helix angle
of the
gears. Axial forces
are
usually coped with easily
in
small gearboxes,
but in
large gearboxes there
Theoretical Helical
Effects
31
are
more likely
to be
bearing limitations
so it is
common
to use
double helical
gears
or
thrust cones
to
take
out the
axial forces. Thrust cones
are not
common
and
require skill
to get the
details right
so
that there
is a
satisfactory
oil
film. The
local rigidity
of the
thrust
flange
must
be
carefully
controlled
or
line contact will occur
and one
gear,
usually
the
pinion must
be
able
to
move
axially
to
accommodate thermal movements.
Low
helix angles
of
less than
10°
give relatively
low
axial forces
so
as the
axial forces
are
about
l/6th
of the
radial
we
would expect little
vibration trouble. Unfortunately, most
gearcases
are
rigid
in the
radial
direction
at the
bearings
but
often
are
relatively
flexible in the
axial direction
at
the
bearings. This means that small forces
may
give disproportionate
vibration. This problem
is
relatively easily identified when
the
drive
is
running
by
mode shape measurements
and can
often
be
solved simply
by
thickening
or
ribbing
the
bearing support plates.
A 10°
base helix angle with
a
4 mm
normal module gear requires
a
minimum
face
width
of
4rc
cos 20
cosec
10° or 68 mm for
good design
so
narrow gears will
be
pushed
to
higher
helix angles.
In
general,
the
most
difficult
helical gears
to
design
are
those
with
narrow
facewidths
well below
any
possible axial pitch.
The
higher axial forces that result with increase
of
helix angle will
increase axial bearing loads
and
axial vibration excitation
for a
given T.E.
In
contrast,
the
higher helix angles will generally reduce T.E.
so it is
extremely
difficult,
if not
impossible,
to
predict whether
or not a
change will give
improvement. Spur gears,
of
course, produce
no
axial excitation
but
usually
have
a
much higher T.E. unless
a
high contact ratio (greater than
2)
design
is
used.
3.4
Position variation
One
possible
cause
of
vibration occurs when
the
force
between
the
gears
is
constant
and
acts
in a
constant direction
but
oscillates sideways. This
is
a
major
cause
of
noise with
Wildhaber-Novikov
or
Circ-Arc
gears
as the
force
application point moves
a
large distance.
Involute
spur gears should
not
suffer
from
this problem
if
well
aligned,
but
helicals
may to a
lesser extent.
If we
take
a
nominal contact ratio
of
r and
look
at the
theoretical contact line lengths,
we get the two
extreme
positions shown
in
Fig. 3.5.
These show
the
pressure plane
for the
worst case with
a
(correct)
face
width
of an
axial pitch
and a
small helix angle. This simple analysis
ignores
any end
relief
effects
or tip
relief
effects
and
assumes
a
constant
loading along
the
contact line. Practical teeth tend
to
give slightly larger
effects.
32
Chapter
3
Pressure
plane
resultant
Fig.
3.5
Extreme positions
of
contact lines
in
pressure plane showing
how the
forces
at the
centres
of
each section
of the
contact line give
a
resultant
force
whose position varies.
The
extreme position
of the
centre
of
action
of the
resultant
force
is
determined
by
taking moments about
one end and is
approximately
(r-l)
2
/2r
+
\!2r
which
is
[(r-l)
2
+l]/2r
from one
end. This
has a
minimum when
r
is
V2
and the
centre
offeree
oscillates about .086
of the
face
width
on
either
side
of the
centre
of the
face.
There
is a
corresponding radial force variation
at the
bearing
housings
of the
order
of 8% of the
mean value when
the
gears
are
well
supported close
in or
less
if the
supporting shafts
are
long. Although this
effect
exists
in
theory
it is
small
and is
dominated
by
axial
force
effects
and
conventional
T.E.
effects.
Tip
relief
has a
further
complicating
effect
since
all
loadings near root
and tip are
reduced
and
with
an
older design there
is a
relatively
concentrated load which runs along
the
pitch
line.
Methods
to
reduce this
effect
have been proposed
(by
Rouverol
[1])
but
the
reduction
in
effective
flank
area
is
significant
and
increases
nominal
stresses
and the
"silhouetting"
takes little account
of the
complexities
of
real
tooth profiles with
tip and end
reliefs. Increasing axial overlap reduces
the
effect
but it is
probably
not
worth considering
for
most gear noise problems.
Theoretical Helical
Effects
33
If,
in
practice, experimental measurements suggested that bearing excitations
at
either
end of a
pinion were
180°
out of
phase, then
the
possibility
of
position variation excitation should
be
checked.
3.5
"Friction
reversal"
and
"contact
shock"
effects
In
the
case
of
spur gears there was,
at one
time,
a
considerable body
of
academic opinion that ascribed much
of the
vibration
of
gears meshing
to
"pitch
line
friction
reversal
excitation."
The
theory
said
that
there
was
effectively
"dry"
friction
between gear teeth
and
that
the
direction
of
relative
sliding
between
the
gear teeth suddenly reversed
at the
pitch point
and
reversed when
one
pair
of
teeth
left
contact
and the
next pair started. This
would
give rise
to a
force
in the
sliding direction with
an
amplitude
of ± the
friction
force
and a
roughly square
waveform
and
much
of
spur gear noise
was
attributed
to
this
effect.
In
addition there were assumed
to be
"sudden"
shocks associated with gear teeth coming into contact
and
taking
up
load.
If
this simple
friction
picture applied then with spur gears under
an
average load equivalent
to 20
ujn
elastic deflection,
a friction
coefficient
of
0.05 would give
an
oscillating
force
which
was
equivalent
to ± 1
um
excitation
in the
sliding direction. Typically, however,
the
T.E. might
be ± 2
(jjn
in the
pressure line direction
and
dominates
the
theoretical
friction
effects.
The
reality
is
considerably more complicated
and the
effects
are
much
smaller
because:
(a) The
effect
of tip
relief
is to
give
a
very gradual increase
in the
force
between
the
teeth extending nearly
to the
point where
the
"friction"
reverses. This relatively
"gradual"
increase
in
force
(along
the
pressure line) gives
a
corresponding gradual increase
in friction
force
unless
specially desiged gears
are
used
to
exaggerate
the
effect.
(b)
The friction is not
"dry"
but
elastohydrodynamic
and so
there
is a
slow
viscous transition through
the
pitch point
as the
velocity
reverses.
This
prevents
the
generation
of
sudden shocks
from
"friction
reversal"
and
experimental investigations during work
on
Smiths shocks could
not
detect
any
such
effects
of
sudden force changes
[2].
Detailed experiments carried
out by
Houser,
Vaishya
and
Sorensen
[3]
using accurate gears varied contact pressure, surface
finish,
lubrication
and
speed
to
investigate excitation
in the
direction normal
to the
line
of
pressure.
The
results showed motions
in
this direction comparable
in
size
to the
vibrations
in the
pressure line direction. Deduction
of the
excitations which
were involved
was
however
difficult
due
partly
to the
inevitable
cross
interactions which occur with
any
bearing system
and
partly
due to the
differences
in
effective
response
stiffnesses
in the
pressure line
and
normal
directions
as
these
can
differ
by a
factor
of
100.
As
might
be
expected
the
34
Chapter
3
tribological
conditions which
are
most likely
to
give either very
thin
oil films
or
limited metal
to
metal contact
are the
conditions which give high
friction
and
associated vibration.
These
conditions should
be
avoided
as far as
possible
in
service
as
they
are
also
the
conditions associated with surface
failure
mechanisms such
as
micropitting.
As
far as
"contact
shocks"
are
concerned, when gears come into
contact there
is a
rather small closing velocity between
the
mating flanks
in
the
normal direction that
is two
orders smaller than
the
sliding
or
rolling
velocities
at the
contact.
With
reasonable
assumptions
about
the tip
relief
shape
the
estimated
stress
wave levels
are
small
so
there
are
negligible
engagement shocks. Typically
50
um
of tip
relief
will
be
taken
up in
about
one
third
of a
tooth interval
so at a
tooth
frequency of 500 Hz the
closing
velocity
v is
about
75
mm/s.
The
corresponding stress wave intensity
[4] is
of
the
order
of E v/c at the
source
and is 210 x
10
9
x
0.075/5000
in
steel
or 3
MPa.
On a
contact area
of 20
mm
2
this
is
only
20 N
compared with
a
typical
force
variation
due to
T.E.
of the
order
of 3 x
10"
6
x
10
9
or 3 kN so it is
negligible.
These theoretical predictions have been borne
out by
practical
measurements
on
extremely quiet
gears
by
Munro
[5] as
well
as by
direct
shock measurements
on
gears during work
on
condition monitoring
[2]
which
showed
no
shocks
at
either entry
or
pitch points when
the
gears
were
operating correctly without asperity contact. Shocks
as
small
as 2 N
occurring
for
only
20
microseconds
could
easily
be
detected
by the
test system
used.
When
we
come
to
helical gears there
are the
same arguments that
the
friction
forces change smoothly rather than abruptly.
In
addition, there
is
the
major
effect
that roughly half
the
contact
is
occurring
on
either side
of the
pitch line
so the
corresponding
friction
forces
are in
opposite directions
and
tend
to
cancel out.
The
combination
of
effects
means that "friction
reversal"
excitation
may be
ignored completely
for
helical gears
and is
small
for
spur
gears.
Similarly,
"contact
shock"
effects
are
negligible
for
spur
gears,
and for
helical
gears, which have
a
very gradual take-up
offeree,
the
effects
are
small
unless there
is
serious misalignment. High contact ratio spur
gears
(see
chapter
13)
have
the
sliding contact
friction
forces opposing
and
cancelling
each other
at all
points
in the
meshing cycle
and so in
theory
can
only
generate
net friction
forces
if
there
are
serious accuracy
errors.
3.6 No
load
condition
It
is
generally
stated
without thought that helical
gears
will always
be
quieter than spur gears
but
this
is a
dangerous assumption.
It is
certainly
true that
if
there
is
good alignment between
the
gear helices
in
position
and
Theoretical
Helical
Effects
35
there
is
high loading then
the
elastic
effects
will
even
out
errors
and the
mesh
will
be
quiet.
In
use
however
gears
are
liable
to be
loaded
to
much lower torques
than their maximum load especially
in
automotive drives
and in
industrial
machinery
may
spend much
of
their working
day
idling. Design loading
is
typically
100 N / mm / mm
facewidth
so for a 2 mm
module gear
the
design
load
would
be 200 N / mm and the
corresponding elastic deflection about
15
^un
(0.6 mil).
At a
typical working condition
of one
third load
the
theoretical
mean deflection
is
only
5
um
so, as it is
very easy
to get
misalignments much
higher than
this,
the
loading
will
be
predominantly
at one end of the
teeth.
Contact
for
only perhaps
a
half
or a
third
of the
facewidth means that
the
theoretical vibration advantages
of
elastic
averaging with helical gears
will
not be
achieved
as the
pair will behave more
as
spur gears though with
a
design
profile
that
has
assumed
full
contact along
the
helix. Problems will
also occur with heavily loaded
gears
that have been designed with high helix
corrections
to get
even loadings
at
full
torque
but
there will
be
little deflection
or
windup
at
light load
so all the
contact
will
be
concentrated
at the
outboard
end of the
teeth
and
there
will
be
little helical averaging
effect.
References
1.
Rouverol,
W.S.
and
Pearce,
W.J.
'The
reduction
of
gear pair
traansmision
error
by
minimising mesh
stiffness
variation.'
AGMA
Paper
88-FTM-l
1.
New
Orleans, October
1988.
2.
Smith, J.D.,
'A
New
Diagnostic Technique
for
Asperity
Contact.'
Tribology
International,
1993.
Vol
26, No
1,
p 25.
3.
Houser,
D.R.,
Vaishya,
M, and
Sorensen,
J.D.
'Vibro-acoustic
effects
of
friction
in
gears:
an
experimental
investigation.
1
A.S.M.E.,
paper
2001-01-1516,
2001.
4.
Roark's Formulas.
6th
edition. Young, W.C., McGraw-Hill,
New
York,
1989, section 15.3.
5.
Munro,
R.G.
and
Yildirim,
N.,
'Some
measurements
of
static
and
dynamic
transmission
errors
of
spur
gears.'
International Gearing
Conf.,
Univ
of
Newcastle upon
Tyne,
September
1994.
of
Static
Transmission
Error
4.1
Possibilities
and
problems
If
we
already have
a
gearbox available
and can run it
slowly under
design torque, without wrecking gears
or
bearings, then
the
reliable
and the
most
straightforward approach
is to
measure
the
quasi-static T.E. (see
Chapter
7).
This gives
a
very reliable answer with
an
accuracy
of a fraction
of
a
micron
and can
give
major
clues
if
anything
is
going badly wrong.
However,
at the
design stage
it is
desirable
to
have
an
idea
of
what
the
reaction
of the
design will
be to the
inevitable manufacturing errors,
as far
as
noise
and
stress
are
concerned. Conversely,
if an
existing
box is
tested,
it
is
an
advantage
to
know what errors might have produced
a
given
(undesirable) result. There
is a
fundamental problem
as
mentioned
in
section
1.5
that
a
dozen
effects,
each
of
possibly
2 um
metrology uncertainty,
combine
to
give
an
answer,
the
T.E.,
which should
be
better than
1 um
uncertainty.
It
is
worth noting that
in
practice
the
most critical accuracy
is the
profile,
so it is
worth taking extra care with this measurement. When
the
profile
is
being measured with
a
conventional
3-D
co-ordinate
measuring
machine,
we
must allow
for all the
errors
on two
axes
(x and y) so it is
difficult
to
achieve better than about
3 um
accuracy despite
the
manufacturer's
claims.
If we
take
the
trouble
to
position
a
particular
flank
as
shown
in
Fig.
4.1
we can
improve accuracy
by at
least
a
factor
of 2. The
co-
ordinates
of the
pitch
point
on the
flank
are
simply
(r^,
rt,tan<j>)
and the
gear
does
not
have
to be
exactly
in
position.
The
gain
in
accuracy
arises
because
there
is
very little movement
in the y
direction
as the
profile
is
traversed,
so
errors
in
this axis
are
minimal
and
movements
in the x
direction have very
little
effect
on the
(small)
y
corrections
so
errors
in x are
unimportant.
Accuracy
can
then
be
better than
lum.
Despite
the
practical uncertainties
of
manufacturing accuracies,
misalignments,
and
deflections,
it is
very worthwhile
to use a
simple
computer
model
to
check whether
a
design
is or is not
tolerant
of
errors,
to
assess
the
relative importance
of the
various errors
on
noise
and
stresses
and
to set
realistic limits.
37
38
Chapter
4
tooth flank
y
Fig 4.1
Improving
profile
accuracy
by
tooth position.
A
model
to
check this does
not
necessarily have
to be
extremely
accurate,
perhaps within
a few
percent,
but it
should
be
able
to
give
a
quick,
cheap comparative assessment
of
different
designs with realistic assumptions.
There
are
full
3-D
finite
element programs which take
a
gear tooth
and
calculate
the
deflections when
it
meshes with another gear tooth
but
such
models
are
extremely complex. Since there
can
easily
be of the
order
of
10,000 node points
in a
realistic model with perhaps 1000 boundary points
defining
a
tooth shape,
the
calculations
are
large and, equally important,
there
is a
large technical
effort
required each time
to
enter each
set of
boundary conditions. This level
of
effort
is
justified
for
very high
performance
(expensive) gearing
[1],
especially
if
"corner"
relief
is
used,
but
is
uneconomic
for
normal industrial gearboxes.
A
simpler, cheaper model
of
gear tooth meshing
is
needed compatible with practical
realities
of
permissible computer
and
software
costs
and the
practicability
of the
amount
of
input information required.
4.2
Thin
slice
assumptions
A
suitable model
to
choose
in
practice
as a
compromise
is the
"thin
slice"
model.
The
helical
gear
is
assumed
to act as if it
were
a
pack
of
thin
2-
dimensional
slices
with each slice
of
tooth behaving independently
of its
neighbours
and
deflecting solely
due to the
contact forces
on
that slice.
Prediction
of
Static
T.E.
39
Fig
4.2
Sketch
of
thin slice model
of
helical gear.
Exactly
whether
we are
better
to
take
the
"slices"
in the
transverse
plane
and
assume that each slice
is
restrained axially
by its
neighbours,
or
whether
we
think
of a
slice local
to a
tooth
and
normal
to the
tooth,
is a
problem
which
is
open
to
argument. Fortunately
it
makes negligible
difference
for
helical gears with
low
helix angles
so it is
simpler
to
think
in
the
transverse plane,
as
sketched
in
Fig. 4.2.
The
principal theoretical
objection
to the
thin slice model
is
"buttressing"
because
we
know that
if we
apply
a
load
at one
point only
on a
tooth
the
local deflections
are
less than
the
"thin
slice"
estimate because
the
neighbouring slices support
or
"buttress"
the
slice,
due to
shear
stresses
and to
longitudinal bending
stresses.
At
the end of a
tooth
the
local
stiffness
is
significantly lower because
there
is no
support
from the
outboard end,
as
well
as the
effective
modulus
being lower
due to
axial expansion reducing
Poisson's
ratio
effects.
loading
h
I I I I I I I I
facewidth
Fig
4.3
Typical variation
of
load between gear
'slices.'